Ticket #587 (assigned maintenance)
Puffin MySQL Tuning
| Reported by: | chris | Owned by: | chris |
|---|---|---|---|
| Priority: | major | Milestone: | Maintenance |
| Component: | Live server | Keywords: | |
| Cc: | paul, ade | Estimated Number of Hours: | 0.0 |
| Add Hours to Ticket: | 0 | Billable?: | yes |
| Total Hours: | 4.55 |
Description
This ticket is to track the tuning we do to MySQL on PuffinServer.
See also previous comments on this issue:
- ticket:555#comment:12
- ticket:555#comment:15
- ticket:555#comment:16
- ticket:555#comment:17
- ticket:555#comment:20
- ticket:555#comment:29
- ticket:555#SettingsChanged
- ticket:555#comment:39
- ticket:555#comment:56
- ticket:555#comment:57
- ticket:555#comment:60
- ticket:555#comment:65
- ticket:555#comment:66
- ticket:555#comment:67
- ticket:555#comment:68
- ticket:555#comment:82
- ticket:555#comment:85
Attachments
Change History
comment:1 Changed 3 years ago by chris
- Add Hours to Ticket changed from 0.0 to 0.25
- Total Hours changed from 0.0 to 0.25
comment:2 Changed 3 years ago by chris
- Add Hours to Ticket changed from 0.0 to 0.25
- Total Hours changed from 0.25 to 0.5
I'm not aware of any changes having been made to Mysql since the above data was posted, apart from a RAM disk being added for the tmp tables, see ticket:591 and the two week New Relic trial, see ticket:586
For reference this is the current output of perl /usr/local/bin/mysqltuner.pl:
>> MySQLTuner 1.2.0 - Major Hayden <major@mhtx.net>
>> Bug reports, feature requests, and downloads at http://mysqltuner.com/
>> Run with '--help' for additional options and output filtering
[OK] Logged in using credentials from debian maintenance account.
-------- General Statistics --------------------------------------------------
[--] Skipped version check for MySQLTuner script
[OK] Currently running supported MySQL version 5.5.33a-MariaDB-1~squeeze-log
[OK] Operating on 64-bit architecture
-------- Storage Engine Statistics -------------------------------------------
[--] Status: +Archive -BDB +Federated +InnoDB -ISAM -NDBCluster
[--] Data in MyISAM tables: 108M (Tables: 2)
[--] Data in InnoDB tables: 456M (Tables: 1042)
[--] Data in PERFORMANCE_SCHEMA tables: 0B (Tables: 17)
[!!] Total fragmented tables: 99
-------- Security Recommendations -------------------------------------------
[OK] All database users have passwords assigned
-------- Performance Metrics -------------------------------------------------
[--] Up for: 3d 8h 27m 14s (24M q [84.687 qps], 1M conn, TX: 49B, RX: 3B)
[--] Reads / Writes: 72% / 28%
[--] Total buffers: 3.8G global + 140.8M per thread (75 max threads)
[!!] Maximum possible memory usage: 14.1G (176% of installed RAM)
[OK] Slow queries: 0% (156K/24M)
[OK] Highest usage of available connections: 58% (44/75)
[OK] Key buffer size / total MyISAM indexes: 256.0M/106.0M
[OK] Key buffer hit rate: 100.0% (70M cached / 31K reads)
[OK] Query cache efficiency: 86.9% (18M cached / 20M selects)
[OK] Query cache prunes per day: 0
[OK] Sorts requiring temporary tables: 0% (2K temp sorts / 276K sorts)
[!!] Joins performed without indexes: 12443
[OK] Temporary tables created on disk: 23% (103K on disk / 440K total)
[OK] Thread cache hit rate: 99% (44 created / 1M connections)
[OK] Table cache hit rate: 21% (3K open / 17K opened)
[OK] Open file limit used: 0% (85/196K)
[OK] Table locks acquired immediately: 99% (4M immediate / 4M locks)
[OK] InnoDB data size / buffer pool: 456.7M/1.0G
-------- Recommendations -----------------------------------------------------
General recommendations:
Run OPTIMIZE TABLE to defragment tables for better performance
Reduce your overall MySQL memory footprint for system stability
Adjust your join queries to always utilize indexes
Variables to adjust:
*** MySQL's maximum memory usage is dangerously high ***
*** Add RAM before increasing MySQL buffer variables ***
join_buffer_size (> 128.0M, or always use indexes with joins)
And this is the output of bash /usr/local/bin/tuning-primer.sh:
-- MYSQL PERFORMANCE TUNING PRIMER --
- By: Matthew Montgomery -
MySQL Version 5.5.33a-MariaDB-1~squeeze-log x86_64
Uptime = 3 days 8 hrs 29 min 57 sec
Avg. qps = 84
Total Questions = 24544095
Threads Connected = 3
Server has been running for over 48hrs.
It should be safe to follow these recommendations
To find out more information on how each of these
runtime variables effects performance visit:
http://dev.mysql.com/doc/refman/5.5/en/server-system-variables.html
Visit http://www.mysql.com/products/enterprise/advisors.html
for info about MySQL's Enterprise Monitoring and Advisory Service
SLOW QUERIES
The slow query log is enabled.
Current long_query_time = 5.000000 sec.
You have 156209 out of 24544138 that take longer than 5.000000 sec. to complete
Your long_query_time seems to be fine
BINARY UPDATE LOG
The binary update log is NOT enabled.
You will not be able to do point in time recovery
See http://dev.mysql.com/doc/refman/5.5/en/point-in-time-recovery.html
WORKER THREADS
Current thread_cache_size = 128
Current threads_cached = 41
Current threads_per_sec = 0
Historic threads_per_sec = 0
Your thread_cache_size is fine
MAX CONNECTIONS
Current max_connections = 75
Current threads_connected = 3
Historic max_used_connections = 44
The number of used connections is 58% of the configured maximum.
Your max_connections variable seems to be fine.
INNODB STATUS
Current InnoDB index space = 181 M
Current InnoDB data space = 456 M
Current InnoDB buffer pool free = 40 %
Current innodb_buffer_pool_size = 1.00 G
Depending on how much space your innodb indexes take up it may be safe
to increase this value to up to 2 / 3 of total system memory
MEMORY USAGE
Max Memory Ever Allocated : 7.80 G
Configured Max Per-thread Buffers : 10.30 G
Configured Max Global Buffers : 1.76 G
Configured Max Memory Limit : 12.07 G
Physical Memory : 7.98 G
Max memory limit exceeds 90% of physical memory
KEY BUFFER
Current MyISAM index space = 106 M
Current key_buffer_size = 256 M
Key cache miss rate is 1 : 2265
Key buffer free ratio = 69 %
Your key_buffer_size seems to be fine
QUERY CACHE
Query cache is enabled
Current query_cache_size = 512 M
Current query_cache_used = 282 M
Current query_cache_limit = 2 M
Current Query cache Memory fill ratio = 55.18 %
Current query_cache_min_res_unit = 1 K
Query Cache is 22 % fragmented
Run "FLUSH QUERY CACHE" periodically to defragment the query cache memory
If you have many small queries lower 'query_cache_min_res_unit' to reduce fragmentation.
MySQL won't cache query results that are larger than query_cache_limit in size
SORT OPERATIONS
Current sort_buffer_size = 512 K
Current read_rnd_buffer_size = 4 M
Sort buffer seems to be fine
JOINS
/usr/local/bin/tuning-primer.sh: line 402: export: `2097152': not a valid identifier
Current join_buffer_size = 128.00 M
You have had 12445 queries where a join could not use an index properly
join_buffer_size >= 4 M
This is not advised
You should enable "log-queries-not-using-indexes"
Then look for non indexed joins in the slow query log.
OPEN FILES LIMIT
Current open_files_limit = 196608 files
The open_files_limit should typically be set to at least 2x-3x
that of table_cache if you have heavy MyISAM usage.
Your open_files_limit value seems to be fine
TABLE CACHE
Current table_open_cache = 8192 tables
Current table_definition_cache = 6144 tables
You have a total of 1085 tables
You have 3702 open tables.
The table_cache value seems to be fine
TEMP TABLES
Current max_heap_table_size = 4.00 G
Current tmp_table_size = 2.00 G
Of 337119 temp tables, 23% were created on disk
Created disk tmp tables ratio seems fine
TABLE SCANS
Current read_buffer_size = 8 M
Current table scan ratio = 117 : 1
read_buffer_size seems to be fine
TABLE LOCKING
Current Lock Wait ratio = 1 : 777862
Your table locking seems to be fine
Jim, should we follow up these suggestions?
You have had 12445 queries where a join could not use an index properly
You should enable "log-queries-not-using-indexes"
Then look for non indexed joins in the slow query log.
I think it's also worth nothing that there are still a lot of queries taking longer than 5 seconds, 150k out of 25M:
Current long_query_time = 5.000000 sec.
You have 156209 out of 24544138 that take longer than 5.000000 sec. to complete
comment:3 Changed 3 years ago by chris
- Add Hours to Ticket changed from 0.0 to 0.3
- Total Hours changed from 0.5 to 0.8
The MySQL server is using a steady 2GB of RAM, see this Munin graph.
Based on the following it would probably be safe to increase the query_cache_size and decrease the max_connections and max_user_connections (see the threads graph) but I would be inclined to do this in conjunction with reducing the number of php-fpm processes as these use a lot of RAM but are hardly ever used, see the php-fpm status graph.
The current output of perl /usr/local/bin/mysqltuner.pl:
>> MySQLTuner 1.2.0 - Major Hayden <major@mhtx.net>
>> Bug reports, feature requests, and downloads at http://mysqltuner.com/
>> Run with '--help' for additional options and output filtering
[OK] Logged in using credentials from debian maintenance account.
-------- General Statistics --------------------------------------------------
[--] Skipped version check for MySQLTuner script
[OK] Currently running supported MySQL version 5.5.33a-MariaDB-1~squeeze-log
[OK] Operating on 64-bit architecture
-------- Storage Engine Statistics -------------------------------------------
[--] Status: +Archive -BDB +Federated +InnoDB -ISAM -NDBCluster
[--] Data in MyISAM tables: 163M (Tables: 3)
[--] Data in InnoDB tables: 689M (Tables: 1436)
[--] Data in PERFORMANCE_SCHEMA tables: 0B (Tables: 17)
[!!] Total fragmented tables: 124
-------- Security Recommendations -------------------------------------------
[OK] All database users have passwords assigned
-------- Performance Metrics -------------------------------------------------
[--] Up for: 28d 4h 34m 36s (148M q [60.786 qps], 4M conn, TX: 293B, RX: 26B)
[--] Reads / Writes: 71% / 29%
[--] Total buffers: 3.8G global + 140.8M per thread (75 max threads)
[!!] Maximum possible memory usage: 14.1G (176% of installed RAM)
[OK] Slow queries: 0% (1M/148M)
[OK] Highest usage of available connections: 56% (42/75)
[OK] Key buffer size / total MyISAM indexes: 256.0M/162.1M
[OK] Key buffer hit rate: 100.0% (676M cached / 93K reads)
[OK] Query cache efficiency: 85.7% (111M cached / 129M selects)
[!!] Query cache prunes per day: 46331
[OK] Sorts requiring temporary tables: 1% (31K temp sorts / 1M sorts)
[!!] Joins performed without indexes: 92974
[OK] Temporary tables created on disk: 24% (694K on disk / 2M total)
[OK] Thread cache hit rate: 99% (42 created / 4M connections)
[!!] Table cache hit rate: 4% (3K open / 61K opened)
[OK] Open file limit used: 0% (83/196K)
[OK] Table locks acquired immediately: 99% (31M immediate / 31M locks)
[OK] InnoDB data size / buffer pool: 689.3M/1.0G
-------- Recommendations -----------------------------------------------------
General recommendations:
Run OPTIMIZE TABLE to defragment tables for better performance
Reduce your overall MySQL memory footprint for system stability
Increasing the query_cache size over 128M may reduce performance
Adjust your join queries to always utilize indexes
Increase table_cache gradually to avoid file descriptor limits
Variables to adjust:
*** MySQL's maximum memory usage is dangerously high ***
*** Add RAM before increasing MySQL buffer variables ***
query_cache_size (> 512M) [see warning above]
join_buffer_size (> 128.0M, or always use indexes with joins)
table_cache (> 8192)
And this is the output of bash /usr/local/bin/tuning-primer.sh:
-- MYSQL PERFORMANCE TUNING PRIMER --
- By: Matthew Montgomery -
MySQL Version 5.5.33a-MariaDB-1~squeeze-log x86_64
Uptime = 28 days 4 hrs 35 min 39 sec
Avg. qps = 60
Total Questions = 148059282
Threads Connected = 3
Server has been running for over 48hrs.
It should be safe to follow these recommendations
To find out more information on how each of these
runtime variables effects performance visit:
http://dev.mysql.com/doc/refman/5.5/en/server-system-variables.html
Visit http://www.mysql.com/products/enterprise/advisors.html
for info about MySQL's Enterprise Monitoring and Advisory Service
SLOW QUERIES
The slow query log is enabled.
Current long_query_time = 5.000000 sec.
You have 1193172 out of 148059342 that take longer than 5.000000 sec. to complete
Your long_query_time seems to be fine
BINARY UPDATE LOG
The binary update log is NOT enabled.
You will not be able to do point in time recovery
See http://dev.mysql.com/doc/refman/5.5/en/point-in-time-recovery.html
WORKER THREADS
Current thread_cache_size = 128
Current threads_cached = 41
Current threads_per_sec = 0
Historic threads_per_sec = 0
Your thread_cache_size is fine
MAX CONNECTIONS
Current max_connections = 75
Current threads_connected = 1
Historic max_used_connections = 42
The number of used connections is 56% of the configured maximum.
Your max_connections variable seems to be fine.
INNODB STATUS
Current InnoDB index space = 279 M
Current InnoDB data space = 689 M
Current InnoDB buffer pool free = 2 %
Current innodb_buffer_pool_size = 1.00 G
Depending on how much space your innodb indexes take up it may be safe
to increase this value to up to 2 / 3 of total system memory
MEMORY USAGE
Max Memory Ever Allocated : 7.53 G
Configured Max Per-thread Buffers : 10.30 G
Configured Max Global Buffers : 1.76 G
Configured Max Memory Limit : 12.07 G
Physical Memory : 7.98 G
Max memory limit exceeds 90% of physical memory
KEY BUFFER
Current MyISAM index space = 162 M
Current key_buffer_size = 256 M
Key cache miss rate is 1 : 7219
Key buffer free ratio = 49 %
Your key_buffer_size seems to be too high.
Perhaps you can use these resources elsewhere
QUERY CACHE
Query cache is enabled
Current query_cache_size = 512 M
Current query_cache_used = 353 M
Current query_cache_limit = 2 M
Current Query cache Memory fill ratio = 68.97 %
Current query_cache_min_res_unit = 1 K
MySQL won't cache query results that are larger than query_cache_limit in size
SORT OPERATIONS
Current sort_buffer_size = 512 K
Current read_rnd_buffer_size = 4 M
Sort buffer seems to be fine
JOINS
/usr/local/bin/tuning-primer.sh: line 402: export: `2097152': not a valid identifier
Current join_buffer_size = 128.00 M
You have had 92976 queries where a join could not use an index properly
join_buffer_size >= 4 M
This is not advised
You should enable "log-queries-not-using-indexes"
Then look for non indexed joins in the slow query log.
OPEN FILES LIMIT
Current open_files_limit = 196608 files
The open_files_limit should typically be set to at least 2x-3x
that of table_cache if you have heavy MyISAM usage.
Your open_files_limit value seems to be fine
TABLE CACHE
Current table_open_cache = 8192 tables
Current table_definition_cache = 6144 tables
You have a total of 1480 tables
You have 3022 open tables.
The table_cache value seems to be fine
TEMP TABLES
Current max_heap_table_size = 4.00 G
Current tmp_table_size = 2.00 G
Of 2174022 temp tables, 24% were created on disk
Created disk tmp tables ratio seems fine
TABLE SCANS
Current read_buffer_size = 8 M
Current table scan ratio = 115 : 1
read_buffer_size seems to be fine
TABLE LOCKING
Current Lock Wait ratio = 1 : 15637
Your table locking seems to be fine
comment:5 Changed 3 years ago by chris
- Add Hours to Ticket changed from 0.0 to 0.25
- Total Hours changed from 0.8 to 1.05
Last night following the upgrade to Wheezy, some MySQL settings were tweaked, see ticket:535#comment:26, these are the changes that were made:
- max_connections dropped from 75 to 40, see the munin stats
- join_buffer_size doubled to 256M
- query_cache_size doubled to 1GB, see the munin stats
Following is the result of perl /usr/local/bin/mysqltuner.pl:
>> MySQLTuner 1.2.0 - Major Hayden <major@mhtx.net>
>> Bug reports, feature requests, and downloads at http://mysqltuner.com/
>> Run with '--help' for additional options and output filtering
[OK] Logged in using credentials from debian maintenance account.
-------- General Statistics --------------------------------------------------
[--] Skipped version check for MySQLTuner script
[OK] Currently running supported MySQL version 5.5.33a-MariaDB-1~squeeze-log
[OK] Operating on 64-bit architecture
-------- Storage Engine Statistics -------------------------------------------
[--] Status: +Archive -BDB +Federated +InnoDB -ISAM -NDBCluster
[--] Data in MyISAM tables: 163M (Tables: 3)
[--] Data in InnoDB tables: 695M (Tables: 1436)
[--] Data in PERFORMANCE_SCHEMA tables: 0B (Tables: 17)
[!!] Total fragmented tables: 129
-------- Security Recommendations -------------------------------------------
[OK] All database users have passwords assigned
-------- Performance Metrics -------------------------------------------------
[--] Up for: 11h 11m 40s (2M q [69.210 qps], 67K conn, TX: 4B, RX: 534M)
[--] Reads / Writes: 67% / 33%
[--] Total buffers: 4.3G global + 268.8M per thread (40 max threads)
[!!] Maximum possible memory usage: 14.8G (184% of installed RAM)
[OK] Slow queries: 1% (29K/2M)
[OK] Highest usage of available connections: 32% (13/40)
[OK] Key buffer size / total MyISAM indexes: 256.0M/162.2M
[OK] Key buffer hit rate: 99.6% (11M cached / 42K reads)
[OK] Query cache efficiency: 76.5% (1M cached / 2M selects)
[OK] Query cache prunes per day: 0
[OK] Sorts requiring temporary tables: 0% (174 temp sorts / 54K sorts)
[!!] Joins performed without indexes: 4109
[OK] Temporary tables created on disk: 21% (10K on disk / 50K total)
[OK] Thread cache hit rate: 99% (13 created / 67K connections)
[OK] Table cache hit rate: 101% (1K open / 1K opened)
[OK] Open file limit used: 0% (60/196K)
[OK] Table locks acquired immediately: 99% (960K immediate / 960K locks)
[OK] InnoDB data size / buffer pool: 695.0M/1.0G
-------- Recommendations -----------------------------------------------------
General recommendations:
Run OPTIMIZE TABLE to defragment tables for better performance
MySQL started within last 24 hours - recommendations may be inaccurate
Reduce your overall MySQL memory footprint for system stability
Adjust your join queries to always utilize indexes
Variables to adjust:
*** MySQL's maximum memory usage is dangerously high ***
*** Add RAM before increasing MySQL buffer variables ***
join_buffer_size (> 256.0M, or always use indexes with joins)
Following is the result from bash /usr/local/bin/tuning-primer.sh:
-- MYSQL PERFORMANCE TUNING PRIMER --
- By: Matthew Montgomery -
MySQL Version 5.5.33a-MariaDB-1~squeeze-log x86_64
Uptime = 0 days 11 hrs 19 min 31 sec
Avg. qps = 69
Total Questions = 2815965
Threads Connected = 1
Warning: Server has not been running for at least 48hrs.
It may not be safe to use these recommendations
To find out more information on how each of these
runtime variables effects performance visit:
http://dev.mysql.com/doc/refman/5.5/en/server-system-variables.html
Visit http://www.mysql.com/products/enterprise/advisors.html
for info about MySQL's Enterprise Monitoring and Advisory Service
SLOW QUERIES
The slow query log is enabled.
Current long_query_time = 5.000000 sec.
You have 29579 out of 2815986 that take longer than 5.000000 sec. to complete
Your long_query_time seems to be fine
BINARY UPDATE LOG
The binary update log is NOT enabled.
You will not be able to do point in time recovery
See http://dev.mysql.com/doc/refman/5.5/en/point-in-time-recovery.html
WORKER THREADS
Current thread_cache_size = 128
Current threads_cached = 10
Current threads_per_sec = 0
Historic threads_per_sec = 0
Your thread_cache_size is fine
MAX CONNECTIONS
Current max_connections = 40
Current threads_connected = 3
Historic max_used_connections = 13
The number of used connections is 32% of the configured maximum.
Your max_connections variable seems to be fine.
INNODB STATUS
Current InnoDB index space = 280 M
Current InnoDB data space = 695 M
Current InnoDB buffer pool free = 45 %
Current innodb_buffer_pool_size = 1.00 G
Depending on how much space your innodb indexes take up it may be safe
to increase this value to up to 2 / 3 of total system memory
MEMORY USAGE
Max Memory Ever Allocated : 5.67 G
Configured Max Per-thread Buffers : 10.49 G
Configured Max Global Buffers : 2.26 G
Configured Max Memory Limit : 12.75 G
Physical Memory : 7.98 G
Max memory limit exceeds 90% of physical memory
KEY BUFFER
Current MyISAM index space = 162 M
Current key_buffer_size = 256 M
Key cache miss rate is 1 : 288
Key buffer free ratio = 65 %
Your key_buffer_size seems to be fine
QUERY CACHE
Query cache is enabled
Current query_cache_size = 1.00 G
Current query_cache_used = 131 M
Current query_cache_limit = 2 M
Current Query cache Memory fill ratio = 12.87 %
Current query_cache_min_res_unit = 1 K
Your query_cache_size seems to be too high.
Perhaps you can use these resources elsewhere
MySQL won't cache query results that are larger than query_cache_limit in size
SORT OPERATIONS
Current sort_buffer_size = 512 K
Current read_rnd_buffer_size = 4 M
Sort buffer seems to be fine
JOINS
tuning-primer.sh: line 402: export: `2097152': not a valid identifier
Current join_buffer_size = 256.00 M
You have had 4114 queries where a join could not use an index properly
join_buffer_size >= 4 M
This is not advised
You should enable "log-queries-not-using-indexes"
Then look for non indexed joins in the slow query log.
OPEN FILES LIMIT
Current open_files_limit = 196608 files
The open_files_limit should typically be set to at least 2x-3x
that of table_cache if you have heavy MyISAM usage.
Your open_files_limit value seems to be fine
TABLE CACHE
Current table_open_cache = 8192 tables
Current table_definition_cache = 6144 tables
You have a total of 1480 tables
You have 1556 open tables.
The table_cache value seems to be fine
TEMP TABLES
Current max_heap_table_size = 4.00 G
Current tmp_table_size = 2.00 G
Of 40715 temp tables, 21% were created on disk
Created disk tmp tables ratio seems fine
TABLE SCANS
Current read_buffer_size = 8 M
Current table scan ratio = 64 : 1
read_buffer_size seems to be fine
TABLE LOCKING
Current Lock Wait ratio = 1 : 107307
Your table locking seems to be fine
comment:6 Changed 3 years ago by chris
- Add Hours to Ticket changed from 0.0 to 0.25
- Total Hours changed from 1.05 to 1.3
I'm not sure if there is much else we can do on this issue, is it ready to be closed?
Things to note:
- "Total fragmented tables: 128" - Jim is this something that can be addressed via BOA now, since the latest version contains "some clever improvements to help you automatically optimize all tables daily", see ticket:629#comment:1 ?
- The server has been up almost 2 days and has had 10 million queries, 5 million a day.
A couple of wiki:PuffinServer MySQL settings were tweaked on ticket:555#comment:131
query_cache_size = 512M max_connections = 60 max_user_connections = 60
Here is the latest output from perl /usr/local/bin/mysqltuner.pl
>> MySQLTuner 1.2.0 - Major Hayden <major@mhtx.net>
>> Bug reports, feature requests, and downloads at http://mysqltuner.com/
>> Run with '--help' for additional options and output filtering
[OK] Logged in using credentials from debian maintenance account.
-------- General Statistics --------------------------------------------------
[--] Skipped version check for MySQLTuner script
[OK] Currently running supported MySQL version 5.5.34-MariaDB-1~wheezy-log
[OK] Operating on 64-bit architecture
-------- Storage Engine Statistics -------------------------------------------
[--] Status: +Archive -BDB +Federated +InnoDB -ISAM -NDBCluster
[--] Data in MyISAM tables: 165M (Tables: 3)
[--] Data in InnoDB tables: 703M (Tables: 1745)
[--] Data in PERFORMANCE_SCHEMA tables: 0B (Tables: 17)
[!!] Total fragmented tables: 128
-------- Security Recommendations -------------------------------------------
[OK] All database users have passwords assigned
-------- Performance Metrics -------------------------------------------------
[--] Up for: 1d 20h 59m 12s (10M q [67.262 qps], 289K conn, TX: 20B, RX: 2B)
[--] Reads / Writes: 94% / 6%
[--] Total buffers: 3.8G global + 268.8M per thread (60 max threads)
[!!] Maximum possible memory usage: 19.5G (244% of installed RAM)
[OK] Slow queries: 0% (82K/10M)
[OK] Highest usage of available connections: 55% (33/60)
[OK] Key buffer size / total MyISAM indexes: 256.0M/164.4M
[OK] Key buffer hit rate: 99.9% (51M cached / 59K reads)
[OK] Query cache efficiency: 46.0% (8M cached / 17M selects)
[OK] Query cache prunes per day: 0
[OK] Sorts requiring temporary tables: 1% (2K temp sorts / 150K sorts)
[!!] Joins performed without indexes: 3959
[OK] Temporary tables created on disk: 22% (50K on disk / 220K total)
[OK] Thread cache hit rate: 99% (33 created / 289K connections)
[OK] Table cache hit rate: 47% (3K open / 7K opened)
[OK] Open file limit used: 0% (83/196K)
[OK] Table locks acquired immediately: 100% (2M immediate / 2M locks)
[OK] InnoDB data size / buffer pool: 703.1M/1.0G
-------- Recommendations -----------------------------------------------------
General recommendations:
Run OPTIMIZE TABLE to defragment tables for better performance
Reduce your overall MySQL memory footprint for system stability
Adjust your join queries to always utilize indexes
Variables to adjust:
*** MySQL's maximum memory usage is dangerously high ***
*** Add RAM before increasing MySQL buffer variables ***
join_buffer_size (> 256.0M, or always use indexes with joins)
And here is the latest from bash /usr/local/bin/tuning-primer.sh:
-- MYSQL PERFORMANCE TUNING PRIMER --
- By: Matthew Montgomery -
MySQL Version 5.5.34-MariaDB-1~wheezy-log x86_64
Uptime = 1 days 21 hrs 2 min 6 sec
Avg. qps = 67
Total Questions = 10904173
Threads Connected = 2
Warning: Server has not been running for at least 48hrs.
It may not be safe to use these recommendations
To find out more information on how each of these
runtime variables effects performance visit:
http://dev.mysql.com/doc/refman/5.5/en/server-system-variables.html
Visit http://www.mysql.com/products/enterprise/advisors.html
for info about MySQL's Enterprise Monitoring and Advisory Service
SLOW QUERIES
The slow query log is enabled.
Current long_query_time = 5.000000 sec.
You have 83090 out of 10904375 that take longer than 5.000000 sec. to complete
Your long_query_time seems to be fine
BINARY UPDATE LOG
The binary update log is NOT enabled.
You will not be able to do point in time recovery
See http://dev.mysql.com/doc/refman/5.5/en/point-in-time-recovery.html
WORKER THREADS
Current thread_cache_size = 128
Current threads_cached = 31
Current threads_per_sec = 0
Historic threads_per_sec = 0
Your thread_cache_size is fine
MAX CONNECTIONS
Current max_connections = 60
Current threads_connected = 3
Historic max_used_connections = 33
The number of used connections is 55% of the configured maximum.
Your max_connections variable seems to be fine.
INNODB STATUS
Current InnoDB index space = 306 M
Current InnoDB data space = 703 M
Current InnoDB buffer pool free = 9 %
Current innodb_buffer_pool_size = 1.00 G
Depending on how much space your innodb indexes take up it may be safe
to increase this value to up to 2 / 3 of total system memory
MEMORY USAGE
Max Memory Ever Allocated : 10.42 G
Configured Max Per-thread Buffers : 15.74 G
Configured Max Global Buffers : 1.76 G
Configured Max Memory Limit : 17.50 G
Physical Memory : 7.98 G
Max memory limit exceeds 90% of physical memory
KEY BUFFER
Current MyISAM index space = 164 M
Current key_buffer_size = 256 M
Key cache miss rate is 1 : 858
Key buffer free ratio = 59 %
Your key_buffer_size seems to be fine
QUERY CACHE
Query cache is enabled
Current query_cache_size = 512 M
Current query_cache_used = 339 M
Current query_cache_limit = 2 M
Current Query cache Memory fill ratio = 66.34 %
Current query_cache_min_res_unit = 1 K
MySQL won't cache query results that are larger than query_cache_limit in size
SORT OPERATIONS
Current sort_buffer_size = 512 K
Current read_rnd_buffer_size = 4 M
Sort buffer seems to be fine
JOINS
tuning-primer.sh: line 402: export: `2097152': not a valid identifier
Current join_buffer_size = 256.00 M
You have had 3961 queries where a join could not use an index properly
join_buffer_size >= 4 M
This is not advised
You should enable "log-queries-not-using-indexes"
Then look for non indexed joins in the slow query log.
OPEN FILES LIMIT
Current open_files_limit = 196608 files
The open_files_limit should typically be set to at least 2x-3x
that of table_cache if you have heavy MyISAM usage.
Your open_files_limit value seems to be fine
TABLE CACHE
Current table_open_cache = 8192 tables
Current table_definition_cache = 6144 tables
You have a total of 1789 tables
You have 3685 open tables.
The table_cache value seems to be fine
TEMP TABLES
Current max_heap_table_size = 4.00 G
Current tmp_table_size = 2.00 G
Of 170960 temp tables, 22% were created on disk
Created disk tmp tables ratio seems fine
TABLE SCANS
Current read_buffer_size = 8 M
Current table scan ratio = 18 : 1
read_buffer_size seems to be fine
TABLE LOCKING
Current Lock Wait ratio = 0 : 10905220
Your table locking seems to be fine
I have also halved the query cache size on penguin as it wasn't a good use of RAM, see:
comment:7 Changed 3 years ago by chris
- Add Hours to Ticket changed from 0.0 to 0.25
- Total Hours changed from 1.3 to 1.55
The key reason I have done some work on this is the increase in the InnoDB data size to match the buffer pool size -- the buffer pool has now been increased to be 1.5 times the size of the data size, it's is perhaps worth noting that when this ticket was opened, four months ago, we had:
[OK] InnoDB data size / buffer pool: 463.5M/1.0G
Now we have:
[OK] InnoDB data size / buffer pool: 1.0G/1.5G
Jim, any idea why the InnoDB data size has doubled in 4 months? Additional copies of the databases perhaps?
Based on the latest output from perl /usr/local/bin/mysqltuner.pl (see below) and the mysql munin stats, the following thing have been changed in /etc/mysql/my.cnf:
innodb_buffer_pool_size = 1536M table_cache = 20480 max_connections = 40 max_user_connections = 40 query_cache_size = 768M
perl /usr/local/bin/mysqltuner.pl
>> MySQLTuner 1.2.0 - Major Hayden <major@mhtx.net>
>> Bug reports, feature requests, and downloads at http://mysqltuner.com/
>> Run with '--help' for additional options and output filtering
[OK] Logged in using credentials from debian maintenance account.
-------- General Statistics --------------------------------------------------
[--] Skipped version check for MySQLTuner script
[OK] Currently running supported MySQL version 5.5.34-MariaDB-1~wheezy-log
[OK] Operating on 64-bit architecture
-------- Storage Engine Statistics -------------------------------------------
[--] Status: +Archive -BDB +Federated +InnoDB -ISAM -NDBCluster
[--] Data in MyISAM tables: 271M (Tables: 5)
[--] Data in InnoDB tables: 1G (Tables: 2087)
[--] Data in PERFORMANCE_SCHEMA tables: 0B (Tables: 17)
[!!] Total fragmented tables: 177
-------- Security Recommendations -------------------------------------------
[OK] All database users have passwords assigned
-------- Performance Metrics -------------------------------------------------
[--] Up for: 24d 20h 24m 9s (107M q [49.900 qps], 3M conn, TX: 223B, RX: 22B)
[--] Reads / Writes: 93% / 7%
[--] Total buffers: 3.8G global + 268.8M per thread (60 max threads)
[!!] Maximum possible memory usage: 19.5G (244% of installed RAM)
[OK] Slow queries: 0% (940K/107M)
[OK] Highest usage of available connections: 63% (38/60)
[OK] Key buffer size / total MyISAM indexes: 256.0M/229.8M
[OK] Key buffer hit rate: 99.9% (651M cached / 537K reads)
[OK] Query cache efficiency: 46.0% (77M cached / 168M selects)
[!!] Query cache prunes per day: 37093
[OK] Sorts requiring temporary tables: 1% (23K temp sorts / 1M sorts)
[!!] Joins performed without indexes: 40304
[OK] Temporary tables created on disk: 22% (487K on disk / 2M total)
[OK] Thread cache hit rate: 99% (38 created / 3M connections)
[!!] Table cache hit rate: 5% (4K open / 75K opened)
[OK] Open file limit used: 0% (89/196K)
[OK] Table locks acquired immediately: 99% (24M immediate / 24M locks)
[!!] InnoDB data size / buffer pool: 1.0G/1.0G
-------- Recommendations -----------------------------------------------------
General recommendations:
Run OPTIMIZE TABLE to defragment tables for better performance
Reduce your overall MySQL memory footprint for system stability
Increasing the query_cache size over 128M may reduce performance
Adjust your join queries to always utilize indexes
Increase table_cache gradually to avoid file descriptor limits
Variables to adjust:
*** MySQL's maximum memory usage is dangerously high ***
*** Add RAM before increasing MySQL buffer variables ***
query_cache_size (> 512M) [see warning above]
join_buffer_size (> 256.0M, or always use indexes with joins)
table_cache (> 8192)
innodb_buffer_pool_size (>= 1G)
comment:8 Changed 3 years ago by chris
- Add Hours to Ticket changed from 0.0 to 0.15
- Total Hours changed from 1.55 to 1.7
The max number of connections has been hit, so these have been increased from 40 to 50 in /etc/mysql/my.cnf
max_connections = 50 max_user_connections = 50
See the Munin graph for more info on this: https://penguin.transitionnetwork.org/munin/transitionnetwork.org/puffin.transitionnetwork.org/mysql_connections.html
This is the current output of perl /usr/local/bin/mysqltuner.pl:
>> MySQLTuner 1.2.0 - Major Hayden <major@mhtx.net>
>> Bug reports, feature requests, and downloads at http://mysqltuner.com/
>> Run with '--help' for additional options and output filtering
[OK] Logged in using credentials from debian maintenance account.
-------- General Statistics --------------------------------------------------
[--] Skipped version check for MySQLTuner script
[OK] Currently running supported MySQL version 5.5.34-MariaDB-1~wheezy-log
[OK] Operating on 64-bit architecture
-------- Storage Engine Statistics -------------------------------------------
[--] Status: +Archive -BDB +Federated +InnoDB -ISAM -NDBCluster
[--] Data in MyISAM tables: 60M (Tables: 2)
[--] Data in InnoDB tables: 478M (Tables: 1371)
[--] Data in PERFORMANCE_SCHEMA tables: 0B (Tables: 17)
[!!] Total fragmented tables: 88
-------- Security Recommendations -------------------------------------------
[OK] All database users have passwords assigned
-------- Performance Metrics -------------------------------------------------
[--] Up for: 1d 17h 56m 59s (16M q [107.789 qps], 262K conn, TX: 43B, RX: 4B)
[--] Reads / Writes: 86% / 14%
[--] Total buffers: 4.5G global + 268.8M per thread (40 max threads)
[!!] Maximum possible memory usage: 15.0G (187% of installed RAM)
[OK] Slow queries: 1% (270K/16M)
[!!] Highest connection usage: 100% (41/40)
[OK] Key buffer size / total MyISAM indexes: 256.0M/54.1M
[OK] Key buffer hit rate: 100.0% (340M cached / 41K reads)
[OK] Query cache efficiency: 46.1% (11M cached / 25M selects)
[OK] Query cache prunes per day: 0
[OK] Sorts requiring temporary tables: 0% (1K temp sorts / 185K sorts)
[!!] Joins performed without indexes: 28839
[OK] Temporary tables created on disk: 22% (58K on disk / 255K total)
[OK] Thread cache hit rate: 99% (41 created / 262K connections)
[!!] Table cache hit rate: 13% (2K open / 22K opened)
[OK] Open file limit used: 0% (80/196K)
[OK] Table locks acquired immediately: 99% (4M immediate / 4M locks)
[OK] InnoDB data size / buffer pool: 478.0M/1.5G
-------- Recommendations -----------------------------------------------------
General recommendations:
Run OPTIMIZE TABLE to defragment tables for better performance
Reduce your overall MySQL memory footprint for system stability
Reduce or eliminate persistent connections to reduce connection usage
Adjust your join queries to always utilize indexes
Increase table_cache gradually to avoid file descriptor limits
Variables to adjust:
*** MySQL's maximum memory usage is dangerously high ***
*** Add RAM before increasing MySQL buffer variables ***
max_connections (> 40)
wait_timeout (< 3600)
interactive_timeout (< 28800)
join_buffer_size (> 256.0M, or always use indexes with joins)
table_cache (> 20480)
Note that the InnoDB data size has halved since the last comment was posted to this ticket and that the timeout settings were changed in trac:ticket/610#comment:53
comment:9 Changed 3 years ago by chris
- Add Hours to Ticket changed from 0.0 to 0.25
- Total Hours changed from 1.7 to 1.95
Note that:
- The wait_timeout was fixed on ticket:610#comment:51 this reversed the change in ticket:555#comment:68
- It is proposed to undo all the tweaks documented on this ticket see ticket:670#etcmysqlmy.cnf
I still wonder if something can be done regarding the question asked in ticket:587#comment:6
- "Total fragmented tables: 128" - Jim is this something that can be addressed via BOA now, since the latest version contains "some clever improvements to help you automatically optimize all tables daily", see ticket:629#comment:1 ?
The latest output of perl /usr/local/bin/mysqltuner.pl and bash /usr/local/bin/tuning-primer.sh look good, things to note:
- Total fragmented tables: 125
- key_buffer_size could probably be reduced some
perl /usr/local/bin/mysqltuner.pl output:
>> MySQLTuner 1.2.0 - Major Hayden <major@mhtx.net>
>> Bug reports, feature requests, and downloads at http://mysqltuner.com/
>> Run with '--help' for additional options and output filtering
[OK] Logged in using credentials from debian maintenance account.
-------- General Statistics --------------------------------------------------
[--] Skipped version check for MySQLTuner script
[OK] Currently running supported MySQL version 5.5.34-MariaDB-1~wheezy-log
[OK] Operating on 64-bit architecture
-------- Storage Engine Statistics -------------------------------------------
[--] Status: +Archive -BDB +Federated +InnoDB -ISAM -NDBCluster
[--] Data in MyISAM tables: 62M (Tables: 3)
[--] Data in InnoDB tables: 641M (Tables: 1661)
[--] Data in PERFORMANCE_SCHEMA tables: 0B (Tables: 17)
[!!] Total fragmented tables: 125
-------- Security Recommendations -------------------------------------------
[OK] All database users have passwords assigned
-------- Performance Metrics -------------------------------------------------
[--] Up for: 2d 22h 20m 33s (26M q [104.611 qps], 468K conn, TX: 82B, RX: 5B)
[--] Reads / Writes: 86% / 14%
[--] Total buffers: 4.5G global + 268.8M per thread (50 max threads)
[!!] Maximum possible memory usage: 17.6G (220% of installed RAM)
[OK] Slow queries: 1% (352K/26M)
[OK] Highest usage of available connections: 84% (42/50)
[OK] Key buffer size / total MyISAM indexes: 256.0M/59.0M
[OK] Key buffer hit rate: 100.0% (481M cached / 29K reads)
[OK] Query cache efficiency: 46.5% (19M cached / 40M selects)
[OK] Query cache prunes per day: 0
[OK] Sorts requiring temporary tables: 0% (1K temp sorts / 328K sorts)
[!!] Joins performed without indexes: 13376
[OK] Temporary tables created on disk: 21% (81K on disk / 381K total)
[OK] Thread cache hit rate: 99% (42 created / 468K connections)
[OK] Table cache hit rate: 31% (3K open / 11K opened)
[OK] Open file limit used: 0% (86/196K)
[OK] Table locks acquired immediately: 99% (7M immediate / 7M locks)
[OK] InnoDB data size / buffer pool: 642.0M/1.5G
-------- Recommendations -----------------------------------------------------
General recommendations:
Run OPTIMIZE TABLE to defragment tables for better performance
Reduce your overall MySQL memory footprint for system stability
Adjust your join queries to always utilize indexes
Variables to adjust:
*** MySQL's maximum memory usage is dangerously high ***
*** Add RAM before increasing MySQL buffer variables ***
join_buffer_size (> 256.0M, or always use indexes with joins)
This is the latest output from bash /usr/local/bin/tuning-primer.sh:
-- MYSQL PERFORMANCE TUNING PRIMER --
- By: Matthew Montgomery -
MySQL Version 5.5.34-MariaDB-1~wheezy-log x86_64
Uptime = 2 days 22 hrs 31 min 8 sec
Avg. qps = 104
Total Questions = 26525087
Threads Connected = 3
Server has been running for over 48hrs.
It should be safe to follow these recommendations
To find out more information on how each of these
runtime variables effects performance visit:
http://dev.mysql.com/doc/refman/5.5/en/server-system-variables.html
Visit http://www.mysql.com/products/enterprise/advisors.html
for info about MySQL's Enterprise Monitoring and Advisory Service
SLOW QUERIES
The slow query log is enabled.
Current long_query_time = 5.000000 sec.
You have 352509 out of 26525235 that take longer than 5.000000 sec. to complete
Your long_query_time seems to be fine
BINARY UPDATE LOG
The binary update log is NOT enabled.
You will not be able to do point in time recovery
See http://dev.mysql.com/doc/refman/5.5/en/point-in-time-recovery.html
WORKER THREADS
Current thread_cache_size = 128
Current threads_cached = 41
Current threads_per_sec = 0
Historic threads_per_sec = 0
Your thread_cache_size is fine
MAX CONNECTIONS
Current max_connections = 50
Current threads_connected = 1
Historic max_used_connections = 42
The number of used connections is 84% of the configured maximum.
Your max_connections variable seems to be fine.
INNODB STATUS
Current InnoDB index space = 354 M
Current InnoDB data space = 642 M
Current InnoDB buffer pool free = 37 %
Current innodb_buffer_pool_size = 1.50 G
Depending on how much space your innodb indexes take up it may be safe
to increase this value to up to 2 / 3 of total system memory
MEMORY USAGE
Max Memory Ever Allocated : 13.53 G
Configured Max Per-thread Buffers : 13.12 G
Configured Max Global Buffers : 2.51 G
Configured Max Memory Limit : 15.63 G
Physical Memory : 7.98 G
Max memory limit exceeds 90% of physical memory
KEY BUFFER
Current MyISAM index space = 58 M
Current key_buffer_size = 256 M
Key cache miss rate is 1 : 16192
Key buffer free ratio = 69 %
Your key_buffer_size seems to be too high.
Perhaps you can use these resources elsewhere
QUERY CACHE
Query cache is enabled
Current query_cache_size = 768 M
Current query_cache_used = 411 M
Current query_cache_limit = 2 M
Current Query cache Memory fill ratio = 53.61 %
Current query_cache_min_res_unit = 1 K
MySQL won't cache query results that are larger than query_cache_limit in size
SORT OPERATIONS
Current sort_buffer_size = 512 K
Current read_rnd_buffer_size = 4 M
Sort buffer seems to be fine
JOINS
/usr/local/bin/tuning-primer.sh: line 402: export: `2097152': not a valid identifier
Current join_buffer_size = 256.00 M
You have had 13378 queries where a join could not use an index properly
join_buffer_size >= 4 M
This is not advised
You should enable "log-queries-not-using-indexes"
Then look for non indexed joins in the slow query log.
OPEN FILES LIMIT
Current open_files_limit = 196608 files
The open_files_limit should typically be set to at least 2x-3x
that of table_cache if you have heavy MyISAM usage.
Your open_files_limit value seems to be fine
TABLE CACHE
Current table_open_cache = 20480 tables
Current table_definition_cache = 6144 tables
You have a total of 1705 tables
You have 3617 open tables.
The table_cache value seems to be fine
TEMP TABLES
Current max_heap_table_size = 4.00 G
Current tmp_table_size = 2.00 G
Of 300793 temp tables, 21% were created on disk
Created disk tmp tables ratio seems fine
TABLE SCANS
Current read_buffer_size = 8 M
Current table scan ratio = 17 : 1
read_buffer_size seems to be fine
TABLE LOCKING
Current Lock Wait ratio = 1 : 447830
Your table locking seems to be fine
comment:10 Changed 3 years ago by chris
This ticket is now dependant on the proposal to revert all the customisations, see ticket:670
comment:11 follow-up: ↓ 12 Changed 3 years ago by chris
- Add Hours to Ticket changed from 0.0 to 0.75
- Total Hours changed from 1.95 to 2.7
Last night with the upgrade to BOA 2.2.2 (see ticket:707) all the MySQL customisations were overwritten so that BOA defaults are used (see ticket:670) and this has results in a 50% reduction in the MySQL memory use:
A slight change in the pattern of commands:
The number of connections is now maxed out, there is no slack, I expect there will be connections refused errors as a result of this but I haven't yet checked the logs for these:
There appears to be no table cache any more:
There is a slight change in the pattern of handlers:
The inodedb buffer pool is smaller:
Inodedb transactions are up:
Not sure why the myisam indexes have dropped to zero:
Myisam key cache is around half the size:
The slow queries have dropped to zero, but I suspect this is simply because the logging of them has been switched off by BOA rather than there being no slow queries:
The throughpout is dramatically up, but I'm not sure what exactly this means:
Network traffic is dramatically up, again I'm not sure exactly what it means:
The query cache is a lot smaller:
Table locks are up:
Here is the mysqltuner script output:
perl /usr/local/bin/mysqltuner.pl
>> MySQLTuner 1.2.0 - Major Hayden <major@mhtx.net>
>> Bug reports, feature requests, and downloads at http://mysqltuner.com/
>> Run with '--help' for additional options and output filtering
[OK] Logged in using credentials from debian maintenance account.
-------- General Statistics --------------------------------------------------
[--] Skipped version check for MySQLTuner script
[OK] Currently running supported MySQL version 5.5.36-MariaDB-1~wheezy
[OK] Operating on 64-bit architecture
-------- Storage Engine Statistics -------------------------------------------
[--] Status: +Archive -BDB +Federated +InnoDB -ISAM -NDBCluster
[--] Data in MyISAM tables: 129M (Tables: 5)
[--] Data in InnoDB tables: 1G (Tables: 2276)
[--] Data in PERFORMANCE_SCHEMA tables: 0B (Tables: 17)
[!!] Total fragmented tables: 227
-------- Security Recommendations -------------------------------------------
[OK] All database users have passwords assigned
-------- Performance Metrics -------------------------------------------------
[--] Up for: 15h 6m 26s (3M q [71.453 qps], 79K conn, TX: 70B, RX: 8B)
[--] Reads / Writes: 85% / 15%
[--] Total buffers: 2.3G global + 20.4M per thread (30 max threads)
[OK] Maximum possible memory usage: 2.9G (35% of installed RAM)
[OK] Slow queries: 0% (147/3M)
[!!] Highest connection usage: 100% (31/30)
[!!] Key buffer size / total MyISAM indexes: 129.0M/156.5M
[!!] Key buffer hit rate: 86.3% (694 cached / 95 reads)
[OK] Query cache efficiency: 40.4% (2M cached / 5M selects)
[!!] Query cache prunes per day: 402772
[OK] Sorts requiring temporary tables: 4% (2K temp sorts / 68K sorts)
[!!] Joins performed without indexes: 2414
[!!] Temporary tables created on disk: 30% (24K on disk / 82K total)
[OK] Thread cache hit rate: 99% (41 created / 79K connections)
[!!] Table cache hit rate: 0% (128 open / 53K opened)
[OK] Open file limit used: 0% (5/196K)
[OK] Table locks acquired immediately: 99% (1M immediate / 1M locks)
[!!] InnoDB data size / buffer pool: 1.4G/1021.0M
-------- Recommendations -----------------------------------------------------
General recommendations:
Run OPTIMIZE TABLE to defragment tables for better performance
MySQL started within last 24 hours - recommendations may be inaccurate
Enable the slow query log to troubleshoot bad queries
Reduce or eliminate persistent connections to reduce connection usage
Adjust your join queries to always utilize indexes
Temporary table size is already large - reduce result set size
Reduce your SELECT DISTINCT queries without LIMIT clauses
Increase table_cache gradually to avoid file descriptor limits
Variables to adjust:
max_connections (> 30)
wait_timeout (< 3600)
interactive_timeout (< 28800)
key_buffer_size (> 156.5M)
query_cache_size (> 128M)
join_buffer_size (> 4.0M, or always use indexes with joins)
table_cache (> 128)
innodb_buffer_pool_size (>= 1G)
comment:12 in reply to: ↑ 11 Changed 3 years ago by chris
- Add Hours to Ticket changed from 0.0 to 0.25
- Total Hours changed from 2.7 to 2.95
Replying to chris:
The slow queries have dropped to zero, but I suspect this is simply because the logging of them has been switched off by BOA rather than there being no slow queries:
This is because the slow queries are no longer logged:
This is what we have in /etc/mysql/my.cnf:
#slow_query_log = 1 #long_query_time = 10 #slow_query_log_file = /var/log/mysql/sql-slow-query.log #log_queries_not_using_indexes
We could re-enable the slow_query_log but that would breach the "Roll back performance customisations and use stock BOA settings where possible" policy, ticket:670.
Network traffic is dramatically up, again I'm not sure exactly what it means:
This was caused because the BOA upgrade didn't create the directory for the Redis pid file and it therefore couldn't be started, see ticket:707#comment:31, with Redis running again this graph has gone back to how it was before:
Following is the latest output from perl /usr/local/bin/mysqltuner.pl:
>> MySQLTuner 1.2.0 - Major Hayden <major@mhtx.net>
>> Bug reports, feature requests, and downloads at http://mysqltuner.com/
>> Run with '--help' for additional options and output filtering
[OK] Logged in using credentials from debian maintenance account.
-------- General Statistics --------------------------------------------------
[--] Skipped version check for MySQLTuner script
[OK] Currently running supported MySQL version 5.5.36-MariaDB-1~wheezy
[OK] Operating on 64-bit architecture
-------- Storage Engine Statistics -------------------------------------------
[--] Status: +Archive -BDB +Federated +InnoDB -ISAM -NDBCluster
[--] Data in MyISAM tables: 129M (Tables: 5)
[--] Data in InnoDB tables: 1G (Tables: 2276)
[--] Data in PERFORMANCE_SCHEMA tables: 0B (Tables: 17)
[!!] Total fragmented tables: 231
-------- Security Recommendations -------------------------------------------
[OK] All database users have passwords assigned
-------- Performance Metrics -------------------------------------------------
[--] Up for: 2d 15h 9m 46s (18M q [80.569 qps], 353K conn, TX: 295B, RX: 37B)
[--] Reads / Writes: 86% / 14%
[--] Total buffers: 2.3G global + 20.4M per thread (30 max threads)
[OK] Maximum possible memory usage: 2.9G (35% of installed RAM)
[OK] Slow queries: 0% (297/18M)
[!!] Highest connection usage: 100% (31/30)
[!!] Key buffer size / total MyISAM indexes: 129.0M/156.5M
[!!] Key buffer hit rate: 91.2% (14K cached / 1K reads)
[OK] Query cache efficiency: 40.9% (10M cached / 25M selects)
[!!] Query cache prunes per day: 476681
[OK] Sorts requiring temporary tables: 5% (18K temp sorts / 342K sorts)
[!!] Joins performed without indexes: 12136
[!!] Temporary tables created on disk: 29% (110K on disk / 376K total)
[OK] Thread cache hit rate: 99% (41 created / 353K connections)
[!!] Table cache hit rate: 0% (128 open / 164K opened)
[OK] Open file limit used: 0% (3/196K)
[OK] Table locks acquired immediately: 99% (7M immediate / 7M locks)
[!!] InnoDB data size / buffer pool: 1.3G/1021.0M
-------- Recommendations -----------------------------------------------------
General recommendations:
Run OPTIMIZE TABLE to defragment tables for better performance
Enable the slow query log to troubleshoot bad queries
Reduce or eliminate persistent connections to reduce connection usage
Adjust your join queries to always utilize indexes
Temporary table size is already large - reduce result set size
Reduce your SELECT DISTINCT queries without LIMIT clauses
Increase table_cache gradually to avoid file descriptor limits
Variables to adjust:
max_connections (> 30)
wait_timeout (< 3600)
interactive_timeout (< 28800)
key_buffer_size (> 156.5M)
query_cache_size (> 128M)
join_buffer_size (> 4.0M, or always use indexes with joins)
table_cache (> 128)
innodb_buffer_pool_size (>= 1G)
All the above suggestions, apart from the timeout ones, look sensible to me and would probably result in the MySQL server preforming faster, but again this would void the the "Roll back performance customisations and use stock BOA settings where possible" policy, ticket:670, so the settings have been left unchanged.
comment:13 follow-up: ↓ 16 Changed 3 years ago by chris
Here is the latest result of perl /usr/local/bin/mysqltuner.pl:
>> MySQLTuner 1.2.0 - Major Hayden <major@mhtx.net>
>> Bug reports, feature requests, and downloads at http://mysqltuner.com/
>> Run with '--help' for additional options and output filtering
[OK] Logged in using credentials from debian maintenance account.
-------- General Statistics --------------------------------------------------
[--] Skipped version check for MySQLTuner script
[OK] Currently running supported MySQL version 5.5.36-MariaDB-1~wheezy
[OK] Operating on 64-bit architecture
-------- Storage Engine Statistics -------------------------------------------
[--] Status: +Archive -BDB +Federated +InnoDB -ISAM -NDBCluster
[--] Data in MyISAM tables: 129M (Tables: 5)
[--] Data in InnoDB tables: 1G (Tables: 2276)
[--] Data in PERFORMANCE_SCHEMA tables: 0B (Tables: 17)
[!!] Total fragmented tables: 205
-------- Security Recommendations -------------------------------------------
[OK] All database users have passwords assigned
-------- Performance Metrics -------------------------------------------------
[--] Up for: 4d 13h 30m 18s (26M q [66.090 qps], 580K conn, TX: 324B, RX: 38B)
[--] Reads / Writes: 86% / 14%
[--] Total buffers: 2.3G global + 20.4M per thread (30 max threads)
[OK] Maximum possible memory usage: 2.9G (35% of installed RAM)
[OK] Slow queries: 0% (321/26M)
[!!] Highest connection usage: 100% (31/30)
[!!] Key buffer size / total MyISAM indexes: 129.0M/156.5M
[!!] Key buffer hit rate: 92.0% (35K cached / 2K reads)
[OK] Query cache efficiency: 42.3% (15M cached / 36M selects)
[!!] Query cache prunes per day: 409844
[OK] Sorts requiring temporary tables: 6% (32K temp sorts / 519K sorts)
[!!] Joins performed without indexes: 17573
[!!] Temporary tables created on disk: 29% (169K on disk / 579K total)
[OK] Thread cache hit rate: 99% (41 created / 580K connections)
[!!] Table cache hit rate: 0% (128 open / 251K opened)
[OK] Open file limit used: 0% (3/196K)
[OK] Table locks acquired immediately: 99% (9M immediate / 9M locks)
[!!] InnoDB data size / buffer pool: 1.0G/1021.0M
-------- Recommendations -----------------------------------------------------
General recommendations:
Run OPTIMIZE TABLE to defragment tables for better performance
Enable the slow query log to troubleshoot bad queries
Reduce or eliminate persistent connections to reduce connection usage
Adjust your join queries to always utilize indexes
Temporary table size is already large - reduce result set size
Reduce your SELECT DISTINCT queries without LIMIT clauses
Increase table_cache gradually to avoid file descriptor limits
Variables to adjust:
max_connections (> 30)
wait_timeout (< 3600)
interactive_timeout (< 28800)
key_buffer_size (> 156.5M)
query_cache_size (> 128M)
join_buffer_size (> 4.0M, or always use indexes with joins)
table_cache (> 128)
innodb_buffer_pool_size (>= 1G)
I think we should breach the "use stock BOA settings where possible" policy, ticket:670 to change these things:
- Enable the slow_query_log so we can find out if things are better or worse then before
Then, after some days:
- innodb_buffer_pool_size should have some slack and be perhaps 250MB or so bigger than the InnoDB data size
- max_connections should be higher as it has been maxed out
Then based on what is happening with the slow query log consider and the result of the changes above consider:
- Increasing: key_buffer_size, query_cache_size and table_cache
comment:14 Changed 2 years ago by chris
The latest output of perl /usr/local/bin/mysqltuner.pl:
>> MySQLTuner 1.2.0 - Major Hayden <major@mhtx.net>
>> Bug reports, feature requests, and downloads at http://mysqltuner.com/
>> Run with '--help' for additional options and output filtering
[OK] Logged in using credentials from debian maintenance account.
-------- General Statistics --------------------------------------------------
[--] Skipped version check for MySQLTuner script
[OK] Currently running supported MySQL version 5.5.37-MariaDB-1~wheezy
[OK] Operating on 64-bit architecture
-------- Storage Engine Statistics -------------------------------------------
[--] Status: +Archive -BDB +Federated +InnoDB -ISAM -NDBCluster
[--] Data in MyISAM tables: 192M (Tables: 6)
[--] Data in InnoDB tables: 1G (Tables: 2566)
[--] Data in PERFORMANCE_SCHEMA tables: 0B (Tables: 17)
[!!] Total fragmented tables: 244
-------- Security Recommendations -------------------------------------------
[OK] All database users have passwords assigned
-------- Performance Metrics -------------------------------------------------
[--] Up for: 24d 12h 45m 41s (143M q [67.700 qps], 3M conn, TX: 519B, RX: 23B)
[--] Reads / Writes: 87% / 13%
[--] Total buffers: 2.3G global + 20.4M per thread (30 max threads)
[OK] Maximum possible memory usage: 2.9G (36% of installed RAM)
[OK] Slow queries: 0% (509/143M)
[!!] Highest connection usage: 100% (31/30)
[OK] Key buffer size / total MyISAM indexes: 193.0M/204.2M
[OK] Key buffer hit rate: 98.2% (644M cached / 11M reads)
[OK] Query cache efficiency: 44.6% (94M cached / 211M selects)
[!!] Query cache prunes per day: 499533
[OK] Sorts requiring temporary tables: 3% (128K temp sorts / 3M sorts)
[!!] Joins performed without indexes: 123743
[!!] Temporary tables created on disk: 27% (1M on disk / 3M total)
[OK] Thread cache hit rate: 99% (31 created / 3M connections)
[!!] Table cache hit rate: 0% (128 open / 1M opened)
[OK] Open file limit used: 0% (3/196K)
[OK] Table locks acquired immediately: 99% (45M immediate / 45M locks)
[!!] InnoDB data size / buffer pool: 1.3G/1021.0M
-------- Recommendations -----------------------------------------------------
General recommendations:
Run OPTIMIZE TABLE to defragment tables for better performance
Enable the slow query log to troubleshoot bad queries
Reduce or eliminate persistent connections to reduce connection usage
Adjust your join queries to always utilize indexes
Temporary table size is already large - reduce result set size
Reduce your SELECT DISTINCT queries without LIMIT clauses
Increase table_cache gradually to avoid file descriptor limits
Variables to adjust:
max_connections (> 30)
wait_timeout (< 3600)
interactive_timeout (< 28800)
query_cache_size (> 128M)
join_buffer_size (> 4.0M, or always use indexes with joins)
table_cache (> 128)
innodb_buffer_pool_size (>= 1G)
comment:15 Changed 2 years ago by chris
If we do change the default BOA MySQL settings we will also need to change the following variable in /root/.barracuda.cnf:
_CUSTOM_CONFIG_SQL=NO
To ensure the changes are not clobbered.
comment:16 in reply to: ↑ 13 Changed 2 years ago by chris
- Add Hours to Ticket changed from 0.0 to 1.0
- Total Hours changed from 2.95 to 3.95
Replying to chris:
I think we should breach the "use stock BOA settings where possible" policy, ticket:670 to change these things:
- Enable the slow_query_log so we can find out if things are better or worse then before
Then, after some days:
- innodb_buffer_pool_size should have some slack and be perhaps 250MB or so bigger than the InnoDB data size
- max_connections should be higher as it has been maxed out
Then based on what is happening with the slow query log consider and the result of the changes above consider:
- Increasing: key_buffer_size, query_cache_size and table_cache
This was discussed in a Ttech Skype meeting today and it was agreed to do the above.
So I have edited /root/.barracuda.cnf:
#_CUSTOM_CONFIG_SQL=NO _CUSTOM_CONFIG_SQL=YES
And /etc/mysql/my.cnf to change:
# following 3 lines un commented on 2014-07-19 by chris slow_query_log = 1 long_query_time = 5 slow_query_log_file = /var/log/mysql/sql-slow-query.log
I have set the long_query_time to 5 seconds as this is what it was set to before when it was enabled (the commented out BOA default was 10 seconds).
Before restarting MySQL I ran perl /usr/local/bin/mysqltuner.pl and following is the output:
>> MySQLTuner 1.2.0 - Major Hayden <major@mhtx.net>
>> Bug reports, feature requests, and downloads at http://mysqltuner.com/
>> Run with '--help' for additional options and output filtering
[OK] Logged in using credentials from debian maintenance account.
-------- General Statistics --------------------------------------------------
[--] Skipped version check for MySQLTuner script
[OK] Currently running supported MySQL version 5.5.38-MariaDB-1~wheezy
[OK] Operating on 64-bit architecture
-------- Storage Engine Statistics -------------------------------------------
[--] Status: +Archive -BDB +Federated +InnoDB -ISAM -NDBCluster
[--] Data in MyISAM tables: 256M (Tables: 6)
[--] Data in InnoDB tables: 1G (Tables: 2486)
[--] Data in PERFORMANCE_SCHEMA tables: 0B (Tables: 17)
[!!] Total fragmented tables: 248
-------- Security Recommendations -------------------------------------------
[OK] All database users have passwords assigned
-------- Performance Metrics -------------------------------------------------
[--] Up for: 9d 14h 23m 15s (65M q [78.732 qps], 1M conn, TX: 236B, RX: 10B)
[--] Reads / Writes: 87% / 13%
[--] Total buffers: 2.3G global + 20.4M per thread (30 max threads)
[OK] Maximum possible memory usage: 2.9G (36% of installed RAM)
[OK] Slow queries: 0% (214/65M)
[!!] Highest connection usage: 100% (31/30)
[OK] Key buffer size / total MyISAM indexes: 193.0M/260.7M
[OK] Key buffer hit rate: 98.1% (263M cached / 5M reads)
[OK] Query cache efficiency: 44.7% (43M cached / 97M selects)
[!!] Query cache prunes per day: 557523
[OK] Sorts requiring temporary tables: 3% (50K temp sorts / 1M sorts)
[!!] Joins performed without indexes: 52378
[!!] Temporary tables created on disk: 28% (467K on disk / 1M total)
[OK] Thread cache hit rate: 99% (32 created / 1M connections)
[!!] Table cache hit rate: 0% (128 open / 652K opened)
[OK] Open file limit used: 0% (3/196K)
[OK] Table locks acquired immediately: 99% (20M immediate / 20M locks)
[!!] InnoDB data size / buffer pool: 1.3G/1021.0M
-------- Recommendations -----------------------------------------------------
General recommendations:
Run OPTIMIZE TABLE to defragment tables for better performance
Enable the slow query log to troubleshoot bad queries
Reduce or eliminate persistent connections to reduce connection usage
Adjust your join queries to always utilize indexes
Temporary table size is already large - reduce result set size
Reduce your SELECT DISTINCT queries without LIMIT clauses
Increase table_cache gradually to avoid file descriptor limits
Variables to adjust:
max_connections (> 30)
wait_timeout (< 3600)
interactive_timeout (< 28800)
query_cache_size (> 128M)
join_buffer_size (> 4.0M, or always use indexes with joins)
table_cache (> 128)
innodb_buffer_pool_size (>= 1G)
And this is the output of bash /usr/local/bin/tuning-primer.sh:
-- MYSQL PERFORMANCE TUNING PRIMER --
- By: Matthew Montgomery -
MySQL Version 5.5.38-MariaDB-1~wheezy x86_64
Uptime = 9 days 14 hrs 25 min 11 sec
Avg. qps = 78
Total Questions = 65311186
Threads Connected = 2
Server has been running for over 48hrs.
It should be safe to follow these recommendations
To find out more information on how each of these
runtime variables effects performance visit:
http://dev.mysql.com/doc/refman/5.5/en/server-system-variables.html
Visit http://www.mysql.com/products/enterprise/advisors.html
for info about MySQL's Enterprise Monitoring and Advisory Service
SLOW QUERIES
The slow query log is NOT enabled.
Current long_query_time = 10.000000 sec.
You have 215 out of 65311244 that take longer than 10.000000 sec. to complete
Your long_query_time seems to be fine
BINARY UPDATE LOG
The binary update log is NOT enabled.
You will not be able to do point in time recovery
See http://dev.mysql.com/doc/refman/5.5/en/point-in-time-recovery.html
WORKER THREADS
Current thread_cache_size = 128
Current threads_cached = 30
Current threads_per_sec = 0
Historic threads_per_sec = 0
Your thread_cache_size is fine
MAX CONNECTIONS
Current max_connections = 30
Current threads_connected = 1
Historic max_used_connections = 31
The number of used connections is 103% of the configured maximum.
You should raise max_connections
INNODB STATUS
Current InnoDB index space = 623 M
Current InnoDB data space = 1.34 G
Current InnoDB buffer pool free = 0 %
Current innodb_buffer_pool_size = 1021 M
Depending on how much space your innodb indexes take up it may be safe
to increase this value to up to 2 / 3 of total system memory
MEMORY USAGE
Max Memory Ever Allocated : 1.93 G
Configured Max Per-thread Buffers : 611 M
Configured Max Global Buffers : 1.32 G
Configured Max Memory Limit : 1.91 G
Physical Memory : 7.98 G
Max memory limit seem to be within acceptable norms
KEY BUFFER
Current MyISAM index space = 260 M
Current key_buffer_size = 193 M
Key cache miss rate is 1 : 52
Key buffer free ratio = 81 %
Your key_buffer_size seems to be fine
QUERY CACHE
Query cache is enabled
Current query_cache_size = 128 M
Current query_cache_used = 74 M
Current query_cache_limit = 128 K
Current Query cache Memory fill ratio = 57.98 %
Current query_cache_min_res_unit = 4 K
MySQL won't cache query results that are larger than query_cache_limit in size
SORT OPERATIONS
Current sort_buffer_size = 128 K
Current read_rnd_buffer_size = 8 M
Sort buffer seems to be fine
JOINS
/usr/local/bin/tuning-primer.sh: line 402: export: `2097152': not a valid identifier
Current join_buffer_size = 4.00 M
You have had 52381 queries where a join could not use an index properly
join_buffer_size >= 4 M
This is not advised
You should enable "log-queries-not-using-indexes"
Then look for non indexed joins in the slow query log.
OPEN FILES LIMIT
Current open_files_limit = 196608 files
The open_files_limit should typically be set to at least 2x-3x
that of table_cache if you have heavy MyISAM usage.
Your open_files_limit value seems to be fine
TABLE CACHE
Current table_open_cache = 128 tables
Current table_definition_cache = 512 tables
You have a total of 2533 tables
You have 128 open tables.
Current table_cache hit rate is 0%
, while 100% of your table cache is in use
You should probably increase your table_cache
You should probably increase your table_definition_cache value.
TEMP TABLES
Current max_heap_table_size = 1021 M
Current tmp_table_size = 1021 M
Of 1196001 temp tables, 28% were created on disk
Perhaps you should increase your tmp_table_size and/or max_heap_table_size
to reduce the number of disk-based temporary tables
Note! BLOB and TEXT columns are not allow in memory tables.
If you are using these columns raising these values might not impact your
ratio of on disk temp tables.
TABLE SCANS
Current read_buffer_size = 8 M
Current table scan ratio = 44 : 1
read_buffer_size seems to be fine
TABLE LOCKING
Current Lock Wait ratio = 1 : 332528
Your table locking seems to be fine
MySQL has been restarted and we should soon see the results on the yearly slow queries graph:
I have included the Skype meeting time onn this comment.
comment:17 Changed 2 years ago by chris
- Add Hours to Ticket changed from 0.0 to 0.5
- Total Hours changed from 3.95 to 4.45
Since enabling the MySQL slow query log there haven't been enough slow queries to show up on the [https://penguin.transitionnetwork.org/munin/transitionnetwork.org/puffin.transitionnetwork.org/mysql_slowqueries.html munin graph], these are the numbers by day:
cat /var/log/mysql/sql-slow-query.log | grep Lock_time | wc -l 1 zcat /var/log/mysql/sql-slow-query.log.1.gz | grep Lock_time | wc -l 40 zcat /var/log/mysql/sql-slow-query.log.2.gz | grep Lock_time | wc -l 75 zcat /var/log/mysql/sql-slow-query.log.3.gz | grep Lock_time | wc -l 69 zcat /var/log/mysql/sql-slow-query.log.4.gz | grep Lock_time | wc -l 134 zcat /var/log/mysql/sql-slow-query.log.5.gz | grep Lock_time | wc -l 0
A lot of them are like this:
SET timestamp=1403219690;
UPDATE variable SET value = 's:6:\"a:0:{}\";' WHERE name = 'botcha_decorators';
# User@Host: transitionnetw_0[transitionnetw_0] @ localhost []
# Thread_id: 113577 Schema: transitionnetw_0 QC_hit: No
# Query_time: 13.704302 Lock_time: 0.000140 Rows_sent: 0 Rows_examined: 1
Also some are from the staging sites, eg:
use bookerstage201_0; SET timestamp=1403222827; SELECT /*!40001 SQL_NO_CACHE */ * FROM `node_revisions`; # Time: 140620 1:07:23 # User@Host: transitionnetw_0[transitionnetw_0] @ localhost [] # Thread_id: 120637 Schema: transitionnetw_0 QC_hit: No # Query_time: 7.555958 Lock_time: 0.000282 Rows_sent: 1 Rows_examined: 1
These are the latest times:
grep Query_time /var/log/mysql/sql-slow-query.log # Query_time: 5.347301 Lock_time: 0.000102 Rows_sent: 0 Rows_examined: 1 # Query_time: 13.971796 Lock_time: 0.000223 Rows_sent: 3 Rows_examined: 2515 zgrep Query_time /var/log/mysql/sql-slow-query.log.1.gz # Query_time: 5.340080 Lock_time: 0.000123 Rows_sent: 0 Rows_examined: 1 # Query_time: 8.207096 Lock_time: 0.000146 Rows_sent: 0 Rows_examined: 1 # Query_time: 8.036403 Lock_time: 0.000147 Rows_sent: 0 Rows_examined: 1 # Query_time: 7.714520 Lock_time: 0.000191 Rows_sent: 0 Rows_examined: 1 # Query_time: 5.792142 Lock_time: 0.000139 Rows_sent: 0 Rows_examined: 1 # Query_time: 5.791712 Lock_time: 0.000046 Rows_sent: 0 Rows_examined: 1 # Query_time: 5.791367 Lock_time: 0.000134 Rows_sent: 0 Rows_examined: 1 # Query_time: 84.773020 Lock_time: 0.000077 Rows_sent: 2458931 Rows_examined: 4917862 # Query_time: 5.547120 Lock_time: 0.000085 Rows_sent: 0 Rows_examined: 1 # Query_time: 5.361326 Lock_time: 0.000167 Rows_sent: 0 Rows_examined: 1 # Query_time: 5.539861 Lock_time: 0.000114 Rows_sent: 215 Rows_examined: 11665 # Query_time: 13.711887 Lock_time: 0.000131 Rows_sent: 1 Rows_examined: 1 # Query_time: 5.553294 Lock_time: 0.000127 Rows_sent: 0 Rows_examined: 1 # Query_time: 6.818864 Lock_time: 0.000255 Rows_sent: 0 Rows_examined: 1 # Query_time: 7.261640 Lock_time: 0.000066 Rows_sent: 0 Rows_examined: 0 # Query_time: 53.587872 Lock_time: 0.000059 Rows_sent: 2458931 Rows_examined: 4917862 # Query_time: 63.676596 Lock_time: 0.000068 Rows_sent: 2367663 Rows_examined: 4735326 # Query_time: 5.363653 Lock_time: 0.000177 Rows_sent: 1 Rows_examined: 1 # Query_time: 5.360807 Lock_time: 0.000067 Rows_sent: 1 Rows_examined: 1 # Query_time: 5.334692 Lock_time: 0.000094 Rows_sent: 9 Rows_examined: 81 # Query_time: 5.409849 Lock_time: 0.000146 Rows_sent: 1 Rows_examined: 1 # Query_time: 76.403322 Lock_time: 0.000069 Rows_sent: 2508070 Rows_examined: 5016140 # Query_time: 169.284098 Lock_time: 0.000061 Rows_sent: 4187 Rows_examined: 4187 # Query_time: 60.457437 Lock_time: 0.000420 Rows_sent: 2596 Rows_examined: 2596 # Query_time: 29.803496 Lock_time: 0.000053 Rows_sent: 0 Rows_examined: 0 # Query_time: 34.618996 Lock_time: 0.000077 Rows_sent: 9428 Rows_examined: 9428 # Query_time: 21.924879 Lock_time: 0.000087 Rows_sent: 2596 Rows_examined: 2596 # Query_time: 5.632205 Lock_time: 0.000051 Rows_sent: 0 Rows_examined: 1 # Query_time: 5.637614 Lock_time: 0.000142 Rows_sent: 0 Rows_examined: 1 # Query_time: 42.033651 Lock_time: 0.000056 Rows_sent: 2631 Rows_examined: 2631 # Query_time: 6.841041 Lock_time: 0.000076 Rows_sent: 64486 Rows_examined: 64486 # Query_time: 6.741912 Lock_time: 0.000058 Rows_sent: 65343 Rows_examined: 65343 # Query_time: 5.715529 Lock_time: 0.000000 Rows_sent: 1 Rows_examined: 1 # Query_time: 5.477044 Lock_time: 0.000000 Rows_sent: 26371 Rows_examined: 26371 # Query_time: 8.714131 Lock_time: 0.000000 Rows_sent: 1 Rows_examined: 1 # Query_time: 6.722540 Lock_time: 0.000000 Rows_sent: 25174 Rows_examined: 25174 # Query_time: 5.234226 Lock_time: 0.000000 Rows_sent: 29570 Rows_examined: 29570 # Query_time: 9.205237 Lock_time: 0.000000 Rows_sent: 25642 Rows_examined: 25642 # Query_time: 7.445021 Lock_time: 0.000000 Rows_sent: 1 Rows_examined: 1 # Query_time: 6.723906 Lock_time: 0.000281 Rows_sent: 0 Rows_examined: 0 zgrep Query_time /var/log/mysql/sql-slow-query.log.2.gz # Query_time: 5.124067 Lock_time: 0.000151 Rows_sent: 0 Rows_examined: 1 # Query_time: 5.232538 Lock_time: 0.000135 Rows_sent: 0 Rows_examined: 1 # Query_time: 9.282448 Lock_time: 0.000115 Rows_sent: 0 Rows_examined: 1 # Query_time: 5.446282 Lock_time: 0.000140 Rows_sent: 0 Rows_examined: 1 # Query_time: 6.263344 Lock_time: 0.000104 Rows_sent: 0 Rows_examined: 1 # Query_time: 6.248726 Lock_time: 0.000189 Rows_sent: 0 Rows_examined: 1 # Query_time: 5.096803 Lock_time: 0.000069 Rows_sent: 0 Rows_examined: 0 # Query_time: 5.061946 Lock_time: 0.000161 Rows_sent: 0 Rows_examined: 0 # Query_time: 5.099377 Lock_time: 0.000081 Rows_sent: 0 Rows_examined: 0 # Query_time: 81.144096 Lock_time: 0.000069 Rows_sent: 2458931 Rows_examined: 4917862 # Query_time: 5.047960 Lock_time: 0.000143 Rows_sent: 0 Rows_examined: 1 # Query_time: 10.604165 Lock_time: 0.000144 Rows_sent: 0 Rows_examined: 1 # Query_time: 10.094994 Lock_time: 0.000204 Rows_sent: 0 Rows_examined: 1 # Query_time: 6.853775 Lock_time: 0.000181 Rows_sent: 0 Rows_examined: 1 # Query_time: 5.128494 Lock_time: 0.000137 Rows_sent: 0 Rows_examined: 1 # Query_time: 5.997629 Lock_time: 0.000147 Rows_sent: 0 Rows_examined: 1 # Query_time: 68.924413 Lock_time: 0.000060 Rows_sent: 2458931 Rows_examined: 4917862 # Query_time: 5.550346 Lock_time: 0.000143 Rows_sent: 0 Rows_examined: 1 # Query_time: 10.617307 Lock_time: 0.000220 Rows_sent: 0 Rows_examined: 1 # Query_time: 10.474608 Lock_time: 0.000250 Rows_sent: 0 Rows_examined: 1 # Query_time: 6.344865 Lock_time: 0.000053 Rows_sent: 0 Rows_examined: 0 # Query_time: 6.636873 Lock_time: 0.000151 Rows_sent: 0 Rows_examined: 1 # Query_time: 6.346266 Lock_time: 0.000135 Rows_sent: 0 Rows_examined: 1 # Query_time: 68.248656 Lock_time: 0.000067 Rows_sent: 2367663 Rows_examined: 4735326 # Query_time: 7.400401 Lock_time: 0.000103 Rows_sent: 0 Rows_examined: 1 # Query_time: 5.557028 Lock_time: 0.000084 Rows_sent: 1 Rows_examined: 1 # Query_time: 6.005249 Lock_time: 0.000130 Rows_sent: 0 Rows_examined: 1 # Query_time: 5.321082 Lock_time: 0.000213 Rows_sent: 1 Rows_examined: 1 # Query_time: 11.652416 Lock_time: 0.000129 Rows_sent: 0 Rows_examined: 1 # Query_time: 5.823743 Lock_time: 0.000120 Rows_sent: 0 Rows_examined: 1 # Query_time: 5.760363 Lock_time: 0.000206 Rows_sent: 0 Rows_examined: 1 # Query_time: 5.103394 Lock_time: 0.000191 Rows_sent: 0 Rows_examined: 1 # Query_time: 5.562180 Lock_time: 0.000134 Rows_sent: 1 Rows_examined: 1 # Query_time: 5.504465 Lock_time: 0.000071 Rows_sent: 1 Rows_examined: 1 # Query_time: 5.753618 Lock_time: 0.000067 Rows_sent: 1 Rows_examined: 1 # Query_time: 5.731869 Lock_time: 0.000063 Rows_sent: 1 Rows_examined: 1 # Query_time: 5.511189 Lock_time: 0.000078 Rows_sent: 1 Rows_examined: 1 # Query_time: 7.365556 Lock_time: 0.000137 Rows_sent: 0 Rows_examined: 1 # Query_time: 5.059921 Lock_time: 0.000058 Rows_sent: 0 Rows_examined: 0 # Query_time: 5.974408 Lock_time: 0.000144 Rows_sent: 1 Rows_examined: 79 # Query_time: 5.690144 Lock_time: 0.000232 Rows_sent: 7 Rows_examined: 2353 # Query_time: 91.184648 Lock_time: 0.000058 Rows_sent: 2507751 Rows_examined: 5015502 # Query_time: 5.677278 Lock_time: 0.000103 Rows_sent: 0 Rows_examined: 0 # Query_time: 7.859067 Lock_time: 0.000092 Rows_sent: 0 Rows_examined: 1 # Query_time: 7.747772 Lock_time: 0.000057 Rows_sent: 0 Rows_examined: 1 # Query_time: 192.591082 Lock_time: 0.000057 Rows_sent: 4187 Rows_examined: 4187 # Query_time: 48.186547 Lock_time: 0.000524 Rows_sent: 2596 Rows_examined: 2596 # Query_time: 40.391301 Lock_time: 0.000050 Rows_sent: 0 Rows_examined: 0 # Query_time: 24.717881 Lock_time: 0.000056 Rows_sent: 9428 Rows_examined: 9428 # Query_time: 30.715568 Lock_time: 0.000100 Rows_sent: 2596 Rows_examined: 2596 # Query_time: 40.164445 Lock_time: 0.000055 Rows_sent: 2631 Rows_examined: 2631 # Query_time: 7.126643 Lock_time: 0.000095 Rows_sent: 64382 Rows_examined: 64382 # Query_time: 7.291848 Lock_time: 0.000068 Rows_sent: 65343 Rows_examined: 65343 # Query_time: 6.269467 Lock_time: 0.000000 Rows_sent: 26371 Rows_examined: 26371 # Query_time: 5.437779 Lock_time: 0.000000 Rows_sent: 2458931 Rows_examined: 2458931 # Query_time: 11.434477 Lock_time: 0.000000 Rows_sent: 25174 Rows_examined: 25174 # Query_time: 7.388560 Lock_time: 0.000000 Rows_sent: 2458931 Rows_examined: 2458931 # Query_time: 5.059390 Lock_time: 0.000098 Rows_sent: 2 Rows_examined: 2 # Query_time: 8.290819 Lock_time: 0.000000 Rows_sent: 25642 Rows_examined: 25642 # Query_time: 5.198229 Lock_time: 0.000482 Rows_sent: 3 Rows_examined: 60 # Query_time: 5.180890 Lock_time: 0.000200 Rows_sent: 1 Rows_examined: 1 # Query_time: 8.677522 Lock_time: 0.000227 Rows_sent: 0 Rows_examined: 1 # Query_time: 9.785133 Lock_time: 0.000085 Rows_sent: 0 Rows_examined: 1 # Query_time: 5.374070 Lock_time: 0.000101 Rows_sent: 4 Rows_examined: 36 # Query_time: 10.699709 Lock_time: 0.000000 Rows_sent: 1 Rows_examined: 1 # Query_time: 6.576029 Lock_time: 0.000063 Rows_sent: 0 Rows_examined: 0 # Query_time: 8.416717 Lock_time: 0.000000 Rows_sent: 1 Rows_examined: 1 # Query_time: 5.471348 Lock_time: 0.000000 Rows_sent: 1 Rows_examined: 1 # Query_time: 5.422277 Lock_time: 0.000294 Rows_sent: 0 Rows_examined: 1 # Query_time: 5.839928 Lock_time: 0.000107 Rows_sent: 1 Rows_examined: 1 # Query_time: 5.630443 Lock_time: 0.000301 Rows_sent: 1 Rows_examined: 1 # Query_time: 7.752931 Lock_time: 0.000070 Rows_sent: 0 Rows_examined: 0 # Query_time: 7.690895 Lock_time: 0.000049 Rows_sent: 0 Rows_examined: 0 # Query_time: 7.700004 Lock_time: 0.000052 Rows_sent: 0 Rows_examined: 0 # Query_time: 7.722363 Lock_time: 0.000054 Rows_sent: 0 Rows_examined: 0
I doesn't look to me that there are enough slow queries to warrant much further investigation, many appear to be spam related, but i think it is worth leaving the slow query log on so we can spot any dramatic increases in the slow queries. These are some of the latest really long ones:
SET timestamp=1403478583;
UPDATE variable SET value = 's:6:\"a:0:{}\";' WHERE name = 'botcha_decorators';
# Time: 140623 0:09:49
# User@Host: root[root] @ localhost []
# Thread_id: 620009 Schema: bookerstage201_0 QC_hit: No
# Query_time: 84.773020 Lock_time: 0.000077 Rows_sent: 2458931 Rows_examined: 4917862
SET timestamp=1403479073;
SELECT /*!40001 SQL_NO_CACHE */ * FROM `search_index` ORDER BY `word`,`sid`,`type`;
# Time: 140623 1:02:59
# User@Host: root[root] @ localhost []
# Thread_id: 625340 Schema: information_schema QC_hit: No
# Query_time: 169.284098 Lock_time: 0.000061 Rows_sent: 4187 Rows_examined: 4187
SET timestamp=1403392193;
INSERT INTO cache_form (serialized, created, expire, data, cid) VALUES (1, 1403392185, 1403413785, 'a:1:{s:12:\"#cache_token\";s:32:\"[DATAREMOVED]\";}', 'botcha_form-[DATAREMOVED]');
# Time: 140622 0:09:54
# User@Host: root[root] @ localhost []
# Thread_id: 469241 Schema: bookerstage201_0 QC_hit: No
# Query_time: 81.144096 Lock_time: 0.000069 Rows_sent: 2458931 Rows_examined: 4917862
Following is the result of perl /usr/local/bin/mysqltuner.pl:
>> MySQLTuner 1.2.0 - Major Hayden <major@mhtx.net>
>> Bug reports, feature requests, and downloads at http://mysqltuner.com/
>> Run with '--help' for additional options and output filtering
[OK] Logged in using credentials from debian maintenance account.
-------- General Statistics --------------------------------------------------
[--] Skipped version check for MySQLTuner script
[OK] Currently running supported MySQL version 5.5.38-MariaDB-1~wheezy-log
[OK] Operating on 64-bit architecture
-------- Storage Engine Statistics -------------------------------------------
[--] Status: +Archive -BDB +Federated +InnoDB -ISAM -NDBCluster
[--] Data in MyISAM tables: 256M (Tables: 6)
[--] Data in InnoDB tables: 1G (Tables: 2486)
[--] Data in PERFORMANCE_SCHEMA tables: 0B (Tables: 17)
[!!] Total fragmented tables: 247
-------- Security Recommendations -------------------------------------------
[OK] All database users have passwords assigned
-------- Performance Metrics -------------------------------------------------
[--] Up for: 4d 0h 12m 10s (28M q [83.120 qps], 691K conn, TX: 101B, RX: 4B)
[--] Reads / Writes: 88% / 12%
[--] Total buffers: 2.3G global + 20.4M per thread (30 max threads)
[OK] Maximum possible memory usage: 2.9G (36% of installed RAM)
[OK] Slow queries: 0% (319/28M)
[!!] Highest connection usage: 100% (31/30)
[OK] Key buffer size / total MyISAM indexes: 193.0M/261.1M
[OK] Key buffer hit rate: 98.1% (104M cached / 2M reads)
[OK] Query cache efficiency: 45.2% (19M cached / 43M selects)
[!!] Query cache prunes per day: 522862
[OK] Sorts requiring temporary tables: 4% (24K temp sorts / 598K sorts)
[!!] Joins performed without indexes: 22484
[!!] Temporary tables created on disk: 27% (190K on disk / 681K total)
[OK] Thread cache hit rate: 99% (31 created / 691K connections)
[!!] Table cache hit rate: 0% (128 open / 310K opened)
[OK] Open file limit used: 0% (4/196K)
[OK] Table locks acquired immediately: 99% (8M immediate / 8M locks)
[!!] InnoDB data size / buffer pool: 1.4G/1021.0M
-------- Recommendations -----------------------------------------------------
General recommendations:
Run OPTIMIZE TABLE to defragment tables for better performance
Reduce or eliminate persistent connections to reduce connection usage
Adjust your join queries to always utilize indexes
Temporary table size is already large - reduce result set size
Reduce your SELECT DISTINCT queries without LIMIT clauses
Increase table_cache gradually to avoid file descriptor limits
Variables to adjust:
max_connections (> 30)
wait_timeout (< 3600)
interactive_timeout (< 28800)
query_cache_size (> 128M)
join_buffer_size (> 4.0M, or always use indexes with joins)
table_cache (> 128)
innodb_buffer_pool_size (>= 1G)
I have changed these lines in /etc/mysql/my.cnf:
# chris #innodb_buffer_pool_size = 1021M innodb_buffer_pool_size = 1536M
As the InnoDB data size was smaller than the innodb_buffer_pool_size, and restarted MySQL.
And this:
# chris #max_connections = 30 #max_user_connections = 30 max_connections = 50 max_user_connections = 50
As the highest connection usage had hit 30.
MySQL has been restarted.
comment:18 Changed 11 months ago by chris
- Add Hours to Ticket changed from 0.0 to 0.1
- Total Hours changed from 4.45 to 4.55
Some recent MySQL config changes have been recorded on ticket:893#comment:1 and ticket:893#comment:4
comment:19 Changed 11 months ago by chris
- Cc paul, ade added; jim., ed removed
Cc list updated, jim and ed removed, paul and ade added.


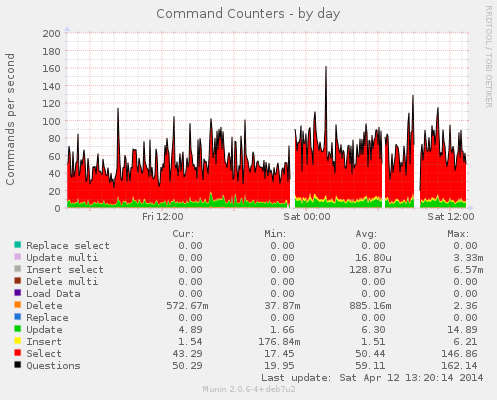
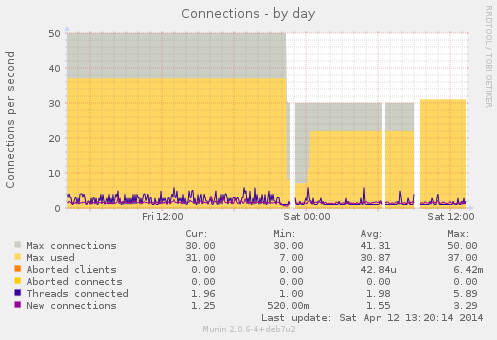
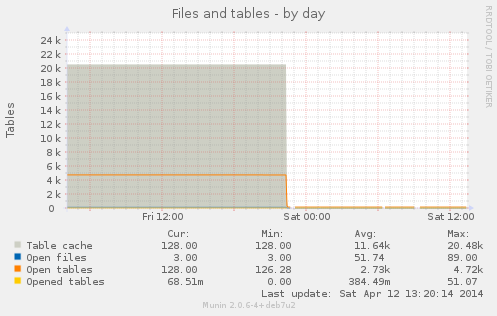
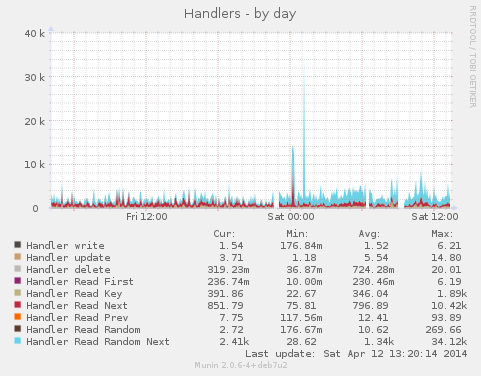

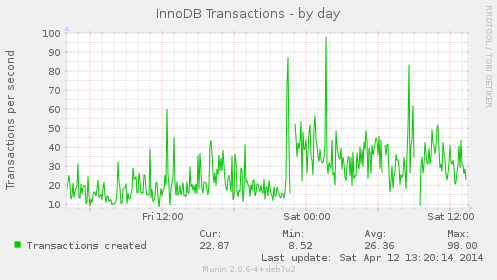
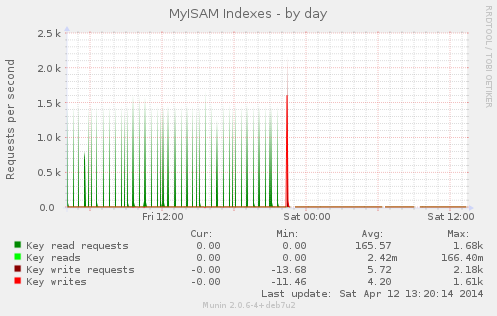
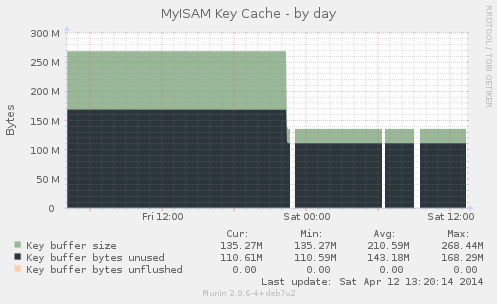
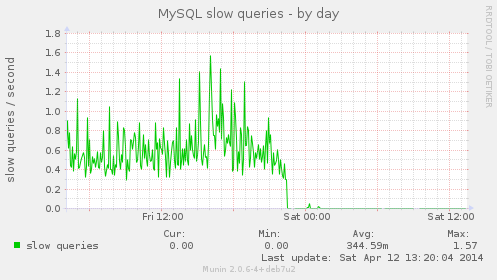
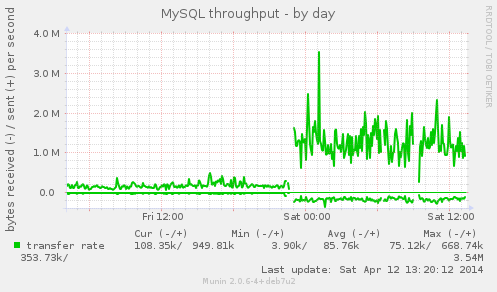

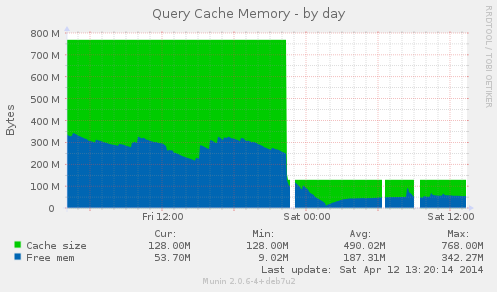
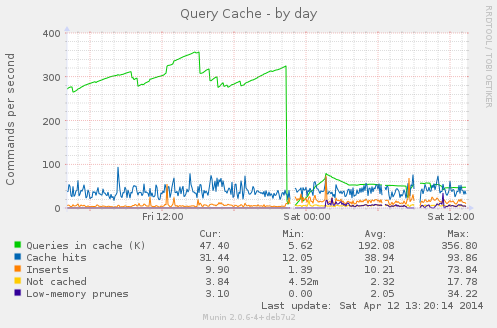

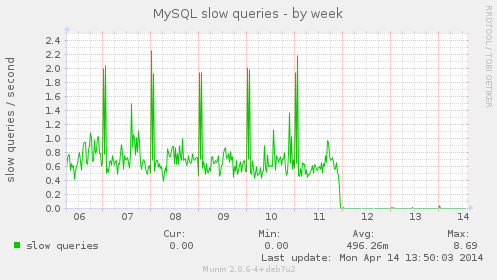
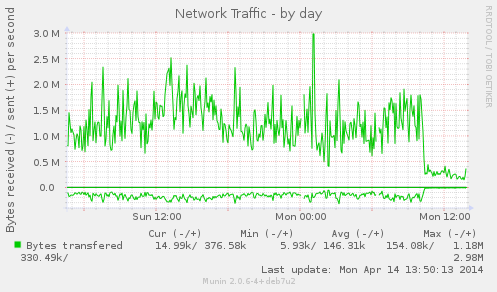
For reference this is the output of perl /usr/local/bin/mysqltuner.pl:
 >>  MySQLTuner 1.2.0 - Major Hayden <major@mhtx.net>
 >>  Bug reports, feature requests, and downloads at http://mysqltuner.com/
 >>  Run with '--help' for additional options and output filtering
[OK] Logged in using credentials from debian maintenance account.

-------- General Statistics --------------------------------------------------
[--] Skipped version check for MySQLTuner script
[OK] Currently running supported MySQL version 5.5.32-MariaDB-1~squeeze-log
[OK] Operating on 64-bit architecture

-------- Storage Engine Statistics -------------------------------------------
[--] Status: +Archive -BDB +Federated +InnoDB -ISAM -NDBCluster
[--] Data in MyISAM tables: 107M (Tables: 2)
[--] Data in InnoDB tables: 463M (Tables: 1039)
[--] Data in PERFORMANCE_SCHEMA tables: 0B (Tables: 17)
[!!] Total fragmented tables: 101

-------- Security Recommendations  -------------------------------------------
[OK] All database users have passwords assigned

-------- Performance Metrics -------------------------------------------------
[--] Up for: 1d 13h 23m 58s (9M q [70.391 qps], 254K conn, TX: 18B, RX: 1B)
[--] Reads / Writes: 82% / 18%
[--] Total buffers: 3.8G global + 140.8M per thread (75 max threads)
[!!] Maximum possible memory usage: 14.1G (176% of installed RAM)
[OK] Slow queries: 0% (66K/9M)
[OK] Highest usage of available connections: 53% (40/75)
[OK] Key buffer size / total MyISAM indexes: 256.0M/103.9M
[OK] Key buffer hit rate: 99.8% (16M cached / 25K reads)
[OK] Query cache efficiency: 82.9% (7M cached / 8M selects)
[OK] Query cache prunes per day: 0
[OK] Sorts requiring temporary tables: 1% (1K temp sorts / 160K sorts)
[!!] Joins performed without indexes: 5763
[OK] Temporary tables created on disk: 24% (56K on disk / 230K total)
[OK] Thread cache hit rate: 99% (40 created / 254K connections)
[OK] Table cache hit rate: 37% (2K open / 6K opened)
[OK] Open file limit used: 0% (80/196K)
[OK] Table locks acquired immediately: 99% (2M immediate / 2M locks)
[OK] InnoDB data size / buffer pool: 463.5M/1.0G

-------- Recommendations -----------------------------------------------------
General recommendations:
    Run OPTIMIZE TABLE to defragment tables for better performance
    Reduce your overall MySQL memory footprint for system stability
    Adjust your join queries to always utilize indexes
Variables to adjust:
  *** MySQL's maximum memory usage is dangerously high ***
  *** Add RAM before increasing MySQL buffer variables ***
    join_buffer_size (> 128.0M, or always use indexes with joins)
And this is the output of bash /usr/local/bin/tuning-primer.sh:
        -- MYSQL PERFORMANCE TUNING PRIMER --
             - By: Matthew Montgomery -

MySQL Version 5.5.32-MariaDB-1~squeeze-log x86_64

Uptime = 1 days 13 hrs 24 min 50 sec
Avg. qps = 70
Total Questions = 9496356
Threads Connected = 2

Warning: Server has not been running for at least 48hrs.
It may not be safe to use these recommendations

To find out more information on how each of these
runtime variables effects performance visit:
http://dev.mysql.com/doc/refman/5.5/en/server-system-variables.html
Visit http://www.mysql.com/products/enterprise/advisors.html
for info about MySQL's Enterprise Monitoring and Advisory Service

SLOW QUERIES
The slow query log is enabled.
Current long_query_time = 5.000000 sec.
You have 66751 out of 9496387 that take longer than 5.000000 sec. to complete
Your long_query_time seems to be fine

BINARY UPDATE LOG
The binary update log is NOT enabled.
You will not be able to do point in time recovery
See http://dev.mysql.com/doc/refman/5.5/en/point-in-time-recovery.html

WORKER THREADS
Current thread_cache_size = 128
Current threads_cached = 38
Current threads_per_sec = 0
Historic threads_per_sec = 0
Your thread_cache_size is fine

MAX CONNECTIONS
Current max_connections = 75
Current threads_connected = 2
Historic max_used_connections = 40
The number of used connections is 53% of the configured maximum.
Your max_connections variable seems to be fine.

INNODB STATUS
Current InnoDB index space = 181 M
Current InnoDB data space = 463 M
Current InnoDB buffer pool free = 41 %
Current innodb_buffer_pool_size = 1.00 G
Depending on how much space your innodb indexes take up it may be safe
to increase this value to up to 2 / 3 of total system memory

MEMORY USAGE
Max Memory Ever Allocated : 7.25 G
Configured Max Per-thread Buffers : 10.30 G
Configured Max Global Buffers : 1.76 G
Configured Max Memory Limit : 12.07 G
Physical Memory : 7.98 G

Max memory limit exceeds 90% of physical memory

KEY BUFFER
Current MyISAM index space = 103 M
Current key_buffer_size = 256 M
Key cache miss rate is 1 : 633
Key buffer free ratio = 71 %
Your key_buffer_size seems to be fine

QUERY CACHE
Query cache is enabled
Current query_cache_size = 512 M
Current query_cache_used = 130 M
Current query_cache_limit = 2 M
Current Query cache Memory fill ratio = 25.56 %
Current query_cache_min_res_unit = 1 K
Your query_cache_size seems to be too high.
Perhaps you can use these resources elsewhere
MySQL won't cache query results that are larger than query_cache_limit in size

SORT OPERATIONS
Current sort_buffer_size = 512 K
Current read_rnd_buffer_size = 4 M
Sort buffer seems to be fine

JOINS
/usr/local/bin/tuning-primer.sh: line 402: export: `2097152': not a valid identifier
Current join_buffer_size = 128.00 M
You have had 5765 queries where a join could not use an index properly
join_buffer_size >= 4 M
This is not advised
You should enable "log-queries-not-using-indexes"
Then look for non indexed joins in the slow query log.

OPEN FILES LIMIT
Current open_files_limit = 196608 files
The open_files_limit should typically be set to at least 2x-3x
that of table_cache if you have heavy MyISAM usage.
Your open_files_limit value seems to be fine

TABLE CACHE
Current table_open_cache = 8192 tables
Current table_definition_cache = 6144 tables
You have a total of 1082 tables
You have 2414 open tables.
The table_cache value seems to be fine

TEMP TABLES
Current max_heap_table_size = 4.00 G
Current tmp_table_size = 2.00 G
Of 174507 temp tables, 24% were created on disk
Created disk tmp tables ratio seems fine

TABLE SCANS
Current read_buffer_size = 8 M
Current table scan ratio = 86 : 1
read_buffer_size seems to be fine

TABLE LOCKING
Current Lock Wait ratio = 1 : 162724
Your table locking seems to be fine
And the Munin stats are here: https://penguin.transitionnetwork.org/munin/transitionnetwork.org/puffin.transitionnetwork.org/index.html#mysql