Ticket #900 (closed maintenance: fixed)
Unusal High Load on Puffin
| Reported by: | chris | Owned by: | chris |
|---|---|---|---|
| Priority: | major | Milestone: | Maintenance |
| Component: | Live server | Keywords: | |
| Cc: | ade, sam, paul | Estimated Number of Hours: | 0.0 |
| Add Hours to Ticket: | 0 | Billable?: | yes |
| Total Hours: | 1.85 |
Description (last modified by chris) (diff)
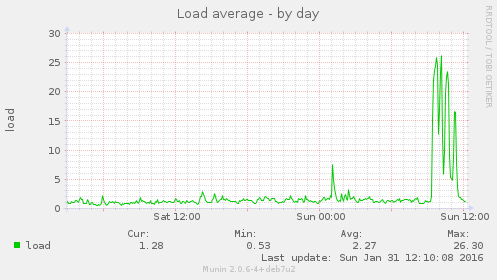
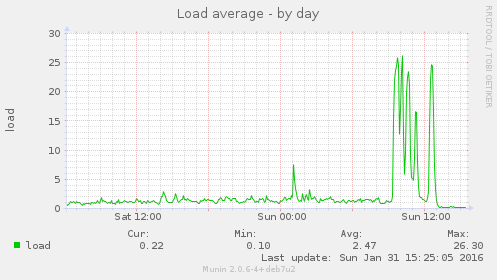
For the first time since the BOA cron jobs were commented out we have had some very high loads on PuffinServer, this is shown in the Munin graphs, I'll post some specific ones in comments to this ticket.
Attachments
Change History
comment:1 Changed 10 months ago by chris
- Add Hours to Ticket changed from 0.0 to 1.0
- Total Hours changed from 0.0 to 1.0
This is the first time since all BOA cron jobs were stopped on 23rd December 2015 that there have been pingdom alerts, these came in at these times:
Date: Sun, 31 Jan 2016 01:07:17 +0000
Date: Sun, 31 Jan 2016 02:27:18 +0000
Date: Sun, 31 Jan 2016 09:27:16 +0000
Date: Sun, 31 Jan 2016 10:02:18 +0000
Date: Sun, 31 Jan 2016 10:27:16 +0000
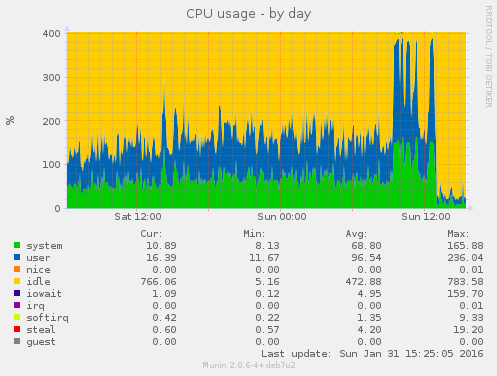
These are the lfd alert email subject lines from today, the highest load recorded was 26.72, given that the server now has 4 CPUs rather than 14, this is very high:
Sun 31-Jan-2016 lfd on puffin.webarch.net: High 5 minute load average alert - 13.42
Sun 31-Jan-2016 lfd on puffin.webarch.net: High 5 minute load average alert - 17.70
Sun 31-Jan-2016 lfd on puffin.webarch.net: High 5 minute load average alert - 19.28
Sun 31-Jan-2016 lfd on puffin.webarch.net: High 5 minute load average alert - 21.95
Sun 31-Jan-2016 lfd on puffin.webarch.net: High 5 minute load average alert - 24.36
Sun 31-Jan-2016 lfd on puffin.webarch.net: High 5 minute load average alert - 23.53
Sun 31-Jan-2016 lfd on puffin.webarch.net: High 5 minute load average alert - 22.77
Sun 31-Jan-2016 lfd on puffin.webarch.net: High 5 minute load average alert - 23.42
Sun 31-Jan-2016 lfd on puffin.webarch.net: High 5 minute load average alert - 24.68
Sun 31-Jan-2016 lfd on puffin.webarch.net: High 5 minute load average alert - 24.41
Sun 31-Jan-2016 lfd on puffin.webarch.net: High 5 minute load average alert - 26.31
Sun 31-Jan-2016 lfd on puffin.webarch.net: High 5 minute load average alert - 26.72
Sun 31-Jan-2016 lfd on puffin.webarch.net: High 5 minute load average alert - 25.97
Sun 31-Jan-2016 lfd on puffin.webarch.net: High 5 minute load average alert - 24.54
Sun 31-Jan-2016 lfd on puffin.webarch.net: High 5 minute load average alert - 18.26
Sun 31-Jan-2016 lfd on puffin.webarch.net: High 5 minute load average alert - 13.03
Sun 31-Jan-2016 lfd on puffin.webarch.net: High 5 minute load average alert - 12.66
Sun 31-Jan-2016 lfd on puffin.webarch.net: High 5 minute load average alert - 13.89
Sun 31-Jan-2016 lfd on puffin.webarch.net: High 5 minute load average alert - 17.55
Sun 31-Jan-2016 lfd on puffin.webarch.net: High 5 minute load average alert - 20.42
Sun 31-Jan-2016 lfd on puffin.webarch.net: High 5 minute load average alert - 21.77
Sun 31-Jan-2016 lfd on puffin.webarch.net: High 5 minute load average alert - 24.07
Sun 31-Jan-2016 lfd on puffin.webarch.net: High 5 minute load average alert - 20.81
Sun 31-Jan-2016 lfd on puffin.webarch.net: High 5 minute load average alert - 14.28
Sun 31-Jan-2016 lfd on puffin.webarch.net: High 5 minute load average alert - 12.62
Sun 31-Jan-2016 lfd on puffin.webarch.net: High 5 minute load average alert - 17.23
Sun 31-Jan-2016 lfd on puffin.webarch.net: High 5 minute load average alert - 19.72
Sun 31-Jan-2016 lfd on puffin.webarch.net: High 5 minute load average alert - 20.09
Sun 31-Jan-2016 lfd on puffin.webarch.net: High 5 minute load average alert - 21.58
Sun 31-Jan-2016 lfd on puffin.webarch.net: High 5 minute load average alert - 23.36
Sun 31-Jan-2016 lfd on puffin.webarch.net: High 5 minute load average alert - 23.46
Sun 31-Jan-2016 lfd on puffin.webarch.net: High 5 minute load average alert - 23.65
Sun 31-Jan-2016 lfd on puffin.webarch.net: High 5 minute load average alert - 23.19
Sun 31-Jan-2016 lfd on puffin.webarch.net: High 5 minute load average alert - 24.19
Sun 31-Jan-2016 lfd on puffin.webarch.net: High 5 minute load average alert - 17.47
Sun 31-Jan-2016 lfd on puffin.webarch.net: High 5 minute load average alert - 12.17
Sun 31-Jan-2016 lfd on puffin.webarch.net: High 5 minute load average alert - 12.26
Sun 31-Jan-2016 lfd on puffin.webarch.net: High 5 minute load average alert - 17.00
Sun 31-Jan-2016 lfd on puffin.webarch.net: High 5 minute load average alert - 13.37
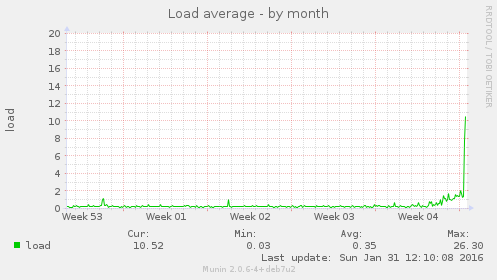
These graphs illustrate this:
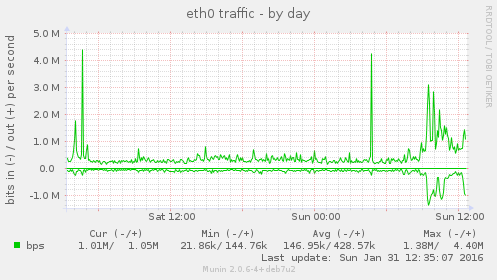
The increase in bandwidth:
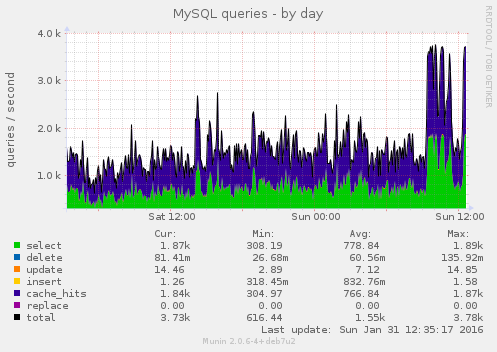
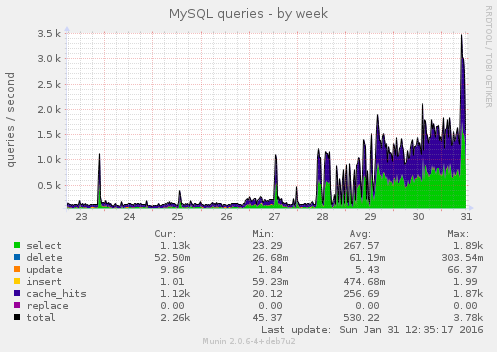
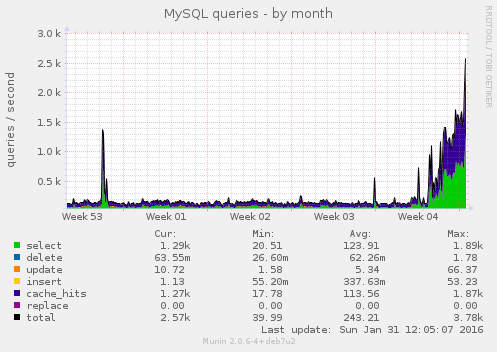
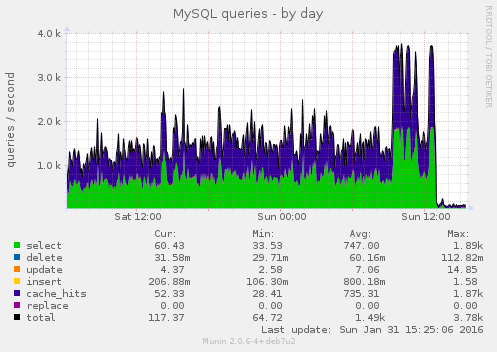
The MySQL graphs show this this issue started some days ago, it wasn't just a massive load spike today:
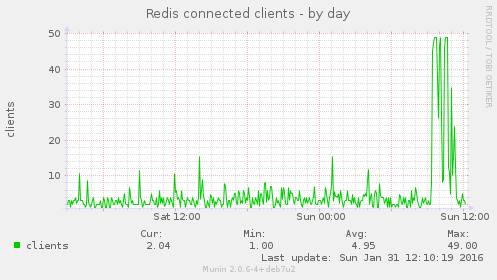
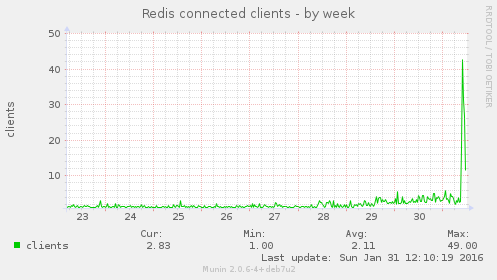
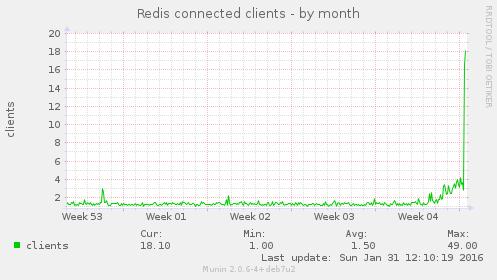
There was a corresponding huge increase in Redis usage:
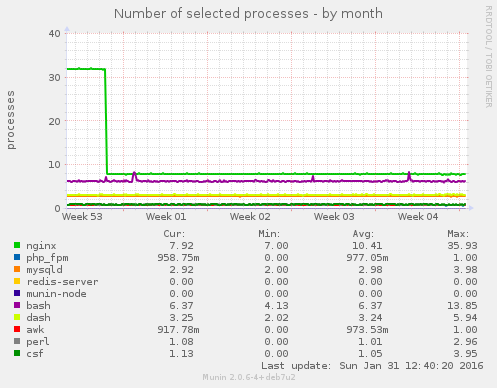
However there was no change in the number of key processes running:
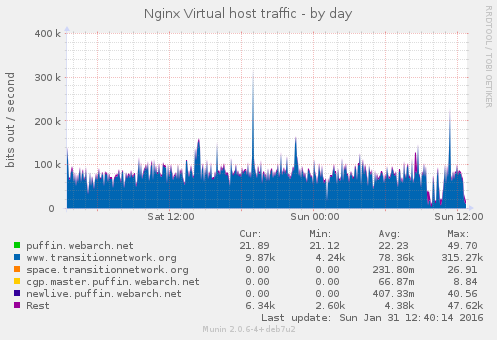
And there was actually a decrease in traffic to the site according to this graph:
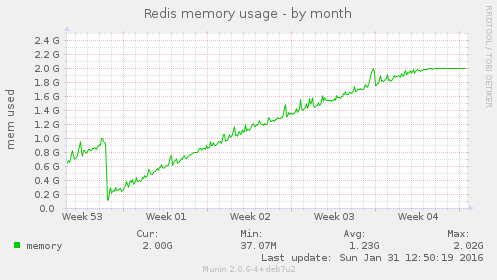
I have looked at various logs and can't find anything of note, the only thing I can think of is that as the Redis memory limit was reached (2G):
Perhaps this caused the increased MySQL load, I'm not convinced this is the answer, but to test it /etc/redis/redis.conf was edited and the memory allocation was updated:
#maxmemory 2048MB
maxmemory 3072MB
And Redis was restarted.
comment:2 Changed 10 months ago by chris
- Add Hours to Ticket changed from 0.0 to 0.35
- Total Hours changed from 1.0 to 1.35
Actually I think I might have found, at least part of, the cause, most the traffic today (80%) has been from Australia:
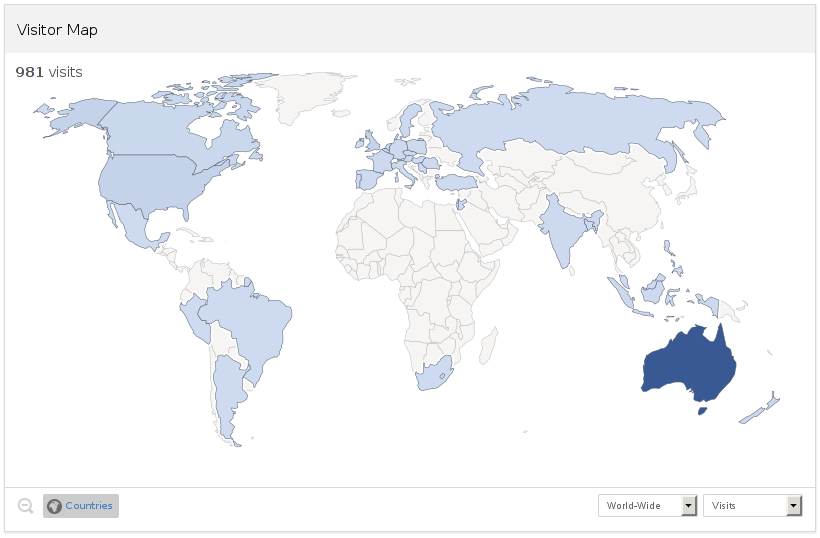
And although we can't see what people searched for these days due to HTTPS, POSTs and Referer headers not showing the pages people were on, some small percent of queries still allow an insight into the key words people searched for:
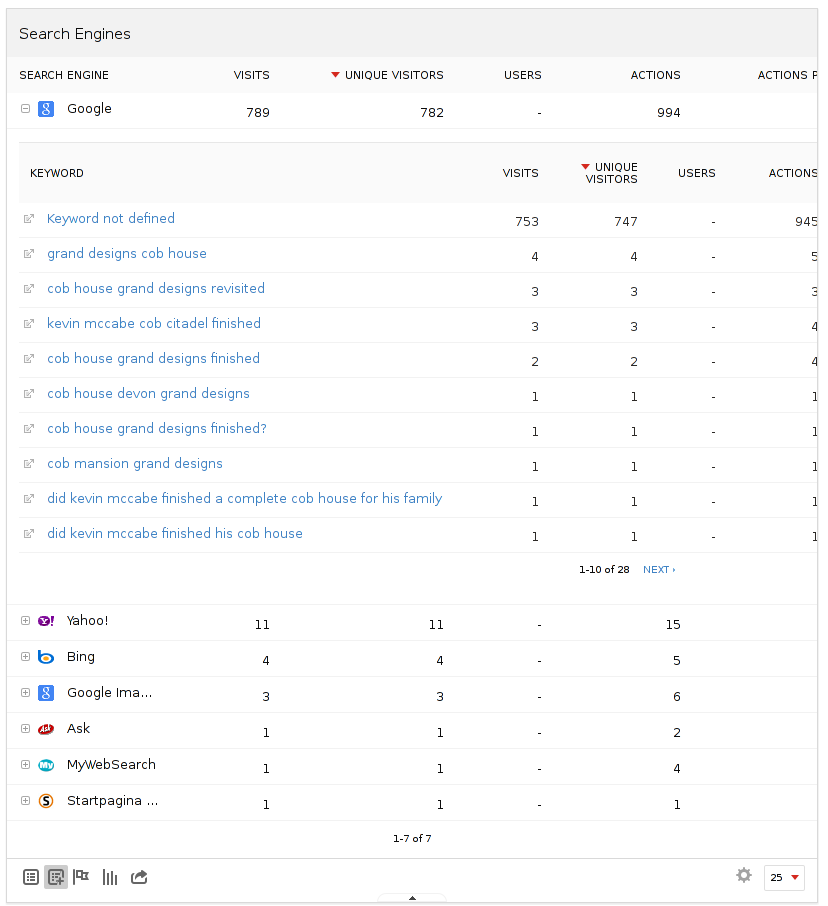
If you look at some of these searches, for example:
https://www.google.co.uk/search?q=grand+designs+cob+house
This page is the 4th result:
So my conclusion, so far, is that the Redis memory running out and Grand Designs being on Australian TV was probably the cause of this, grepping the Nginx access log:
grep "can-earth-building-scale-mainstream-2-kevin-mccabes-cob-citadel" /var/log/nginx/access.log | wc -l
7892
That log was rotated at Jan 31 06:25, so 8K hit's for Robin's 2014 article from down under seems to be the key cause.
comment:4 Changed 10 months ago by chris
- Add Hours to Ticket changed from 0.0 to 0.15
- Total Hours changed from 1.35 to 1.5
The Redis restart seems to have done the job, things are back to normal (with the ongoing Cob related traffic):
BOA used to restart Redis (as far as I recall) once a day, with the max memory usage set to 2GB it looks like we need to restart it monthly, see the Munin graphs and the flat line at peak, the server now has 3GB or it might be 6 weeks or so before it needs another restart.
comment:5 Changed 10 months ago by chris
- Add Hours to Ticket changed from 0.0 to 0.25
- Status changed from new to closed
- Resolution set to fixed
- Total Hours changed from 1.5 to 1.75
Everything still looks fine with the server, I have added this root cronjob to ensure that Redis doesn't use all it's RAM and cause problems again, restarting it monthly should do the trick:
# m h  dom mon dow   command
# /trac/ticket/900#comment:5
01 01 01 * * /etc/init.d/redis-server restart
Yesterdays traffic spike saw 65% of the traccif come from Australia and 1,176 unique page views for https://www.transitionnetwork.org/blogs/rob-hopkins/2014-01/can-earth-building-scale-mainstream-2-kevin-mccabes-cob-citadel
Closing this as resolved.
comment:6 Changed 10 months ago by chris
- Add Hours to Ticket changed from 0.0 to 0.1
- Total Hours changed from 1.75 to 1.85
Just got this from Pingdom:
Pingdom Monthly Report 2016-01-01 to 2016-01-31
------------------------------------------------

Overview:
------------------------------------------------
Uptime: 99.77%, Outages: 8, Response time: 458 ms

Checks with downtime:
------------------------------------------------
Check name: www.transitionnetwork.org, Uptime: 99.77%, Downtime: 1h 44m 00s, Outages: 8, Response time: 458 ms
All 8 incidents were related to the downtime caused by Redis running out of available and the Grand Designs load spike.