Ticket #483 (closed defect: fixed)
Nginx 502 Bad Gateway Errors with BOA
| Reported by: | chris | Owned by: | chris |
|---|---|---|---|
| Priority: | major | Milestone: | Maintenance |
| Component: | Live server | Keywords: | |
| Cc: | ed, jim | Estimated Number of Hours: | 0.0 |
| Add Hours to Ticket: | 0 | Billable?: | yes |
| Total Hours: | 16.35 |
Description
The Barracuda Octopus Aegir server on puffin.webarch.net is getting generating a lot of Nginx 502 Bad Gateway errors, see ticket:466#comment:31 and ticket:466#comment:38
The Nginx logs contain 58 502 errors:
cd /var/log/nginx
grep " 502 " * | wc -l
58
I expect the cause of these is Nginx asking PHP-FPM for a page and not getting one, an answer might be to either speed up PHP-FPM response time or adjust the Nginx settings so that it waits longs for a response from PHP-FPM.
There are several threads about this on http://groups.drupal.org/ but none of them have any useful suggestions (eg 1 2 3 4).
Attachments
Change History
comment:1 Changed 4 years ago by chris
- Add Hours to Ticket changed from 0.0 to 0.25
- Total Hours changed from 0.0 to 0.25
comment:2 follow-up: ↓ 3 Changed 4 years ago by jim
It's not a timeout, the 502s are instant.
It seems to begin, or at least centre around the 'Aborted connection' issue I mentioned. And once it starts happening, it keeps doing so. It appears to need a service mysql restart to fix it. Restarting nginx, php52-fpm or php53-fpm does nothing AFAIK.
That it's doing it this morning on http://newlive.puffin.webarch.net/ means the 'fresh start' given it by reinstalling PHP and updating BOA to HEAD did not work. Which, given the lack of issues on the Barracuda issue tracker, makes it most likely to be a configuration issue on Puffin.
In fact, since enabling SSL we have an issue whereby https://master.puffin.webarch.net/ redirects to 'install.php' with an '403 Forbidden'. So my current hunch is that the SSL work, or any changes done to any NGINX, PHP or MySQL config are the cause of the issue.
I propose we revert to stock settings and work from a clear base.
comment:3 in reply to: ↑ 2 Changed 4 years ago by chris
- Add Hours to Ticket changed from 0.0 to 0.4
- Total Hours changed from 0.25 to 0.65
Replying to jim:
It's not a timeout, the 502s are instant.
I'm not so sure, it appears to me that the problem is that Nginx doesn't get a page from PHP-FPM, this is what the status code means:
502 Bad Gateway
The server, while acting as a gateway or proxy, received an invalid response from the upstream server it accessed in attempting to fulfill the request.
http://www.w3.org/Protocols/rfc2616/rfc2616-sec10.html#sec10.5.3
It seems to begin, or at least centre around the 'Aborted connection' issue I mentioned.
Have you a reference to these?
And once it starts happening, it keeps doing so. It appears to need a service mysql restart to fix it. Restarting nginx, php52-fpm or php53-fpm does nothing AFAIK.
If it is related to the database then we should look at the Maria DB settings to try to increase response times.
That it's doing it this morning on http://newlive.puffin.webarch.net/ means the 'fresh start' given it by reinstalling PHP and updating BOA to HEAD did not work.
I wouldn't expect reinstalling BOA to change anything.
In fact, since enabling SSL we have an issue whereby https://master.puffin.webarch.net/ redirects to 'install.php' with an '403 Forbidden'. So my current hunch is that the SSL work, or any changes done to any NGINX, PHP or MySQL config are the cause of the issue.
The wrong SSL certificate is being served on that domain, it's using the self generated one rather than the Gandi.net one.
I propose we revert to stock settings and work from a clear base.
I don't see the need for that, isn't all that has changed from the "stock settings" is a couple of sym links, see ticket:466#comment:39 ?
comment:4 follow-up: ↓ 5 Changed 4 years ago by jim
It seems to begin, or at least centre around the 'Aborted connection' issue I mentioned.
Have you a reference to these?
If it is related to the database then we should look at the Maria DB settings to try to increase response times.
Except, according to syslog when I restart it, it's Percona, not MariaDB. I use MariaDB on my server, never tried Percona -- weren't we on MariaDB at one point, or did I imagine that? If not, we should change the setup to use MariaDB as the MySQL server instead to rule out bugs there. I've seen issues with Percona before.
I wouldn't expect reinstalling BOA to change anything.
Well I told it to reinstall PHP which is why I ran the installer, and it should run scripts that restart everything as part of that... Clean slate etc.
The wrong SSL certificate is being served on that domain, it's using the self generated
Because I gave it 'transitionnetwork.org' assuming we had a wildcard cert, not 'www...' When Aegir is fixed (by me disabling SSL support) we can try this again with the right settings.
---
FYI last night installed tcpdump and started to do the debugging process at http://www.mysqlperformanceblog.com/2008/08/23/how-to-track-down-the-source-of-aborted_connects/, but ran out of time/energy. We need to establish if it's PHP or MySQL doing this, and main hurdle here is the lack of good log information
According to Omega8cc (and paraphrasing since I don't have the link to hand): "502 errors are caused by PHP or MySQL segfaulting or dropping off partway though a response. Barracuda works out of the box with no problems, so if you're seeing these its not BOA or NGINX, and you might need to reinstall". or words to that effect!
Finally, I think this might come down to a simple connectivity issue between the database, 'localhost' and the IP address -- perhaps something is being blocked or does not have permission via one or another connection route? But, then why would it be fine for ages, then plagued by the issue... Does that sound possible?
Rambling aside..
My proposed debug/plan to fix, in order of pain level with nuclear option last:
- Debug issue -- not sure how best to do this?
- Revert SSL: Jim to disable Aegir SSL support (via SSH/Drush since we're being redirected to 'install.php'. Test newlive and master.
- Reinstall stuff: Run installer with _SQL_FORCE_REINSTALL=YES and _NGX_FORCE_REINSTALL=YES; Test newlive and master sites.
- Change DB: Replace Percona with MariaDB in .barracuda.cnf, set _FULL_FORCE_REINSTALL=YES; run reinstall; Test newlive and master.1. Chris to roll back all SSL changes, and any other NGINX/PHP/MYSQL changes done (if there are some); Test newlive and master.
- NUCLEAR: Wipe Puffin, re-run setup with NO non-essential changes to .barracuda.cnf whatsoever (i.e. email only), get TN site imported/Aegir running; THEN set up SSL and backups and leave well alone.
What do you think, Chris, got anything you want to add to that list.
Despite 'nuclear' being bad', there's nothing we need on the server provided the Quince->Puffin script is backed up (put in GitHub?), all my work has been to prep/document/setup Github and I need to do one last run through anyway.
Even if we completely reinstalled, that should only take an hour or so, and most of that is waiting for it to finish. So that's the backup and should be weighed against spending too long trying to fix an otherwise empty server.
Chris?
comment:5 in reply to: ↑ 4 Changed 4 years ago by chris
- Add Hours to Ticket changed from 0.0 to 0.5
- Total Hours changed from 0.65 to 1.15
Replying to jim:
It seems to begin, or at least centre around the 'Aborted connection' issue I mentioned.
Have you a reference to these?
There are quite a lot of these:
grep "Aborted" /var/log/daemon* | wc -l
91
If it is related to the database then we should look at the Maria DB settings to try to increase response times.
Except, according to syslog when I restart it, it's Percona, not MariaDB.
It's MariaDB:
which mysqld
  /usr/sbin/mysqld
dpkg -S /usr/sbin/mysqld
  mariadb-server-core-5.5: /usr/sbin/mysqld
I'm not sure to what, if any, extent BOA has modified the config files in /etc/mysql/ but we could look at tweaking settings there to improve performance.
I use MariaDB on my server, never tried Percona -- weren't we on MariaDB at one point, or did I imagine that? If not, we should change the setup to use MariaDB as the MySQL server instead to rule out bugs there. I've seen issues with Percona before.
I don't know where you got that idea from, the BOA uses MariaDB.
Finally, I think this might come down to a simple connectivity issue between the database, 'localhost' and the IP address -- perhaps something is being blocked or does not have permission via one or another connection route? But, then why would it be fine for ages, then plagued by the issue... Does that sound possible?
Not really, where is the file with the database settings for the site?
My proposed debug/plan to fix, in order of pain level with nuclear option last:
- Debug issue -- not sure how best to do this?
I'd suggest adjusing PHP-FPM and MariaDB settings.
- Revert SSL: Jim to disable Aegir SSL support (via SSH/Drush since we're being redirected to 'install.php'. Test newlive and master.
- Reinstall stuff: Run installer with _SQL_FORCE_REINSTALL=YES and _NGX_FORCE_REINSTALL=YES; Test newlive and master sites.
- Change DB: Replace Percona with MariaDB in .barracuda.cnf, set _FULL_FORCE_REINSTALL=YES; run reinstall; Test newlive and master.1. Chris to roll back all SSL changes, and any other NGINX/PHP/MYSQL changes done (if there are some); Test newlive and master.
- NUCLEAR: Wipe Puffin, re-run setup with NO non-essential changes to .barracuda.cnf whatsoever (i.e. email only), get TN site imported/Aegir running; THEN set up SSL and backups and leave well alone.
What do you think, Chris, got anything you want to add to that list.
I'm not convinced that any of these will help, I think we need to look at the PHP-FPM and MariaDB settings, and perhaps the Nginx settings as well.
Despite 'nuclear' being bad', there's nothing we need on the server provided the Quince->Puffin script is backed up (put in GitHub), all my work has been to prep/document/setup Github and I need to do one last run through anyway.
Even if we completely reinstalled, that should only take an hour or so, and most of that is waiting for it to finish. So that's the backup and should be weighed against spending too long trying to fix an otherwise empty server.
I expect it would take a bit longer and all it would result in would be you being assured that the problems are not as a result of anything we have done, but perhaps this is a good enough reason to do it.
comment:6 follow-up: ↓ 8 Changed 4 years ago by jim
- MariaDB: Ok, great! It said 'Percona' a bunch of times in syslog when I restarted MySQL.
- Settings: These should just work, that's the point of using BOA, and why I'm confused... That we have to change them implies the original install wasn't quite right, which is why I thought a reinstall might correct things. Happy to stay with what we have for now if you've happy you're not changed much.
I wonder if it's caused by the daily tasks for looking after sites? In that it was fine, then the issue came back the next day... Perhaps something in the new TN.org site is making it flaky somehow. Hmm...
I'll investigate along these lines and later raise an issue on the Barracuda issues list to get some support from the horse's mouth.
comment:7 Changed 4 years ago by chris
- Add Hours to Ticket changed from 0.0 to 0.45
- Total Hours changed from 1.15 to 1.6
Looking at the PHP settings, the key files are the ones in /etc/php5/fpm/ where there is php-fpm.conf which doesn't contain much apart from an include:
cat /etc/php5/fpm/php-fpm.conf | grep -v '^;' | grep -v "^[[:space:]]*$"

[global]
pid = /var/run/php5-fpm.pid
error_log = /var/log/php5-fpm.log
include=/etc/php5/fpm/pool.d/*.conf
The file included is /etc/php5/fpm/pool.d/www.conf, which contains:
cat www.conf | grep -v '^;' | grep -v "^[[:space:]]*$"

[www]
user = www-data
group = www-data
listen = 127.0.0.1:9000
pm = dynamic
pm.max_children = 5
pm.start_servers = 2
pm.min_spare_servers = 1
pm.max_spare_servers = 3
chdir = /
There is also a symlink at /etc/php5/fpm/php.ini to /opt/local/etc/php53.ini which contains:
cat /opt/local/etc/php53.ini | grep -v '^;' | grep -v "^[[:space:]]*$"

[PHP]
display_errors = Off
user_ini.filename =
engine = On
short_open_tag = On
asp_tags = Off
precision = 14
y2k_compliance = On
output_buffering = 4096
zlib.output_compression = Off
implicit_flush = Off
unserialize_callback_func =
serialize_precision = 100
allow_call_time_pass_reference = Off
safe_mode = Off
safe_mode_gid = Off
safe_mode_include_dir =
safe_mode_exec_dir =
safe_mode_allowed_env_vars = PHP_
safe_mode_protected_env_vars = LD_LIBRARY_PATH
open_basedir = ".:/data:/mnt:/opt:/srv:/tmp:/usr:/var/aegir:/var/lib/collectd:/var/lib/nginx:/var/run:/var/second:/var/www"
disable_functions = "allow_url_fopen,allow_url_include,link,passthru,posix_getpwnam,posix_getpwuid,posix_getrlimit,posix_uname,proc_nice,symlink"
disable_classes =
realpath_cache_size=8M
realpath_cache_ttl=180
zend.enable_gc = On
expose_php = On
max_execution_time = 300
max_input_time = 300
max_input_vars = 9999
memory_limit = 256M
error_reporting = E_ALL & ~E_DEPRECATED
display_errors = Off
display_startup_errors = Off
log_errors = On
log_errors_max_len = 1024
ignore_repeated_errors = Off
ignore_repeated_source = Off
report_memleaks = On
track_errors = Off
html_errors = Off
error_log = /var/log/php/error_log_53
variables_order = "GPCS"
request_order = "GP"
register_globals = Off
register_long_arrays = Off
register_argc_argv = Off
auto_globals_jit = On
post_max_size = 100M
magic_quotes_gpc = Off
magic_quotes_runtime = Off
magic_quotes_sybase = Off
auto_prepend_file =
auto_append_file =
default_mimetype = "text/html"
include_path    =  ".:/opt/local/lib/php:/usr/lib/php5"
doc_root =
user_dir =
extension_dir = "/opt/local/lib/php/extensions/no-debug-non-zts-20090626/"
enable_dl = Off
file_uploads = On
upload_tmp_dir = /tmp
upload_max_filesize = 100M
max_file_uploads = 50
allow_url_fopen = On
allow_url_include = Off
default_socket_timeout = 60

[Date]
date.timezone = "UTC"

[filter]

[iconv]

[intl]

[sqlite]

[sqlite3]

[Pcre]

[Pdo]

[Pdo_mysql]
pdo_mysql.cache_size = 2000
pdo_mysql.default_socket=

[Phar]

[Syslog]
define_syslog_variables  = Off

[mail function]
sendmail_path = /usr/sbin/sendmail -t -i
mail.add_x_header = Off

[SQL]
sql.safe_mode = Off

[ODBC]
odbc.allow_persistent = On
odbc.check_persistent = On
odbc.max_persistent = -1
odbc.max_links = -1
odbc.defaultlrl = 4096
odbc.defaultbinmode = 1

[Interbase]
ibase.allow_persistent = 1
ibase.max_persistent = -1
ibase.max_links = -1
ibase.timestampformat = "%Y-%m-%d %H:%M:%S"
ibase.dateformat = "%Y-%m-%d"
ibase.timeformat = "%H:%M:%S"

[MySQL]
mysql.allow_local_infile = On
mysql.allow_persistent = On
mysql.cache_size = 2000
mysql.max_persistent = -1
mysql.max_links = -1
mysql.default_port =
mysql.default_socket =
mysql.default_host =
mysql.default_user =
mysql.default_password =
mysql.connect_timeout = 60
mysql.trace_mode = Off

[MySQLi]
mysqli.max_persistent = -1
mysqli.allow_persistent = On
mysqli.max_links = -1
mysqli.cache_size = 2000
mysqli.default_port = 3306
mysqli.default_socket =
mysqli.default_host =
mysqli.default_user =
mysqli.default_pw =
mysqli.reconnect = Off

[mysqlnd]
mysqlnd.collect_statistics = On
mysqlnd.collect_memory_statistics = Off

[OCI8]

[PostgreSQL]
pgsql.allow_persistent = On
pgsql.auto_reset_persistent = Off
pgsql.max_persistent = -1
pgsql.max_links = -1
pgsql.ignore_notice = 0
pgsql.log_notice = 0

[Sybase-CT]
sybct.allow_persistent = On
sybct.max_persistent = -1
sybct.max_links = -1
sybct.min_server_severity = 10
sybct.min_client_severity = 10

[bcmath]
bcmath.scale = 0

[browscap]

[Session]
session.save_handler = files
session.save_path = "/opt/tmp"
session.use_cookies = 1
session.use_only_cookies = 1
session.name = PHPSESSID
session.auto_start = 0
session.cookie_lifetime = 0
session.cookie_path = /
session.cookie_domain =
session.cookie_httponly = 1
session.serialize_handler = php
session.gc_probability = 1
session.gc_divisor = 1000
session.gc_maxlifetime = 1440
session.bug_compat_42 = Off
session.bug_compat_warn = Off
session.referer_check =
session.entropy_length = 32
session.entropy_file = /dev/urandom
session.cache_limiter = nocache
session.cache_expire = 180
session.use_trans_sid = 0
session.hash_function = 0
session.hash_bits_per_character = 5
url_rewriter.tags = "a=href,area=href,frame=src,input=src,form=fakeentry"

[MSSQL]
mssql.allow_persistent = On
mssql.max_persistent = -1
mssql.max_links = -1
mssql.min_error_severity = 10
mssql.min_message_severity = 10
mssql.compatability_mode = Off
mssql.secure_connection = Off

[Assertion]

[COM]

[mbstring]

[gd]

[exif]

[Tidy]
tidy.clean_output = Off

[soap]
soap.wsdl_cache_enabled=1
soap.wsdl_cache_dir="/tmp"
soap.wsdl_cache_ttl=86400
soap.wsdl_cache_limit = 5

[sysvshm]

[ldap]
ldap.max_links = -1

[mcrypt]

[dba]

[xsl]

[Zend]
zend_extension="/usr/local/ioncube/ioncube_loader_lin_5.3.so"
auto_globals_jit = Off
extension=apc.so
apc.shm_size = 512M
apc.stat = 1
apc.stat_ctime = 1
apc.include_once_override = 0
cgi.fix_pathinfo = 1
mbstring.http_input = "pass"
mbstring.http_output = "pass"
mbstring.encoding_translation = 0
extension=uploadprogress.so
extension=imagick.so
extension=jsmin.so
extension=redis.so
I'd suggest starting by increasing the number of servers in /etc/php5/fpm/pool.d/www.conf, I haven't yet gone through the long list of settings above in detail.
For MariaDB AKA MySQL the main configuration file is /etc/mysql/my.cnf}:
cat my.cnf | grep -v '^#' | grep -v "^[[:space:]]*$"

[client]
port                    = 3306
socket                  = /var/run/mysqld/mysqld.sock
default-character-set   = utf8

[mysqld]
user                    = mysql
pid-file                = /var/run/mysqld/mysqld.pid
socket                  = /var/run/mysqld/mysqld.sock
port                    = 3306
basedir                 = /usr
datadir                 = /var/lib/mysql
tmpdir                  = /tmp
lc_messages_dir         = /usr/share/mysql
lc_messages             = en_US
character_set_server    = utf8
collation_server        = utf8_general_ci
skip-external-locking
skip-name-resolve
connect_timeout         = 60
join_buffer_size        = 1M
key_buffer              = 1M
key_buffer_size         = 32M
log_warnings            = 2
max_allowed_packet      = 32M
max_connect_errors      = 30
max_connections         = 30
max_user_connections    = 30
myisam_sort_buffer_size = 1024K
query_cache_limit       = 128K
query_cache_size        = 64M
query_cache_type        = 1
read_buffer_size        = 8M
read_rnd_buffer_size    = 4M
sort_buffer_size        = 128K
bulk_insert_buffer_size = 128K
table_open_cache        = 64
table_definition_cache  = 512
table_cache             = 128
thread_stack            = 256K
thread_cache_size       = 128
thread_concurrency      = 8
wait_timeout            = 3600
tmp_table_size          = 64M
max_heap_table_size     = 128M
low_priority_updates    = 1
concurrent_insert       = 2
max_tmp_tables          = 16384
server-id               = 8
myisam-recover          = BACKUP
log_bin                 = /var/log/mysql/mariadb-bin
log_bin_index           = /var/log/mysql/mariadb-bin.index
expire_logs_days        = 1
max_binlog_size         = 100M
open_files_limit        = 196608
default_storage_engine  = InnoDB
sql_mode                = NO_ENGINE_SUBSTITUTION
innodb_buffer_pool_size = 1019M
innodb_log_buffer_size  = 4M
innodb_file_per_table   = 1
innodb_open_files       = 256
innodb_io_capacity      = 512
innodb_flush_method     = O_DIRECT
innodb_flush_log_at_trx_commit = 2
innodb_thread_concurrency = 8
innodb_lock_wait_timeout = 120

[mysqld_safe]
socket                  = /var/run/mysqld/mysqld.sock
nice                    = 0
open_files_limit        = 196608
syslog

[mysqldump]
quick
max_allowed_packet      = 32M
quote-names

[mysql]
no-auto-rehash

[myisamchk]
key_buffer              = 1M
sort_buffer_size        = 64K
read_buffer             = 4M
write_buffer            = 4M

[isamchk]
key_buffer              = 1M
sort_buffer_size        = 64K
read_buffer             = 4M
write_buffer            = 4M

[mysqlhotcopy]
interactive-timeout
!includedir /etc/mysql/conf.d/
For the MySQL settings I think we should compare them with the ones on quince to start with.
comment:8 in reply to: ↑ 6 Changed 4 years ago by chris
- Add Hours to Ticket changed from 0.0 to 0.15
- Total Hours changed from 1.6 to 1.75
Replying to jim:
- Settings: These should just work, that's the point of using BOA, and why I'm confused... That we have to change them implies the original install wasn't quite right
Or that the settings are not quite right...
We are on the 3rd fresh install already, the first one was ticket:466#comment:2 the second was ticket:466#comment:9 and the third was ticket:466#comment:22
comment:9 Changed 4 years ago by chris
- Add Hours to Ticket changed from 0.0 to 0.75
- Total Hours changed from 1.75 to 2.5
I started looking at increasing the number of php-fpm processes, in /etc/php5/fpm/pool.d/www.conf and these values have been increased:
;pm.max_children = 5
pm.max_children = 10

;pm.start_servers = 2
pm.start_servers = 4

;pm.min_spare_servers = 1
pm.min_spare_servers = 2
However this didn't change the number of php-fpm processes running -- it's still 3 and the reason for this is that this config file doesn't appear to be used after all, there are two php-fpm init scripts, /etc/init.d/php5-fpm and /etc/init.d/php53-fpm and the second one uses /opt/local/etc/php53-fpm.conf which contains:
cat /opt/local/etc/php53-fpm.conf | grep -v '^;' | grep -v "^[[:space:]]*$"

[global]
pid = /var/run/php53-fpm.pid
error_log = /var/log/php/php53-fpm-error.log
syslog.facility = daemon
syslog.ident = php-fpm
log_level = notice
emergency_restart_threshold = 5
emergency_restart_interval = 1m
process_control_timeout = 0s
process.max = 8
daemonize = yes
rlimit_files = 1024
rlimit_core = 0
events.mechanism = epoll

[www]
user = www-data
group = www-data
listen = 127.0.0.1:9090
listen.allowed_clients = 127.0.0.1,81.95.52.103
pm = dynamic
pm.max_children = 4
pm.start_servers = 2
pm.min_spare_servers = 1
pm.max_spare_servers = 2
pm.process_idle_timeout = 10s;
pm.max_requests = 500
slowlog = /var/log/php/php53-fpm-slow.log
request_slowlog_timeout = 30s
request_terminate_timeout = 300s
rlimit_files = 1024
rlimit_core = 0
env[HOSTNAME] = $HOSTNAME
env[PATH] = /usr/local/bin:/usr/bin:/bin
env[TMP] = /tmp
env[TMPDIR] = /tmp
env[TEMP] = /tmp
I'm not clear which config files BOA might overwrite and which ones are safe to edit.
comment:10 follow-up: ↓ 11 Changed 4 years ago by jim
Chris, I don't think we should be changing settings if they look 'ok'. The point being BOA runs on hundreds (probably thousands) of servers, and does so with out of the box settings.
That we're hitting a big problem implies one of:
- There is a bug in the current version of BOA that we installed on the server. If so, we should raise an appropriate ticket at http://drupal.org/project/issues/barracuda -- I just don't know what information to give at present since we've not seen an error that describes the fail, or points us to a specific component. As soon as we have proof it's a bug, I'll post something.
- There was a misconfiguration or other issue when it was installed, or afterwards. Chris seems pretty happy there wasn't anything done besides a few tweaks to the .barracuda.cnf, and SSL setup. However it's strange that bash autocompletes don't work proprely so perhaps the original OS or other installs went awry. Back burner for now...
- Something is odd with our TN site. I'm going to try the import process and makefile out on my server next, and if that breaks I'll let you know!
comment:11 in reply to: ↑ 10 Changed 4 years ago by chris
- Add Hours to Ticket changed from 0.0 to 0.2
- Total Hours changed from 2.5 to 2.7
Replying to jim:
I don't think we should be changing settings if they look 'ok'. The point being BOA runs on hundreds (probably thousands) of servers, and does so with out of the box settings.
OK let's look at how to duplicate the problem .
That we're hitting a big problem implies one of:
- There is a bug in the current version of BOA that we installed on the server. If so, we should raise an appropriate ticket at http://drupal.org/project/issues/barracuda -- I just don't know what information to give at present since we've not seen an error that describes the fail, or points us to a specific component. As soon as we have proof it's a bug, I'll post something.
OK.
- There was a misconfiguration or other issue when it was installed, or afterwards. Chris seems pretty happy there wasn't anything done besides a few tweaks to the .barracuda.cnf, and SSL setup. However it's strange that bash autocompletes don't work proprely so perhaps the original OS or other installs went awry. Back burner for now...
Does Ubuntu have a different bash auto completion setup by default and you are used to that? This isn't something that has any settings other than the default debian ones AFAIK.
comment:12 follow-up: ↓ 13 Changed 4 years ago by jim
Good plan re duplication... SSL issue (ticket:478#comment:12) to fix first then I'll start on narrowing it down.
Are we running Ubuntu? I thought this was Debian? My server is Debian Squeeze too.
IF we're Ubuntu, this APC issue could be a problem: http://drupal.org/node/1643616
comment:13 in reply to: ↑ 12 Changed 4 years ago by chris
comment:14 Changed 4 years ago by chris
- Add Hours to Ticket changed from 0.0 to 0.1
- Total Hours changed from 2.7 to 2.8
I have installed the bash-completion package in puffin.
comment:15 Changed 4 years ago by chris
- Add Hours to Ticket changed from 0.0 to 1.0
- Total Hours changed from 2.8 to 3.8
There have been seven 502 errors today -- Google is crawling the site (I have created a ticket for a robots.txt file to prevent this for dev sites ticket:487):
cd /var/log/nginx
grep '1.[0|1]" 502 ' access.log
"66.249.75.117" newlive.puffin.webarch.net [29/Jan/2013:07:19:15 +0000] "GET /transition-themes HTTP/1.1" 502 166 257 311 "-" "Mozilla/5.0 (compatible; Googlebot/2.1; +http://www.google.com/bot.html)" 0.112 "-"
"66.249.78.117" newlive.puffin.webarch.net [29/Jan/2013:08:11:18 +0000] "GET /cms/26134/news/feed HTTP/1.1" 502 166 259 311 "-" "Mozilla/5.0 (compatible; Googlebot/2.1; +http://www.google.com/bot.html)" 0.030 "-"
"66.249.78.117" newlive.puffin.webarch.net [29/Jan/2013:09:14:56 +0000] "GET /robots.txt HTTP/1.1" 502 166 276 311 "-" "Mozilla/5.0 (compatible; Googlebot/2.1; +http://www.google.com/bot.html)" 0.029 "-"
"66.249.78.117" newlive.puffin.webarch.net [29/Jan/2013:10:11:03 +0000] "GET /about/people/trustees HTTP/1.1" 502 166 261 311 "-" "Mozilla/5.0 (compatible; Googlebot/2.1; +http://www.google.com/bot.html)" 0.030 "-"
"66.249.78.117" newlive.puffin.webarch.net [29/Jan/2013:11:19:37 +0000] "GET /people/w HTTP/1.1" 502 166 248 311 "-" "Mozilla/5.0 (compatible; Googlebot/2.1; +http://www.google.com/bot.html)" 0.030 "-"
"66.249.78.117" newlive.puffin.webarch.net [29/Jan/2013:12:10:55 +0000] "GET /people/y HTTP/1.1" 502 166 248 311 "-" "Mozilla/5.0 (compatible; Googlebot/2.1; +http://www.google.com/bot.html)" 0.030 "-"
"66.249.75.117" newlive.puffin.webarch.net [29/Jan/2013:13:17:34 +0000] "GET /blogs/feed HTTP/1.1" 502 166 250 311 "-" "Mozilla/5.0 (compatible; Googlebot/2.1; +http://www.google.com/bot.html)" 0.112 "-"
It might be of note that the errors above only happened once an hour at between 7 and 13 past the hour.
I tried to duplicate this using wget to recursively download the site (without limits) but this didn't generate the error, so I changed to requesting pages every 10 mins to see if this generated errors and it has (once so far):
wget -r --wait=10m --user-agent="Mozilla/5.0 (TN web checker) Gecko/20100101 Firefox/18.0" --server-response http://newlive.puffin.webarch.net/

Connecting to newlive.puffin.webarch.net|81.95.52.103|:80... connected.
HTTP request sent, awaiting response...
  HTTP/1.1 502 Bad Gateway
  Server: nginx
  Date: Tue, 29 Jan 2013 14:11:45 GMT
  Content-Type: text/html
  Content-Length: 166
  Connection: close
2013-01-29 14:11:45 ERROR 502: Bad Gateway.
Notes that robots.txt is a static file -- no need for a database connection to serve this file.
I have the impression that perhaps it's something like the disks spinning down due to inactivity behind this?
comment:16 Changed 4 years ago by chris
- Add Hours to Ticket changed from 0.0 to 0.25
- Total Hours changed from 3.8 to 4.05
There have been two more 502s for Googlebot this afternoon, but no additional ones from the wget running every 10 mins. Both of the Googlebot 502s were as 12 mins past the hour:
"66.249.75.117" newlive.puffin.webarch.net [29/Jan/2013:15:12:28 +0000] "GET /people/malomo HTTP/1.1" 502 166 253 311 "-" "Mozilla/5.0 (compatible; Googlebot/2.1; +http://www.google.com/bot.html)" 0.112 "-"
"66.249.75.117" newlive.puffin.webarch.net [29/Jan/2013:16:12:04 +0000] "GET /initiatives/h HTTP/1.1" 502 166 253 311 "-" "Mozilla/5.0 (compatible; Googlebot/2.1; +http://www.google.com/bot.html)" 0.111 "-"
comment:17 Changed 4 years ago by jim
FYI I did a diff on Babylon's my.cnf vs. Puffin's... There were two;
- Puffin has a higher innodb_buffer_pool_size as it's got much more memory
- Puffin has the skip-name-resolve option enabled, which should avoid DNS lookups at the cost of only being able to use IPs in the GRANTS table.
So nothing relevant in my.cnf, and no differences in /etc/mysql/conf.d/*
Hmmm... this is now the only issue left stopping us going ahead with the move AFAIK. More debugging tomorrow...
comment:18 Changed 4 years ago by chris
- Add Hours to Ticket changed from 0.0 to 0.25
- Total Hours changed from 4.05 to 4.3
Further 502s since the ones reported in ticket:483#comment:16, yesterday, the XXX.XXX.XXX.XXX requests are me and the YYY.YYY.YYY.YYY requests are (I assume) Jim. The update to robots.txt has resulted in the Googlebot requests stopping:
"66.249.75.117" newlive.puffin.webarch.net [29/Jan/2013:17:13:34 +0000] "GET /cms/23663/events HTTP/1.1" 502 166 256 311 "-" "Mozilla/5.0 (compatible; Googlebot/2.1; +http://www.google.com/bot.html)" 0.114 "-"
"XXX.XXX.XXX.XXX" newlive.puffin.webarch.net [29/Jan/2013:18:17:22 +0000] "GET /media HTTP/1.0" 502 166 209 311 "http://newlive.puffin.webarch.net/" "Mozilla/5.0 (TN web checker) Gecko/20100101 Firefox/18.0" 0.015 "-"
"YYY.YYY.YYY.YYY" tn.puffin.webarch.net [29/Jan/2013:19:10:27 +0000] "GET /hosting/tasks/queue HTTP/1.0" 502 568 700 713 "https://tn.puffin.webarch.net/admin/hosting/settings" "Mozilla/5.0 (X11; Linux x86_64) AppleWebKit/537.11 (KHTML, like Gecko) Chrome/23.0.1271.97 Safari/537.11" 0.013 "-"
"XXX.XXX.XXX.XXX" newlive.puffin.webarch.net [29/Jan/2013:20:17:46 +0000] "GET /syndication-and-social-media HTTP/1.0" 502 166 232 311 "http://newlive.puffin.webarch.net/" "Mozilla/5.0 (TN web checker) Gecko/20100101 Firefox/18.0" 0.013 "-"
"XXX.XXX.XXX.XXX" newlive.puffin.webarch.net [29/Jan/2013:21:18:20 +0000] "GET /support/dealing-conflict HTTP/1.0" 502 166 228 311 "http://newlive.puffin.webarch.net/" "Mozilla/5.0 (TN web checker) Gecko/20100101 Firefox/18.0" 0.013 "-"
"XXX.XXX.XXX.XXX" newlive.puffin.webarch.net [29/Jan/2013:22:18:27 +0000] "GET /training HTTP/1.0" 502 166 212 311 "http://newlive.puffin.webarch.net/" "Mozilla/5.0 (TN web checker) Gecko/20100101 Firefox/18.0" 0.014 "-"
"YYY.YYY.YYY.YYY" newlive.puffin.webarch.net [29/Jan/2013:23:10:01 +0000] "GET /user/login HTTP/1.0" 502 568 656 713 "http://newlive.puffin.webarch.net/" "Mozilla/5.0 (X11; Linux x86_64) AppleWebKit/537.11 (KHTML, like Gecko) Chrome/23.0.1271.97 Safari/537.11" 0.269 "-"
"YYY.YYY.YYY.YYY" newlive.puffin.webarch.net [29/Jan/2013:23:10:03 +0000] "GET /user/login HTTP/1.0" 502 568 612 713 "http://newlive.puffin.webarch.net/" "Mozilla/5.0 (X11; Linux x86_64) AppleWebKit/537.11 (KHTML, like Gecko) Chrome/23.0.1271.97 Safari/537.11" 0.013 "-"
"YYY.YYY.YYY.YYY" tn.puffin.webarch.net [30/Jan/2013:00:15:55 +0000] "GET /hosting/servers HTTP/1.0" 502 568 709 713 "https://tn.puffin.webarch.net/admin/content/node" "Mozilla/5.0 (X11; Linux x86_64) AppleWebKit/537.11 (KHTML, like Gecko) Chrome/23.0.1271.97 Safari/537.11" 0.014 "-"
"XXX.XXX.XXX.XXX" newlive.puffin.webarch.net [30/Jan/2013:01:18:54 +0000] "GET /ingredients HTTP/1.0" 502 166 215 311 "http://newlive.puffin.webarch.net/" "Mozilla/5.0 (TN web checker) Gecko/20100101 Firefox/18.0" 0.014 "-"
"XXX.XXX.XXX.XXX" newlive.puffin.webarch.net [30/Jan/2013:02:19:03 +0000] "GET /support/branding HTTP/1.0" 502 166 220 311 "http://newlive.puffin.webarch.net/" "Mozilla/5.0 (TN web checker) Gecko/20100101 Firefox/18.0" 0.013 "-"
"XXX.XXX.XXX.XXX" newlive.puffin.webarch.net [30/Jan/2013:03:19:10 +0000] "GET /transition-2/film-news HTTP/1.0" 502 166 226 311 "http://newlive.puffin.webarch.net/" "Mozilla/5.0 (TN web checker) Gecko/20100101 Firefox/18.0" 0.016 "-"
"XXX.XXX.XXX.XXX" newlive.puffin.webarch.net [30/Jan/2013:04:19:18 +0000] "GET /video HTTP/1.0" 502 166 209 311 "http://newlive.puffin.webarch.net/" "Mozilla/5.0 (TN web checker) Gecko/20100101 Firefox/18.0" 0.013 "-"
"XXX.XXX.XXX.XXX" newlive.puffin.webarch.net [30/Jan/2013:05:19:34 +0000] "GET /why-do-transition HTTP/1.0" 502 166 221 311 "http://newlive.puffin.webarch.net/" "Mozilla/5.0 (TN web checker) Gecko/20100101 Firefox/18.0" 0.014 "-"
"XXX.XXX.XXX.XXX" newlive.puffin.webarch.net [30/Jan/2013:06:19:42 +0000] "GET /news/2012-12-14/transition-recognised-european-parliament HTTP/1.0" 502 166 261 311 "http://newlive.puffin.webarch.net/" "Mozilla/5.0 (TN web checker) Gecko/20100101 Firefox/18.0" 0.013 "-"
And todays:
"XXX.XXX.XXX.XXX" newlive.puffin.webarch.net [30/Jan/2013:07:19:52 +0000] "GET /initiatives/madeira-em-transi-o HTTP/1.0" 502 166 235 311 "http://newlive.puffin.webarch.net/" "Mozilla/5.0 (TN web checker) Gecko/20100101 Firefox/18.0" 0.014 "-"
"XXX.XXX.XXX.XXX" newlive.puffin.webarch.net [30/Jan/2013:08:10:01 +0000] "GET /stories/caroline-jackson/2013-01/wet-feet-cold-baths-and-lukewarm-soup-resilience-lancaster HTTP/1.0" 502 166 295 311 "http://newlive.puffin.webarch.net/" "Mozilla/5.0 (TN web checker) Gecko/20100101 Firefox/18.0" 0.015 "-"
"XXX.XXX.XXX.XXX" newlive.puffin.webarch.net [30/Jan/2013:09:10:13 +0000] "GET /about/funding HTTP/1.0" 502 166 217 311 "http://newlive.puffin.webarch.net/" "Mozilla/5.0 (TN web checker) Gecko/20100101 Firefox/18.0" 0.014 "-"
"XXX.XXX.XXX.XXX" newlive.puffin.webarch.net [30/Jan/2013:10:10:19 +0000] "GET /terms HTTP/1.0" 502 166 209 311 "http://newlive.puffin.webarch.net/" "Mozilla/5.0 (TN web checker) Gecko/20100101 Firefox/18.0" 0.013 "-"
I think the next things to look at is increasing the log level of Nginx, php-fpm and !MariaDB to try to get some more data -- we are managing to reproduce the bug, just not on demand.
comment:19 Changed 4 years ago by chris
- Add Hours to Ticket changed from 0.0 to 1.0
- Total Hours changed from 4.3 to 5.3
Currently !MariaDB, has a binary log, in /etc/mysql/my.cnf:
log_bin                 = /var/log/mysql/mariadb-bin
log_bin_index           = /var/log/mysql/mariadb-bin.index
This can be read using mysqlbinlog, see https://kb.askmonty.org/en/using-mysqlbinlog/2727/ however it doesn't work:
cd /var/log/mysql
mysqlbinlog mariadb-bin.000079
mysqlbinlog: unknown variable 'default-character-set=utf8'
And answer here is to edit this line in /etc/mysql/mysql.cnf:
#default-character-set   = utf8
loose-default-character-set   = utf8
Then the log can be read like this:
mysqlbinlog mariadb-bin.000079 | vim -
Comparing the Nginx 502 times with the !MariaDB log times, the logs at around 10:10:19 today, nothing was logged between 10:10:12 and 10:10:22:
# at 9449034
#130130 10:10:12 server id 8  end_log_pos 9449061       Xid = 1265233
COMMIT/*!*/;
# at 9449061
#130130 10:10:22 server id 8  end_log_pos 9449131       Query   thread_id=121909        exec_time=0     error_code=0
SET TIMESTAMP=1359540622/*!*/;
flush hosts
/*!*/;
Logs around 9:10:13:
# at 6600743
#130130  9:10:11 server id 8  end_log_pos 6600813       Query   thread_id=119123        exec_time=0     error_code=0
SET TIMESTAMP=1359537011/*!*/;
flush hosts
/*!*/;
# at 6600813
#130130  9:10:22 server id 8  end_log_pos 6600883       Query   thread_id=119129        exec_time=0     error_code=0
SET TIMESTAMP=1359537022/*!*/;
flush hosts
/*!*/;
Around 8:10:01:
# at 4456538
#130130  8:09:52 server id 8  end_log_pos 4456608       Query   thread_id=116323        exec_time=0     error_code=0
SET TIMESTAMP=1359533392/*!*/;
flush hosts
/*!*/;
# at 4456608
#130130  8:10:01 server id 8  end_log_pos 4456678       Query   thread_id=116330        exec_time=0     error_code=0
SET TIMESTAMP=1359533401/*!*/;
flush hosts
/*!*/;
# at 4456678
#130130  8:10:01 server id 8  end_log_pos 4456758       Query   thread_id=116333        exec_time=0     error_code=0
SET TIMESTAMP=1359533401/*!*/;
BEGIN
/*!*/;
# at 4456758
#130130  8:10:01 server id 8  end_log_pos 4456917       Query   thread_id=116333        exec_time=0     error_code=0
use `masterpuffinweba`/*!*/;
SET TIMESTAMP=1359533401/*!*/;
UPDATE variable SET value = 'i:1359533401;' WHERE name = 'hosting_dispatch_last_run'
/*!*/;
# at 4456917
#130130  8:10:01 server id 8  end_log_pos 4456944       Xid = 1235267
COMMIT/*!*/;
# at 4456944
#130130  8:10:01 server id 8  end_log_pos 4457024       Query   thread_id=116333        exec_time=0     error_code=0
SET TIMESTAMP=1359533401/*!*/;
BEGIN
/*!*/;
# at 4457024
#130130  8:10:01 server id 8  end_log_pos 4457232       Query   thread_id=116333        exec_time=0     error_code=0
SET TIMESTAMP=1359533401/*!*/;
INSERT INTO semaphore (name, value, expire) VALUES ('variable_cache_regenerate', '9021422225108d559ec3f29.55950919', 1359533431.9676)
/*!*/;
# at 4457232
#130130  8:10:01 server id 8  end_log_pos 4457259       Xid = 1235280
COMMIT/*!*/;
# at 4457259
#130130  8:10:01 server id 8  end_log_pos 4457339       Query   thread_id=116333        exec_time=0     error_code=0
SET TIMESTAMP=1359533401/*!*/;
BEGIN
/*!*/;
# at 4457339
#130130  8:10:01 server id 8  end_log_pos 4459118       Query   thread_id=116333        exec_time=0     error_code=0
SET TIMESTAMP=1359533401/*!*/;
UPDATE cache SET data = 'a:33:{s:9:\"clean_url\";b:1;s:9:\"cron_last\";i:1359532983;s:19:\"css_js_query_string\";s:20:\"DsKMxXpRC1BUJwu4tHkL\";s:21:\"date_default_timezone\";s:1:\"0\";s:19:\"file_directory_path\";s:37:\"sites/master.puffin.webarch.net/files\";s:19:\"file_directory_temp\";s:41:\"sites/master.puffin.webarch.net/files/tmp\";s:13:\"filter_html_1\";i:1;s:20:\"hosting_admin_client\";s:1:\"1\";s:19:\"hosting_cron_backup\";a:0:{}s:22:\"hosting_default_client\";s:1:\"1\";s:25:\"hosting_default_db_server\";s:1:\"4\";s:26:\"hosting_default_web_server\";s:1:\"2\";s:24:\"hosting_dispatch_enabled\";b:1;s:25:\"hosting_dispatch_last_run\";i:1359533401;s:21:\"hosting_own_db_server\";s:1:\"4\";s:20:\"hosting_own_platform\";s:1:\"7\";s:22:\"hosting_own_web_server\";s:1:\"2\";s:27:\"hosting_queue_cron_last_run\";i:1359532982;s:28:\"hosting_queue_tasks_last_run\";i:1359533343;s:15:\"install_profile\";s:10:\"hostmaster\";s:12:\"install_task\";s:4:\"done\";s:12:\"install_time\";i:1355588145;s:11:\"install_url\";s:32:\"http://master.puffin.webarch.net\";s:17:\"javascript_parsed\";a:0:{}s:13:\"menu_expanded\";a:0:{}s:10:\"menu_masks\";a:15:{i:0;i:61;i:1;i:31;i:2;i:30;i:3;i:29;i:4;i:24;i:5;i:21;i:6;i:15;i:7;i:14;i:8;i:13;i:9;i:11;i:10;i:7;i:11;i:5;i:12;i:3;i:13;i:2;i:14;i:1;}s:18:\"node_options_forum\";a:1:{i:0;s:6:\"status\";}s:14:\"site_frontpage\";s:13:\"hosting/sites\";s:9:\"site_mail\";s:35:\"webmaster@master.puffin.webarch.net\";s:9:\"site_name\";s:25:\"master.puffin.webarch.net\";s:13:\"theme_default\";s:5:\"eldir\";s:33:\"user_mail_status_activated_notify\";b:1;s:13:\"user_register\";i:0;}', created = 1359533401, expire = 0, headers = '', serialized = 1 WHERE cid = 'variables'
/*!*/;
# at 4459118
#130130  8:10:01 server id 8  end_log_pos 4459145       Xid = 1235282
COMMIT/*!*/;
# at 4459145
#130130  8:10:01 server id 8  end_log_pos 4459225       Query   thread_id=116333        exec_time=0     error_code=0
SET TIMESTAMP=1359533401/*!*/;
BEGIN
/*!*/;
# at 4459225
#130130  8:10:01 server id 8  end_log_pos 4459409       Query   thread_id=116333        exec_time=0     error_code=0
SET TIMESTAMP=1359533401/*!*/;
DELETE FROM semaphore WHERE name = 'variable_cache_regenerate' AND value = '9021422225108d559ec3f29.55950919'
/*!*/;
# at 4459409
#130130  8:10:01 server id 8  end_log_pos 4459436       Xid = 1235283
COMMIT/*!*/;
# at 4459436
#130130  8:10:11 server id 8  end_log_pos 4459516       Query   thread_id=116339        exec_time=0     error_code=0
SET TIMESTAMP=1359533411/*!*/;
BEGIN
/*!*/;
And around 7:19:52:
# at 2727237
#130130  7:19:42 server id 8  end_log_pos 2727307       Query   thread_id=114014        exec_time=0     error_code=0
SET TIMESTAMP=1359530382/*!*/;
flush hosts
/*!*/;
# at 2727307
#130130  7:19:52 server id 8  end_log_pos 2727377       Query   thread_id=114020        exec_time=0     error_code=0
SET TIMESTAMP=1359530392/*!*/;
flush hosts
/*!*/;
# at 2727377
#130130  7:20:01 server id 8  end_log_pos 2727447       Query   thread_id=114026        exec_time=0     error_code=0
SET TIMESTAMP=1359530401/*!*/;
flush hosts
/*!*/;
I can't see anything of interest in these logs.
To increase the PHP-FPM log level the /opt/local/etc/php53-fpm.conf file was edited and the following was changed:
;log_level = notice
log_level = debug
And the server was restarted (restart didn't work, stop and start were used):
/etc/init.d/php53-fpm stop
Gracefully shutting down php53-fpm... done
/etc/init.d/php53-fpm stop
Gracefully shutting down php53-fpm..warning, no pid file found - php53-fpm not running ?
/etc/init.d/php53-fpm start
So next time there is a 502 we can check /var/log/php/php53-fpm-error.log.
Since starting this ticket comment there have been two more 502s:
"XXX.XXX.XXX.XXX" newlive.puffin.webarch.net [30/Jan/2013:11:10:31 +0000] "GET /resources/who-we-are-and-what-we-do HTTP/1.0" 502 166 244 311 "http://newlive.puffin.webarch.net/about" "Mozilla/5.0 (TN web checker) Gecko/20100101 Firefox/18.0" 0.013 "-"
"XXX.XXX.XXX.XXX" newlive.puffin.webarch.net [30/Jan/2013:12:20:36 +0000] "GET /user/password HTTP/1.0" 502 166 227 311 "http://newlive.puffin.webarch.net/user/login" "Mozilla/5.0 (TN web checker) Gecko/20100101 Firefox/18.0" 0.014 "-"
Comparing the php-fpm and the times of the 502 (this is from before the log level was set to debug), around 12:20:36 we have:
rotate
[30-Jan-2013 12:10:01] NOTICE: Reloading in progress ...
[30-Jan-2013 12:10:01] NOTICE: reloading: execvp("/opt/local/sbin/php-fpm", {"/opt/local/sbin/php-fpm", "--fpm-config", "/opt/local/etc/php53-fpm.conf", "-c", "/opt/local/etc/php53.ini"})
[30-Jan-2013 12:10:01] NOTICE: using inherited socket fd=7, "127.0.0.1:9090"
[30-Jan-2013 12:10:01] NOTICE: using inherited socket fd=7, "127.0.0.1:9090"
[30-Jan-2013 12:10:01] NOTICE: fpm is running, pid 687
[30-Jan-2013 12:10:01] NOTICE: ready to handle connections
[30-Jan-2013 12:20:36] WARNING: [pool www] child 691 exited with code 1 after 635.103064 seconds from start
[30-Jan-2013 12:20:36] NOTICE: [pool www] child 4876 started
[30-Jan-2013 12:52:41] NOTICE: Finishing ...
[30-Jan-2013 12:52:41] NOTICE: exiting, bye-bye!
There are no previous logs -- it looks like there is a problem with log rotation for php-fpm also the following line from the log above corresponds exactly with a 502:
[30-Jan-2013 12:20:36] WARNING: [pool www] child 691 exited with code 1 after 635.103064 seconds from start
I think we are getting somewhere...
comment:20 Changed 4 years ago by chris
- Add Hours to Ticket changed from 0.0 to 0.25
- Total Hours changed from 5.3 to 5.55
The last two 502 errors in /var/log/nginx/access.log:
"XXX.XXX.XXX.XXX" newlive.puffin.webarch.net [30/Jan/2013:13:00:40 +0000] "GET /blogs/ed-mitchell/2010-03/editing-your-personal-profile HTTP/1.0" 502 166 268 311 "http://newlive.puffin.webarch.net/site-help" "Mozilla/5.0 (TN web checker) Gecko/20100101 Firefox/18.0" 0.013 "-"
"XXX.XXX.XXX.XXX" newlive.puffin.webarch.net [30/Jan/2013:13:10:40 +0000] "GET /blogs/ed-mitchell/2010-08/adding-yourself-speakers-and-facilitators-directories HTTP/1.0" 502 166 292 311 "http://newlive.puffin.webarch.net/site-help" "Mozilla/5.0 (TN web checker) Gecko/20100101 Firefox/18.0" 0.012 "-"
The logs are being rotated so fast that log for the first 502 has already been lost, for the second 502, at 13:10:40 the corresponding lines in /var/log/php/php53-fpm-error.log are:
[30-Jan-2013 13:10:39.988513] DEBUG: pid 23781, fpm_pctl_perform_idle_server_maintenance(), line 379: [pool www] currently 0 active children, 2 spare children, 2 running children. Spawning rate 1
[30-Jan-2013 13:10:40.001237] DEBUG: pid 23781, fpm_got_signal(), line 72: received SIGCHLD
[30-Jan-2013 13:10:40.001436] WARNING: pid 23781, fpm_children_bury(), line 252: [pool www] child 23782 exited with code 1 after 38.148025 seconds from start
[30-Jan-2013 13:10:40.009202] NOTICE: pid 23781, fpm_children_make(), line 421: [pool www] child 24119 started
[30-Jan-2013 13:10:40.009310] DEBUG: pid 23781, fpm_event_loop(), line 411: event module triggered 1 events
[30-Jan-2013 13:10:40.992493] DEBUG: pid 23781, fpm_pctl_perform_idle_server_maintenance(), line 379: [pool www] currently 0 active children, 2 spare children, 2 running children. Spawning rate 1
I don't see what is causing the php-fpm logs to be rotated, there is nothing in /etc/logrotate.d/.
comment:21 Changed 4 years ago by chris
- Add Hours to Ticket changed from 0.0 to 0.5
- Total Hours changed from 5.55 to 6.05
The latest 502 was at 13:50:45:
"XXX.XXX.XXX.XXX" newlive.puffin.webarch.net [30/Jan/2013:13:50:45 +0000] "GET /blogs/ed-mitchell/2011-01/adding-your-initiatives-event-site HTTP/1.0" 502 166 273 311 "http://newlive.puffin.webarch.net/site-help" "Mozilla/5.0 (TN web checker) Gecko/20100101 Firefox/18.0" 0.014 "-
And the corresponding entry in /var/log/php/php53-fpm-error.log:
[30-Jan-2013 13:50:45.446679] DEBUG: pid 5737, fpm_pctl_perform_idle_server_maintenance(), line 379: [pool www] currently 1 active children, 1 spare children, 2 running children. Spawning rate 1
[30-Jan-2013 13:50:45.446794] DEBUG: pid 5737, fpm_got_signal(), line 72: received SIGCHLD
[30-Jan-2013 13:50:45.447000] WARNING: pid 5737, fpm_children_bury(), line 252: [pool www] child 5738 exited with code 1 after 225.534299 seconds from start
[30-Jan-2013 13:50:45.454058] NOTICE: pid 5737, fpm_children_make(), line 421: [pool www] child 7222 started
[30-Jan-2013 13:50:45.454162] DEBUG: pid 5737, fpm_event_loop(), line 411: event module triggered 1 events
[30-Jan-2013 13:50:46.447263] DEBUG: pid 5737, fpm_pctl_perform_idle_server_maintenance(), line 379: [pool www] currently 0 active children, 2 spare children, 2 running children. Spawning rate 1
Email from Jim:
You should check /var/xdrago for the BOA scripts that do various self healing, tweaking and other tasks -- might be in there.
OR you could download the source from https://github.com/omega8cc/nginx-for-drupal and search it.
If the logs are rotating too fast, we should raise a bug on the Barracuda issue tracker.
In /var/xdrago/cron/crontabs/root there are these tasks:
# DO NOT EDIT THIS FILE - edit the master and reinstall.
# (/tmp/hm.cronBTAzqF installed on Thu Jul 22 19:24:53 2010)
# (Cron version -- $Id: crontab.c,v 2.13 1994/01/17 03:20:37 vixie Exp $)
* * * * * bash /var/xdrago/second.sh >/dev/null 2>&1
* * * * * bash /var/xdrago/minute.sh >/dev/null 2>&1
* * * * * bash /var/xdrago/runner.sh >/dev/null 2>&1
*/5 * * * * bash /var/xdrago/manage_ltd_users.sh >/dev/null 2>&1
10 * * * * bash /var/xdrago/clear.sh >/dev/null 2>&1
10 * * * * bash /var/xdrago/purge_binlogs.sh >/dev/null 2>&1
15 3 * * * bash /var/xdrago/graceful.sh >/dev/null 2>&1
15 4 * * * bash /var/xdrago/mysql_backup.sh >/dev/null 2>&1
15 7 * * * bash /var/xdrago/usage.sh >/dev/null 2>&1
15 8 * * * bash /var/xdrago/fetch-remote.sh >/dev/null 2>&1
###EOF2013###
Reading all the scripts at /var/xdrago/*.sh, the file clobbering the logs is /var/xdrago/clear.sh:
#!/bin/bash

SHELL=/bin/bash
PATH=/usr/local/sbin:/usr/local/bin:/opt/local/bin:/usr/sbin:/usr/bin:/sbin:/bin

echo rotate > /var/log/php/php-fpm-error.log
echo rotate > /var/log/php/php-fpm-slow.log
echo rotate > /var/log/php/php53-fpm-error.log
echo rotate > /var/log/php/php53-fpm-slow.log
echo rotate > /var/log/php/error_log_52
echo rotate > /var/log/php/error_log_53
echo rotate > /var/log/php/error_log_cli_52
echo rotate > /var/log/php/error_log_cli_53
echo rotate > /var/log/redis/redis-server.log
echo rotate > /var/log/mysql/sql-slow-query.log
if test -f /root/.high_traffic.cnf ; then
  echo rotate > /var/log/nginx/access.log
else
  /etc/init.d/php53-fpm reload
  if test -f /etc/init.d/php-fpm ; then
    /etc/init.d/php-fpm reload
  fi
fi
if test -f /var/run/boa_run.pid ; then
  sleep 1
else
  rm -f /tmp/*error*
fi
ntpdate pool.ntp.org
touch /var/xdrago/log/clear.done
###EOF2013###
I have commented the /var/xdrago/clear.sh task from the root crontab.
I have added include = /var/xdrago to /etc/backup.d/90.rdiff.
Jim -- by this evening we should have enough examples of 502s and the corresponding PHP+FPM log entries to raise a ticket upstream? Would it help if I put these all on a wiki page to save digging through the comments on this ticket?
comment:22 Changed 4 years ago by chris
- Add Hours to Ticket changed from 0.0 to 0.4
- Total Hours changed from 6.05 to 6.45
I have just checked the nginx log:
grep '1.[0|1]" 502 ' /var/log/nginx/access.log
And there have been no 502s since the 10 mins past the hour /var/xdrago/clear.sh cronjob was disabled, the wget job crawling the site at a page every 10 mins is still running.
Looking at the /var/xdrago/clear.sh script I think the problem might relate to this section, I have added comments explaining what each part does:
# the following if tests to see if /root/.high_traffic.cnf exists:
if test -f /root/.high_traffic.cnf ; then

  # if /root/.high_traffic.cnf exists then clobber the Nginx access log:
  echo rotate > /var/log/nginx/access.log

# if /root/.high_traffic.cnf doesn't exist (and it doesn't and I expect it
# won't unless the site has a lot of traffic) then:
else

  # reload /etc/init.d/php53-fpm
  /etc/init.d/php53-fpm reload

  # test to see if /etc/init.d/php-fpm exists - it does!
  if test -f /etc/init.d/php-fpm ; then

    # reload the other install of php-fpm -- this is perhaps where the problem is?
    /etc/init.d/php-fpm reload
  fi
fi
So I have changed that section to only reload one version of php-fpm and I have also disabled the log clobbering:
#!/bin/bash

SHELL=/bin/bash
PATH=/usr/local/sbin:/usr/local/bin:/opt/local/bin:/usr/sbin:/usr/bin:/sbin:/bin

#echo rotate > /var/log/php/php-fpm-error.log
#echo rotate > /var/log/php/php-fpm-slow.log
#echo rotate > /var/log/php/php53-fpm-error.log
#echo rotate > /var/log/php/php53-fpm-slow.log
#echo rotate > /var/log/php/error_log_52
#echo rotate > /var/log/php/error_log_53
#echo rotate > /var/log/php/error_log_cli_52
#echo rotate > /var/log/php/error_log_cli_53
#echo rotate > /var/log/redis/redis-server.log
#echo rotate > /var/log/mysql/sql-slow-query.log
if test -f /root/.high_traffic.cnf ; then
  echo rotate > /var/log/nginx/access.log
else
  if test -f /etc/init.d/php53-fpm ; then
    /etc/init.d/php53-fpm reload
  elif test -f /etc/init.d/php-fpm ; then
    /etc/init.d/php-fpm reload
  fi
fi
if test -f /var/run/boa_run.pid ; then
  sleep 1
else
  rm -f /tmp/*error*
fi
ntpdate pool.ntp.org
touch /var/xdrago/log/clear.done
###EOF2013###
I have reenabled the cronjob but changed it so the results will be mailed to root:
#10 * * * * bash /var/xdrago/clear.sh >/dev/null 2>&1
10 * * * * bash /var/xdrago/clear.sh
comment:23 Changed 4 years ago by chris
- Add Hours to Ticket changed from 0.0 to 0.1
- Total Hours changed from 6.45 to 6.55
So there has been another 502, while I was writing the comment above:
"XXX.XXX.XXX.XXX" newlive.puffin.webarch.net [30/Jan/2013:17:31:17 +0000] "GET /user/login?destination=comment%2Freply%2F28633%23comment-form HTTP/1.0" 502 166 269 311 "http://newlive.puffin.webarch.net/news" "Mozilla/5.0 (TN web checker) Gecko/20100101 Firefox/18.0" 0.014 "-"
And the entry in the php-fpm log is much the same as before:
[30-Jan-2013 17:31:16.664650] DEBUG: pid 24701, fpm_pctl_perform_idle_server_maintenance(), line 379: [pool www] currently 0 active children, 2 spare children, 2 running children. Spawning rate 1
[30-Jan-2013 17:31:17.501155] DEBUG: pid 24701, fpm_got_signal(), line 72: received SIGCHLD
[30-Jan-2013 17:31:17.501375] WARNING: pid 24701, fpm_children_bury(), line 252: [pool www] child 24702 exited with code 1 after 192.936592 seconds from start
[30-Jan-2013 17:31:17.509328] NOTICE: pid 24701, fpm_children_make(), line 421: [pool www] child 25983 started
[30-Jan-2013 17:31:17.509420] DEBUG: pid 24701, fpm_event_loop(), line 411: event module triggered 1 events
[30-Jan-2013 17:31:17.668624] DEBUG: pid 24701, fpm_pctl_perform_idle_server_maintenance(), line 379: [pool www] currently 0 active children, 2 spare children, 2 running children. Spawning rate 1
What is the reason for reloading php-fpm every hour -- does it have memory leaks?
comment:24 Changed 4 years ago by chris
- Add Hours to Ticket changed from 0.0 to 0.35
- Total Hours changed from 6.55 to 6.9
Two more 502s:
"XXX.XXX.XXX.XXX" newlive.puffin.webarch.net [30/Jan/2013:18:21:18 +0000] "GET /user/register?destination=comment%2Freply%2F28501%23comment-form HTTP/1.0" 502 166 272 311 "http://newlive.puffin.webarch.net/news" "Mozilla/5.0 (TN web checker) Gecko/20100101 Firefox/18.0" 0.013 "-"
"XXX.XXX.XXX.XXX" newlive.puffin.webarch.net [30/Jan/2013:19:11:25 +0000] "GET /user/login?destination=comment%2Freply%2F28485%23comment-form HTTP/1.0" 502 166 269 311 "http://newlive.puffin.webarch.net/news" "Mozilla/5.0 (TN web checker) Gecko/20100101 Firefox/18.0" 0.017 "-"
And the corresponding php-fpm logs from 18:21:18:
[30-Jan-2013 18:21:18.090712] DEBUG: pid 8258, fpm_pctl_perform_idle_server_maintenance(), line 379: [pool www] currently 0 active children, 2 spare children, 2 running children. Spawning rate 1
[30-Jan-2013 18:21:18.811415] DEBUG: pid 8258, fpm_got_signal(), line 72: received SIGCHLD
[30-Jan-2013 18:21:18.811647] WARNING: pid 8258, fpm_children_bury(), line 252: [pool www] child 8261 exited with code 1 after 678.214427 seconds from start
[30-Jan-2013 18:21:18.819596] NOTICE: pid 8258, fpm_children_make(), line 421: [pool www] child 12623 started
[30-Jan-2013 18:21:18.819710] DEBUG: pid 8258, fpm_event_loop(), line 411: event module triggered 1 events
[30-Jan-2013 18:21:19.094755] DEBUG: pid 8258, fpm_pctl_perform_idle_server_maintenance(), line 379: [pool www] currently 0 active children, 2 spare children, 2 running children. Spawning rate 1
And 19:11:25:
[30-Jan-2013 19:11:25.370780] DEBUG: pid 31407, fpm_pctl_perform_idle_server_maintenance(), line 379: [pool www] currently 1 active children, 1 spare children, 2 running children. Spawning rate 1
[30-Jan-2013 19:11:25.370883] DEBUG: pid 31407, fpm_got_signal(), line 72: received SIGCHLD
[30-Jan-2013 19:11:25.371088] WARNING: pid 31407, fpm_children_bury(), line 252: [pool www] child 31408 exited with code 1 after 84.060608 seconds from start
[30-Jan-2013 19:11:25.377938] NOTICE: pid 31407, fpm_children_make(), line 421: [pool www] child 32060 started
[30-Jan-2013 19:11:25.378060] DEBUG: pid 31407, fpm_event_loop(), line 411: event module triggered 1 events
[30-Jan-2013 19:11:26.374138] DEBUG: pid 31407, fpm_pctl_perform_idle_server_maintenance(), line 379: [pool www] currently 0 active children, 2 spare children, 2 running children. Spawning rate 1
Because it's still happening the edits I made to /var/xdrago/clear.sh were clearly not the answer.
So I have changed these values in /opt/local/etc/php53-fpm.conf to see if that helps:
;emergency_restart_interval = 1m
emergency_restart_interval = 0

;pm.max_requests = 500
pm.max_requests = 0

;access.log = log/$pool.access.log
access.log = /var/log/php/$pool.access.log
And /etc/init.d/php53-fpm was stopped and started.
The following packages were updated via aptitude (should we be updating packages using aptitude of just using the baracuda script?):
libmariadbclient-dev/squeeze libmariadbclient18/squeeze libmariadbd-dev/squeeze libmysqlclient18/squeeze mariadb-client-5.5/squeeze mariadb-client-core-5.5/squeeze mariadb-common/squeeze mariadb-server-5.5/squeeze mariadb-server-core-5.5/squeeze mysql-common/squeeze
comment:25 Changed 4 years ago by chris
- Add Hours to Ticket changed from 0.0 to 0.1
- Total Hours changed from 6.9 to 7.0
There have been no more 502s since the one at 19:11 so perhaps we have cracked it... I'm not around tomorrow during the day but I'll check on the 502s again tomorrow night.
comment:26 Changed 4 years ago by chris
- Add Hours to Ticket changed from 0.0 to 1.0
- Total Hours changed from 7.0 to 8.0
No more 502s, I think one of the changes made to /opt/local/etc/php53-fpm.conf solved it and I suspected it was this one:
;pm.max_requests = 500
pm.max_requests = 0
To confirm this I undid the change to emergency_restart_interval made in ticket:483#comment:24 but left pm.max_requests set to 0 (infinity).
Since the requests to the server from spiders has stopped due to the new robots.txt files I have set off a speed unlimited crawl of the site using http://httrack.org/ from penguin, with httrack set to ignore robots rules to see if this generates some 502s.
And while writing this ticket comment there was another 502, however I think this was caused by the restart of php-pfm done after making the changes above -- there have been no others (so far!):
"81.95.52.111" newlive.puffin.webarch.net [31/Jan/2013:16:22:11 +0000] "GET /news?page=21 HTTP/1.1" 502 166 452 311 "http://newlive.puffin.webarch.net/news?page=13" "Mozilla/5.0 (TN web checker) Gecko/20100101 Firefox/18.0" 1.445 "-"
The corresponding entry in /var/log/php/php53-fpm-error.log:
[31-Jan-2013 16:22:11.138278] DEBUG: pid 29287, fpm_got_signal(), line 108: received SIGUSR2
[31-Jan-2013 16:22:11.138352] NOTICE: pid 29287, fpm_got_signal(), line 109: Reloading in progress ...
[31-Jan-2013 16:22:11.138412] DEBUG: pid 29287, fpm_pctl(), line 231: switching to 'reloading' state
[31-Jan-2013 16:22:11.138479] DEBUG: pid 29287, fpm_pctl_kill_all(), line 159: [pool www] sending signal 3 SIGQUIT to child 31291
[31-Jan-2013 16:22:11.138532] DEBUG: pid 29287, fpm_pctl_kill_all(), line 159: [pool www] sending signal 3 SIGQUIT to child 29291
[31-Jan-2013 16:22:11.138573] DEBUG: pid 29287, fpm_pctl_kill_all(), line 168: 2 child(ren) still alive
[31-Jan-2013 16:22:11.138615] DEBUG: pid 29287, fpm_event_loop(), line 411: event module triggered 1 events
[31-Jan-2013 16:22:11.138649] DEBUG: pid 29287, fpm_pctl_kill_all(), line 159: [pool www] sending signal 15 SIGTERM to child 31291
[31-Jan-2013 16:22:11.138680] DEBUG: pid 29287, fpm_pctl_kill_all(), line 159: [pool www] sending signal 15 SIGTERM to child 29291
[31-Jan-2013 16:22:11.138703] DEBUG: pid 29287, fpm_pctl_kill_all(), line 168: 2 child(ren) still alive
[31-Jan-2013 16:22:11.171483] DEBUG: pid 29287, fpm_got_signal(), line 72: received SIGCHLD
[31-Jan-2013 16:22:11.171574] DEBUG: pid 29287, fpm_children_bury(), line 252: [pool www] child 29291 exited on signal 15 (SIGTERM) after 729.775003 seconds from start
[31-Jan-2013 16:22:11.171593] DEBUG: pid 29287, fpm_event_loop(), line 411: event module triggered 1 events
[31-Jan-2013 16:22:11.172417] DEBUG: pid 29287, fpm_got_signal(), line 72: received SIGCHLD
[31-Jan-2013 16:22:11.172466] DEBUG: pid 29287, fpm_children_bury(), line 252: [pool www] child 31291 exited on signal 15 (SIGTERM) after 443.710119 seconds from start
[31-Jan-2013 16:22:11.172479] NOTICE: pid 29287, fpm_pctl_exec(), line 98: reloading: execvp("/opt/local/sbin/php-fpm", {"/opt/local/sbin/php-fpm", "--fpm-config", "/opt/local/etc/php53-fpm.conf", "-c", "/opt/local/etc/php53.ini"})
[31-Jan-2013 16:22:11.305963] DEBUG: pid 2674, fpm_scoreboard_init_main(), line 40: got clock tick '100'
[31-Jan-2013 16:22:11.306956] NOTICE: pid 2674, fpm_sockets_init_main(), line 328: using inherited socket fd=8, "127.0.0.1:9090"
[31-Jan-2013 16:22:11.306956] NOTICE: pid 2674, fpm_sockets_init_main(), line 328: using inherited socket fd=8, "127.0.0.1:9090"
[31-Jan-2013 16:22:11.307145] DEBUG: pid 2674, fpm_event_init_main(), line 333: event module is epoll and 1 fds have been reserved
[31-Jan-2013 16:22:11.307442] NOTICE: pid 2674, fpm_init(), line 83: fpm is running, pid 2674
[31-Jan-2013 16:22:11.307575] DEBUG: pid 2674, main(), line 1832: Sending "1" (OK) to parent via fd=6
[31-Jan-2013 16:22:11.316120] DEBUG: pid 2674, fpm_children_make(), line 421: [pool www] child 2675 started
[31-Jan-2013 16:22:11.323642] DEBUG: pid 2674, fpm_children_make(), line 421: [pool www] child 2676 started
[31-Jan-2013 16:22:11.323755] DEBUG: pid 2674, fpm_pctl_heartbeat(), line 460: heartbeat have been set up with a timeout of 10000ms
[31-Jan-2013 16:22:11.323816] DEBUG: pid 2674, fpm_event_loop(), line 362: 4808 bytes have been reserved in SHM
[31-Jan-2013 16:22:11.323844] NOTICE: pid 2674, fpm_event_loop(), line 363: ready to handle connections
comment:27 Changed 4 years ago by chris
- Add Hours to Ticket changed from 0.0 to 0.2
- Total Hours changed from 8.0 to 8.2
Running the post code speed test script (see ticket:466#comment:55) triggered a 502:
"81.95.52.111" newlive.puffin.webarch.net [31/Jan/2013:21:10:01 +0000] "GET /nearby?distance[postal_code]=PE3&distance[country]=uk&distance[search_distance]=50&distance[search_units]=mile HTTP/1.0" 502 166 240 311 "-" "Mozilla/5.0 (TN Speed Test)" 1.248 "-"
This is from the /var/log/php/php53-fpm-error.log log:
[31-Jan-2013 21:10:01.854236] DEBUG: pid 406, fpm_pctl_perform_idle_server_maintenance(), line 379: [pool www] currently 1 active children, 1 spare children, 2 running children. Spawning rate 1
[31-Jan-2013 21:10:01.931397] DEBUG: pid 406, fpm_got_signal(), line 108: received SIGUSR2
[31-Jan-2013 21:10:01.931492] NOTICE: pid 406, fpm_got_signal(), line 109: Reloading in progress ...
[31-Jan-2013 21:10:01.931571] DEBUG: pid 406, fpm_pctl(), line 231: switching to 'reloading' state
[31-Jan-2013 21:10:01.931659] DEBUG: pid 406, fpm_pctl_kill_all(), line 159: [pool www] sending signal 3 SIGQUIT to child 408
[31-Jan-2013 21:10:01.931727] DEBUG: pid 406, fpm_pctl_kill_all(), line 159: [pool www] sending signal 3 SIGQUIT to child 407
[31-Jan-2013 21:10:01.931786] DEBUG: pid 406, fpm_pctl_kill_all(), line 168: 2 child(ren) still alive
[31-Jan-2013 21:10:01.931851] DEBUG: pid 406, fpm_event_loop(), line 411: event module triggered 1 events
[31-Jan-2013 21:10:01.931934] DEBUG: pid 406, fpm_pctl_kill_all(), line 159: [pool www] sending signal 15 SIGTERM to child 408
[31-Jan-2013 21:10:01.932007] DEBUG: pid 406, fpm_pctl_kill_all(), line 159: [pool www] sending signal 15 SIGTERM to child 407
[31-Jan-2013 21:10:01.932047] DEBUG: pid 406, fpm_pctl_kill_all(), line 168: 2 child(ren) still alive
[31-Jan-2013 21:10:01.962708] DEBUG: pid 406, fpm_got_signal(), line 72: received SIGCHLD
[31-Jan-2013 21:10:01.963062] DEBUG: pid 406, fpm_children_bury(), line 252: [pool www] child 407 exited on signal 15 (SIGTERM) after 3599.775706 seconds from start
[31-Jan-2013 21:10:01.963169] DEBUG: pid 406, fpm_event_loop(), line 411: event module triggered 1 events
[31-Jan-2013 21:10:01.969971] DEBUG: pid 406, fpm_got_signal(), line 72: received SIGCHLD
[31-Jan-2013 21:10:01.970087] DEBUG: pid 406, fpm_children_bury(), line 252: [pool www] child 408 exited on signal 15 (SIGTERM) after 3599.779086 seconds from start
[31-Jan-2013 21:10:01.970109] NOTICE: pid 406, fpm_pctl_exec(), line 98: reloading: execvp("/opt/local/sbin/php-fpm", {"/opt/local/sbin/php-fpm", "--fpm-config", "/opt/local/etc/php53-fpm.conf", "-c", "/opt/local/etc/php53.ini"})
[31-Jan-2013 21:10:02.115087] DEBUG: pid 24440, fpm_scoreboard_init_main(), line 40: got clock tick '100'
[31-Jan-2013 21:10:02.116062] NOTICE: pid 24440, fpm_sockets_init_main(), line 328: using inherited socket fd=8, "127.0.0.1:9090"
[31-Jan-2013 21:10:02.116062] NOTICE: pid 24440, fpm_sockets_init_main(), line 328: using inherited socket fd=8, "127.0.0.1:9090"
[31-Jan-2013 21:10:02.116183] DEBUG: pid 24440, fpm_event_init_main(), line 333: event module is epoll and 1 fds have been reserved
[31-Jan-2013 21:10:02.116528] NOTICE: pid 24440, fpm_init(), line 83: fpm is running, pid 24440
[31-Jan-2013 21:10:02.116641] DEBUG: pid 24440, main(), line 1832: Sending "1" (OK) to parent via fd=6
[31-Jan-2013 21:10:02.125758] DEBUG: pid 24440, fpm_children_make(), line 421: [pool www] child 24444 started
[31-Jan-2013 21:10:02.134330] DEBUG: pid 24440, fpm_children_make(), line 421: [pool www] child 24449 started
[31-Jan-2013 21:10:02.134454] DEBUG: pid 24440, fpm_pctl_heartbeat(), line 460: heartbeat have been set up with a timeout of 10000ms
[31-Jan-2013 21:10:02.134524] DEBUG: pid 24440, fpm_event_loop(), line 362: 4808 bytes have been reserved in SHM
[31-Jan-2013 21:10:02.134554] NOTICE: pid 24440, fpm_event_loop(), line 363: ready to handle connections
[31-Jan-2013 21:10:03.138981] DEBUG: pid 24440, fpm_pctl_perform_idle_server_maintenance(), line 379: [pool www] currently 1 active children, 1 spare children, 2 running children. Spawning rate 1
This 502 corresponds exactly with the php-fpm reload that the clear.sh script does at 10 mins past each hour, so I have now commented out that cron task and set the httrack spidering of the site off again.
comment:28 Changed 4 years ago by chris
- Add Hours to Ticket changed from 0.0 to 0.5
- Total Hours changed from 8.2 to 8.7
Have been doing some more searching on this issue and there are a some interesting comments here:
comment:29 Changed 4 years ago by chris
- Add Hours to Ticket changed from 0.0 to 0.1
- Total Hours changed from 8.7 to 8.8
There have been no more 502s since the cronjob to run clear.sh at 10 past the hour was stopped in ticket:483#comment:27
comment:30 Changed 4 years ago by chris
- Add Hours to Ticket changed from 0.0 to 0.25
- Total Hours changed from 8.8 to 9.05
A few hours ago I set a recursive wget off on penguin, requesting pages from puffin using this command:
wget -r -e robots=off --user-agent="Mozilla/5.0 (TN web checker) Gecko/20100101 Firefox/18.0" --no-check-cert --server-response http://newlive.puffin.webarch.net/
And the result, so far, is 586 502s -- so this problem is far from fixed after all :-(
grep '1.[0|1]" 502 ' /var/log/nginx/access.log | wc -l
586
So I think the next step is try tweaking some settings as suggested in the links in ticket:483#comment:28
comment:31 Changed 4 years ago by chris
- Add Hours to Ticket changed from 0.0 to 0.1
- Total Hours changed from 9.05 to 9.15
The 586 502s all happened at the same time, between 12:25:29 and 12:25:32 and I expect it was me that cause it, so the issue might be solved, more testing needed.
comment:32 Changed 4 years ago by jim
Sounds promising!!! Anything you want me to do Chris?
comment:33 Changed 4 years ago by chris
- Owner changed from chris to jim
- Priority changed from blocker to minor
- Status changed from new to assigned
Apart from Jim raising a ticket against BOA regarding the 502 issue I think this can be now be closed.
The following is about to be posted to ticket:466#comment:67 about this issue:
A recursive wget is being run from penguin against puffin.
Following this advice:
Note: Barracuda will *not* overwrite your changes made to php.ini or php-fpm.conf on the next upgrade if you will touch the empty control file:
$ touch /opt/etc/custom.php.ini
This file was touched.
Looking at /var/xdrago/clear.sh it really doesn't do anything we need, it does things like clobbering log files but we are not so short of space that this is an issue so I don't think the root crontab needs it uncommenting, however after the next BOA upgrade we should check to see that it's not been reinstated.
comment:34 follow-up: ↓ 35 Changed 4 years ago by jim
- Owner changed from jim to chris
- Priority changed from minor to major
Though the 502 issue is resolved, I think stopping the killing of PHP-FPM is bad:
Noticed server very slow (and Munin stopped on Thursday for all Web Architect assets BTW), ran top and saw PHP-FPM sitting at 70-90% CPU. Did my work, stayed slow, ran top again, same thing...
So I service php53-fpm restart and there was an issue as below:
puffin:~# service php53-fpm restart
Gracefully shutting down php53-fpm.......... failed. Use force-quit
Starting php53-fpm..[10-Mar-2013 17:25:29.232841] ERROR: pid 8103, fpm_sockets_new_listening_socket(), line 191: unable to bind listening socket for address '127.0.0.1:9090': Address already in use (98)
[10-Mar-2013 17:25:29.233035] ERROR: pid 8103, fpm_init(), line 72: FPM initialization failed
 done
puffin:~# service php53-fpm restart
Gracefully shutting down php53-fpm.......... failed. Use force-quit
Starting php53-fpm..[10-Mar-2013 17:25:39.882861] ERROR: pid 8203, fpm_sockets_new_listening_socket(), line 191: unable to bind listening socket for address '127.0.0.1:9090': Address already in use (98)
[10-Mar-2013 17:25:39.883052] ERROR: pid 8203, fpm_init(), line 72: FPM initialization failed
 done
puffin:~# service php53-fpm force-quit
Terminating php53-fpm... done
puffin:~# service php53-fpm start
Starting php53-fpm.. done
However, after this the site has been super fast again.
Suggest going back to stock BOA and letting the cron jobs do their thing -- the 502s appear to have been caused by other issues (GEOS IP etc).
Escalating, passing to Chris for consideration...
Changed 4 years ago by chris
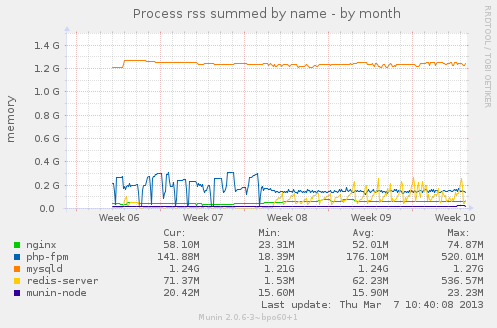
- Attachment multips_memory-month.png added
multips memory usage to 7th March 2013
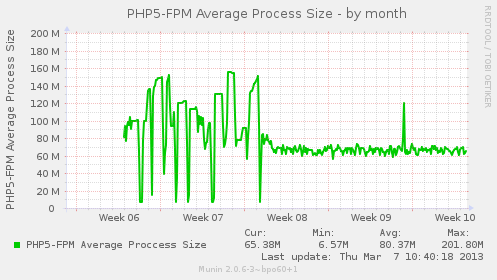
Changed 4 years ago by chris
- Attachment phpfpm_average-month.png added
phpfpm average process size to 7th March 2013
Changed 4 years ago by chris
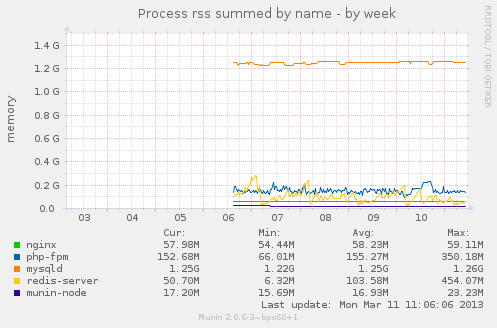
- Attachment phpfpm_memory-month.png added
phpfpm memory usage to 7th March 2013
comment:35 in reply to: ↑ 34 Changed 4 years ago by chris
- Add Hours to Ticket changed from 0.0 to 1.1
- Total Hours changed from 9.15 to 10.25
Replying to jim:
Though the 502 issue is resolved
I don't think it is resolved, the outstanding issue, as far as I'm concerned, is for you to raise this matter with the BOA developers.
I think stopping the killing of PHP-FPM is bad:
I don't agree, I think killing PHP-FPM was bad.
Noticed server very slow
Do you have any data to show this?
(and Munin stopped on Thursday for all Web Architect assets BTW)
Yes, the munin stats were moved to another server and I sent a email to the list about it. The server they were moved to is password protected and also uses a Cacert.org certificate and this has caused problems, so I have set up penguin to generate munin stats for the two servers.
Munin was installed from backports:
aptitude install munin/squeeze-backports
The following as added to /etc/munin/munin.conf (with the email address for my phone not the one shown here):
contact.me.command mail -s "${var:host} Munin Alert" nobody@example.org
contact.me.always_send warning critical

[penguin.transitionnetwork.org]
    #address 81.95.52.111
    address 127.0.0.1
    use_node_name yes

[puffin.transitionnetwork.org]
    address 81.95.52.103
    use_node_name yes
And this was added to /etc/munin/munin-node.conf on both servers:
# https://penguin.webarch.net/
allow ^81\.95\.52\.111$
This was added to the ssl config in /etc/nginx/sites-available/penguin:
        location /munin/ {
                # http://munin.readthedocs.org/en/latest/example/webserver/
                alias /var/cache/munin/www/;
                expires modified +310s;
        }
And this was added to /etc/csf/csf.allow on puffin:
tcp:in:d=4949:s=81.95.52.111 # penguin.webarch.net
And csf was restarted on puffin:
csf -r
And now we have our own munin stats here: https://penguin.transitionnetwork.org/munin/ and the wiki pages have been updated, wiki:PuffinServer#MuninStats and wiki:PenguinServer#MuninStats
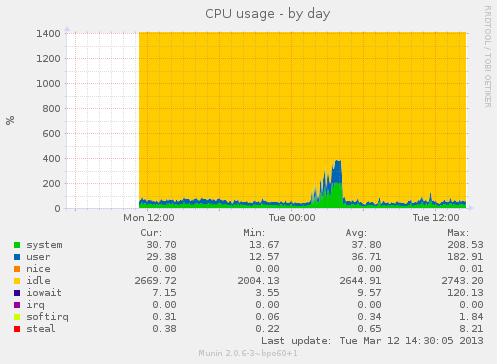
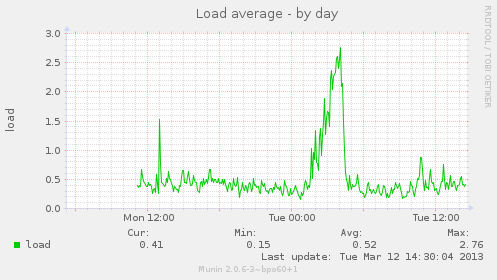
ran top and saw PHP-FPM sitting at 70-90% CPU. Did my work, stayed slow, ran top again, same thing...
So I service php53-fpm restart and there was an issue as below:
puffin:~# service php53-fpm restart
Gracefully shutting down php53-fpm.......... failed. Use force-quit
Starting php53-fpm..[10-Mar-2013 17:25:29.232841] ERROR: pid 8103, fpm_sockets_new_listening_socket(), line 191: unable to bind listening socket for address '127.0.0.1:9090': Address already in use (98)
[10-Mar-2013 17:25:29.233035] ERROR: pid 8103, fpm_init(), line 72: FPM initialization failed
 done
puffin:~# service php53-fpm restart
Gracefully shutting down php53-fpm.......... failed. Use force-quit
Starting php53-fpm..[10-Mar-2013 17:25:39.882861] ERROR: pid 8203, fpm_sockets_new_listening_socket(), line 191: unable to bind listening socket for address '127.0.0.1:9090': Address already in use (98)
[10-Mar-2013 17:25:39.883052] ERROR: pid 8203, fpm_init(), line 72: FPM initialization failed
 done
puffin:~# service php53-fpm force-quit
Terminating php53-fpm... done
puffin:~# service php53-fpm start
Starting php53-fpm.. done
However, after this the site has been super fast again.
The above problem with restarting php-fpm illustrates why there were problems with it being killed via cron -- this isn't a graceful event, it involves downtime and while php-fpm is down people get the 502 errors.
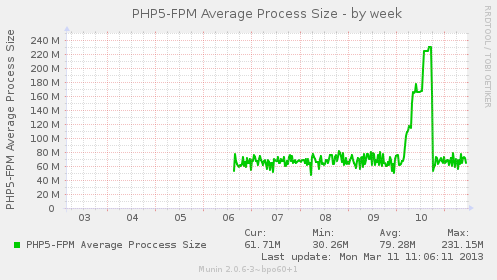
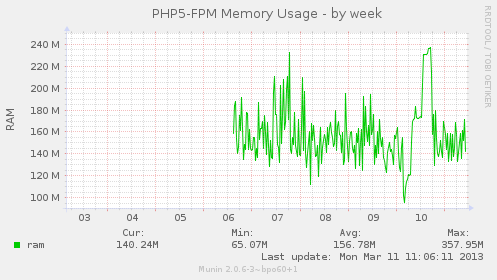
The justification for php-fpm being killed all the time is that it leaks memory. But we have no evidence of this, if you look at these graphs, which cover the period from the server going live to 7th March 2013, you can see that the memory usage for php-fpm does not keep growing -- it's stable:
- /trac/attachment/ticket/483/multips_memory-month.png
- /trac/attachment/ticket/483/phpfpm_average-month.png
- /trac/attachment/ticket/483/phpfpm_memory-month.png
Suggest going back to stock BOA and letting the cron jobs do their thing
I strongly disgree, I consider that all the evidence points to the 502s being causes by the cron job killing php-fpm and that if this cron job was reinstated then we would start seeing a lot of 502s again.
the 502s appear to have been caused by other issues (GEOS IP etc).
What "other issues" and what is "GEOS IP"?
comment:36 follow-up: ↓ 37 Changed 4 years ago by jim
Sigh... Here goes...
Re Killing PHP-FPM:
That decision was made by the BOA creators based on lots of experience, so I'm not going to second guess them. If you want to and disagree then that's your choice, but I would urge you to understand their reasons (beyond the risk of memory leaks).
I just want to point out that the 502s might have been caused by other issues I mentioned to you before (during a Skype I think): http://drupal.org/node/1913488 and http://drupal.org/node/1263602.
As an aside, you might want to check http://drupal.org/project/issues/barracuda occasionally to keep up to date with what's going on with the platform. I also follow the RSS from http://drupalcode.org/project/barracuda.git to keep up to date.
Re slow site:
I have no data to share, but it was VERY slow, taking ages to show pages and top showed a busy PHP-FPM task. Had Munin been working we would have had data.
Ed also complained of this on the call, but I'd never seen it until now.
That covers your points I think. I just want to say we have an update coming up for BOA 2.0.6 that includes fixes for the above issues and a bunch more stuff besides. I would like to make it clear that my position is we should aim for 'stock' where possible to avoid missing out on good stuff, and to avoid spending Transition's money on potentially unnecessary fixes.
We should try update out -- and try the FPM killing too -- then we will have all the information we need to raise a bug should the issue still arise. Else we might have been seeing manifestations of other issues since fixed that appear to be due to the FPM killer cron job.
I can't raise a sensible ticket until we've proven/disproven your theory against a clean base.
comment:37 in reply to: ↑ 36 ; follow-ups: ↓ 38 ↓ 41 Changed 4 years ago by chris
- Add Hours to Ticket changed from 0.0 to 1.1
- Total Hours changed from 10.25 to 11.35
sigh indeed -- I thought this issue was resolved, but it's back :-(
Replying to jim:
Re Killing PHP-FPM:
That decision was made by the BOA creators based on lots of experience, so I'm not going to second guess them. If you want to and disagree then that's your choice, but I would urge you to understand their reasons (beyond the risk of memory leaks).
I'd love to know the exact reasons, am I wrong in understanding that it was down to memory leaks? Can you point out where the BOA creators have documented the reasons for the killing of php-fpm?
I just want to point out that the 502s might have been caused by other issues I mentioned to you before (during a Skype I think): http://drupal.org/node/1913488
OK, we do have logs that indicate that the issue raised on that ticket is happening on the server:
grep " Aborted connection " /var/log/daemon.log
Mar 10 17:25:21 puffin mysqld: 130310 17:25:21 [Warning] Aborted connection 3885543 to db: 'transitionnetwor' user: 'transitionnetwor' host: 'localhost' (Unknown error)
Mar 10 17:25:31 puffin mysqld: 130310 17:25:31 [Warning] Aborted connection 3885595 to db: 'transitionnetwor' user: 'transitionnetwor' host: 'localhost' (Unknown error)
Mar 10 17:25:31 puffin mysqld: 130310 17:25:31 [Warning] Aborted connection 3885603 to db: 'transitionnetwor' user: 'transitionnetwor' host: 'localhost' (Unknown error)
Mar 10 17:25:31 puffin mysqld: 130310 17:25:31 [Warning] Aborted connection 3885606 to db: 'transitionnetwor' user: 'transitionnetwor' host: 'localhost' (Unknown error)
Mar 10 17:25:31 puffin mysqld: 130310 17:25:31 [Warning] Aborted connection 3885604 to db: 'transitionnetwor' user: 'transitionnetwor' host: 'localhost' (Unknown error)
Mar 10 17:25:31 puffin mysqld: 130310 17:25:31 [Warning] Aborted connection 3885601 to db: 'transitionnetwor' user: 'transitionnetwor' host: 'localhost' (Unknown error)
Mar 10 17:25:31 puffin mysqld: 130310 17:25:31 [Warning] Aborted connection 3885605 to db: 'transitionnetwor' user: 'transitionnetwor' host: 'localhost' (Unknown error)
Mar 10 17:25:46 puffin mysqld: 130310 17:25:46 [Warning] Aborted connection 3885698 to db: 'transitionnetwor' user: 'transitionnetwor' host: 'localhost' (Unknown error)
Mar 10 17:25:46 puffin mysqld: 130310 17:25:46 [Warning] Aborted connection 3885700 to db: 'transitionnetwor' user: 'transitionnetwor' host: 'localhost' (Unknown error)
Mar 10 17:25:46 puffin mysqld: 130310 17:25:46 [Warning] Aborted connection 3885695 to db: 'transitionnetwor' user: 'transitionnetwor' host: 'localhost' (Unknown error)
Mar 10 17:25:46 puffin mysqld: 130310 17:25:46 [Warning] Aborted connection 3885699 to db: 'transitionnetwor' user: 'transitionnetwor' host: 'localhost' (Unknown error)
Mar 11 03:16:14 puffin mysqld: 130311  3:16:14 [Warning] Aborted connection 3938842 to db: 'transitionnetwor' user: 'transitionnetwor' host: 'localhost' (Unknown error)
There are 45 502 errors that correspond to the above error on March 10th at 17:25 and one from March 11th at 03:16:
grep '1.[0|1]" 502 ' /var/log/nginx/access.log.1

"XX.XX.XX.XX, 127.0.0.1" www.transitionnetwork.org [10/Mar/2013:17:25:21 +0000] "GET /user/login HTTP/1.0" 502 166 747 311 "http://www.transitionnetwork.org/login" "Mozilla/5.0 (Windows NT 6.1; rv:17.0) Gecko/17.0 Firefox/17.0" 11.902 "-"
"XX.XX.XX.XX, 127.0.0.1" www.transitionnetwork.org [10/Mar/2013:17:25:21 +0000] "GET /user/login HTTP/1.0" 502 568 787 713 "http://www.transitionnetwork.org/login" "Mozilla/5.0 (Windows NT 5.1) AppleWebKit/536.11 (KHTML, like Gecko) Chrome/20.0.1132.57 Safari/536.11" 12.009 "-"
"XX.XX.XX.XX, 127.0.0.1" www.transitionnetwork.org [10/Mar/2013:17:25:21 +0000] "POST /node/23907/edit HTTP/1.0" 502 166 10553 311 "https://www.transitionnetwork.org/node/23907/edit" "Mozilla/5.0 (Windows NT 5.1; rv:19.0) Gecko/20100101 Firefox/19.0" 12.053 "-"
"XX.XX.XX.XX, 127.0.0.1" www.transitionnetwork.org [10/Mar/2013:17:25:21 +0000] "POST /user/login HTTP/1.0" 502 166 713 311 "http://www.transitionnetwork.org/user/login" "Opera/9.80 (Windows NT 6.1; Win64; x64) Presto/2.12.388 Version/12.11" 18.508 "-"
"XX.XX.XX.XX, 127.0.0.1" www.transitionnetwork.org [10/Mar/2013:17:25:21 +0000] "GET /blogs/feed/transition-us/2011 HTTP/1.0" 502 166 366 311 "-" "Mozilla/5.0 (compatible; AhrefsBot/4.0; +http://ahrefs.com/robot/)" 1.667 "-"
"XX.XX.XX.XX, 127.0.0.1" www.transitionnetwork.org [10/Mar/2013:17:25:21 +0000] "GET /node/add/forum HTTP/1.0" 502 568 798 713 "http://www.transitionnetwork.org/node/add/forum" "Mozilla/5.0 (Windows NT 5.1) AppleWebKit/535.2 (KHTML, like Gecko) Chrome/15.0.874.121 Safari/535.2" 19.549 "-"
"XX.XX.XX.XX, 127.0.0.1" www.transitionnetwork.org [10/Mar/2013:17:25:21 +0000] "GET /node/add/forum HTTP/1.0" 502 166 762 311 "http://www.transitionnetwork.org/node/add/forum" "Mozilla/5.0 (Windows NT 5.1; rv:8.0) Gecko/20100101 Firefox/8.0" 6.786 "-"
"XX.XX.XX.XX, 127.0.0.1" www.transitionnetwork.org [10/Mar/2013:17:25:21 +0000] "POST /user/login HTTP/1.0" 502 568 745 713 "http://www.transitionnetwork.org/user/login" "Mozilla/5.0 (Windows NT 6.1) AppleWebKit/537.11 (KHTML, like Gecko) Chrome/23.0.1271.95 Safari/537.11" 9.409 "-"
"XX.XX.XX.XX, 127.0.0.1" www.transitionnetwork.org [10/Mar/2013:17:25:21 +0000] "POST /user/login HTTP/1.0" 502 568 762 713 "http://www.transitionnetwork.org/user/login" "Mozilla/5.0 (Windows NT 6.1; WOW64) AppleWebKit/535.12 (KHTML, like Gecko) Maxthon/3.0 Chrome/18.0.966.0 Safari/535.12" 25.193 "-"
"XX.XX.XX.XX, 127.0.0.1" www.transitionnetwork.org [10/Mar/2013:17:25:21 +0000] "POST /user/login HTTP/1.0" 502 166 728 311 "http://www.transitionnetwork.org/user/login" "Opera/9.80 (Windows NT 5.1; U; MRA 6.0 (build 5970); ru) Presto/2.7.62 Version/11.00" 23.682 "-"
"XX.XX.XX.XX" www.transitionnetwork.org [10/Mar/2013:17:25:21 +0000] "GET /transition-movie HTTP/1.1" 502 166 410 311 "http://www.transitionnetwork.org/books" "Mozilla/5.0 (Macintosh; Intel Mac OS X 10_7_5) AppleWebKit/536.26.17 (KHTML, like Gecko) Version/6.0.2 Safari/536.26.17" 1.745 "-"
"XX.XX.XX.XX" chive.master.puffin.webarch.net [10/Mar/2013:17:25:21 +0000] "POST /index.php/schema/transitionnetwor/tables HTTP/1.1" 502 568 677 713 "http://chive.master.puffin.webarch.net/index.php/schema/transitionnetwor" "Mozilla/5.0 (X11; Linux x86_64) AppleWebKit/537.22 (KHTML, like Gecko) Chrome/25.0.1364.97 Safari/537.22" 12.133 "-"
"XX.XX.XX.XX" chive.master.puffin.webarch.net [10/Mar/2013:17:25:21 +0000] "POST /index.php/schema/transitionnetwor/tables/node/structure HTTP/1.1" 502 568 661 713 "http://chive.master.puffin.webarch.net/index.php/schema/transitionnetwor" "Mozilla/5.0 (X11; Linux x86_64) AppleWebKit/537.22 (KHTML, like Gecko) Chrome/25.0.1364.97 Safari/537.22" 12.155 "-"
"XX.XX.XX.XX" chive.master.puffin.webarch.net [10/Mar/2013:17:25:21 +0000] "POST /index.php/schema/transitionnetwor/views HTTP/1.1" 502 568 676 713 "http://chive.master.puffin.webarch.net/index.php/schema/transitionnetwor" "Mozilla/5.0 (X11; Linux x86_64) AppleWebKit/537.22 (KHTML, like Gecko) Chrome/25.0.1364.97 Safari/537.22" 12.119 "-"
"XX.XX.XX.XX" www.transitionnetwork.org [10/Mar/2013:17:25:21 +0000] "GET /transition-movie HTTP/1.0" 502 166 271 311 "-" "Mozilla/5.0 (Windows NT 6.1; WOW64; rv:14.0) Gecko/20100101 Firefox/14.0.1" 1.458 "-"
"XX.XX.XX.XX, 127.0.0.1" www.transitionnetwork.org [10/Mar/2013:17:25:21 +0000] "GET /forums/process/web-and-comms/eco-friendly-printing-and-print-manufacturers HTTP/1.0" 502 166 882 311 "http://www.transitionnetwork.org/forums/process/web-and-comms/eco-friendly-printing-and-print-manufacturers" "Mozilla/5.0 (Windows NT 5.1; rv:8.0) Gecko/20100101 Firefox/8.0" 0.001 "-"
"XX.XX.XX.XX, 127.0.0.1" www.transitionnetwork.org [10/Mar/2013:17:25:21 +0000] "GET /forum/recent HTTP/1.0" 502 166 764 311 "http://www.transitionnetwork.org/forum/recent" "Opera/9.80 (Windows NT 6.1; Win64; x64) Presto/2.12.388 Version/12.11" 0.001 "-"
"XX.XX.XX.XX" www.transitionnetwork.org [10/Mar/2013:17:25:21 +0000] "GET /people/nerissa-warren HTTP/1.1" 502 166 301 311 "-" "Mozilla/5.0 (compatible; bingbot/2.0; +http://www.bing.com/bingbot.htm)" 0.530 "-"
"XX.XX.XX.XX, 127.0.0.1" www.transitionnetwork.org [10/Mar/2013:17:25:21 +0000] "GET /user HTTP/1.0" 502 166 740 311 "http://www.transitionnetwork.org/user" "Mozilla/5.0 (Windows NT 6.1; rv:17.0) Gecko/17.0 Firefox/17.0" 0.001 "-"
"XX.XX.XX.XX, 127.0.0.1" www.transitionnetwork.org [10/Mar/2013:17:25:21 +0000] "GET /forum/recent HTTP/1.0" 502 568 813 713 "http://www.transitionnetwork.org/forum/recent" "Mozilla/5.0 (Windows NT 6.1; WOW64) AppleWebKit/535.12 (KHTML, like Gecko) Maxthon/3.0 Chrome/18.0.966.0 Safari/535.12" 0.001 "-"
"XX.XX.XX.XX, 127.0.0.1" www.transitionnetwork.org [10/Mar/2013:17:25:21 +0000] "GET /forum/recent HTTP/1.0" 502 568 796 713 "http://www.transitionnetwork.org/forum/recent" "Mozilla/5.0 (Windows NT 6.1) AppleWebKit/537.11 (KHTML, like Gecko) Chrome/23.0.1271.95 Safari/537.11" 0.002 "-"
"XX.XX.XX.XX, 127.0.0.1" www.transitionnetwork.org [10/Mar/2013:17:25:21 +0000] "GET /forum/recent HTTP/1.0" 502 166 779 311 "http://www.transitionnetwork.org/forum/recent" "Opera/9.80 (Windows NT 5.1; U; MRA 6.0 (build 5970); ru) Presto/2.7.62 Version/11.00" 0.002 "-"
"XX.XX.XX.XX, 127.0.0.1" www.transitionnetwork.org [10/Mar/2013:17:25:21 +0000] "GET /user HTTP/1.0" 502 568 780 713 "http://www.transitionnetwork.org/user" "Mozilla/5.0 (Windows NT 5.1) AppleWebKit/536.11 (KHTML, like Gecko) Chrome/20.0.1132.57 Safari/536.11" 0.015 "-"
"XX.XX.XX.XX, 127.0.0.1" www.transitionnetwork.org [10/Mar/2013:17:25:21 +0000] "GET /forums/process/web-and-comms/eco-friendly-printing-and-print-manufacturers HTTP/1.0" 502 568 918 713 "http://www.transitionnetwork.org/forums/process/web-and-comms/eco-friendly-printing-and-print-manufacturers" "Mozilla/5.0 (Windows NT 5.1) AppleWebKit/535.2 (KHTML, like Gecko) Chrome/15.0.874.121 Safari/535.2" 0.001 "-"
"XX.XX.XX.XX, 127.0.0.1" www.transitionnetwork.org [10/Mar/2013:17:25:21 +0000] "GET /forums/themes/local-economics/community-idea-needs-careful-exploration HTTP/1.0" 502 166 874 311 "http://www.transitionnetwork.org/forums/themes/local-economics/community-idea-needs-careful-exploration" "Mozilla/5.0 (Windows NT 5.1; rv:8.0) Gecko/20100101 Firefox/8.0" 0.001 "-"
"XX.XX.XX.XX, 127.0.0.1" www.transitionnetwork.org [10/Mar/2013:17:25:21 +0000] "GET /forum HTTP/1.0" 502 166 750 311 "http://www.transitionnetwork.org/forum" "Opera/9.80 (Windows NT 6.1; Win64; x64) Presto/2.12.388 Version/12.11" 0.001 "-"
"XX.XX.XX.XX, 127.0.0.1" www.transitionnetwork.org [10/Mar/2013:17:25:31 +0000] "GET /forums/process/researchers/collaborative-bibliography-academic-work-transition HTTP/1.0" 502 568 945 713 "http://www.transitionnetwork.org/forums/process/researchers/collaborative-bibliography-academic-work-transition" "Mozilla/5.0 (Windows NT 6.1; WOW64) AppleWebKit/535.12 (KHTML, like Gecko) Maxthon/3.0 Chrome/18.0.966.0 Safari/535.12" 3.382 "-"
"XX.XX.XX.XX, 127.0.0.1" www.transitionnetwork.org [10/Mar/2013:17:25:31 +0000] "GET /forum/recent HTTP/1.0" 502 568 796 713 "http://www.transitionnetwork.org/forum/recent" "Mozilla/5.0 (Windows NT 6.1) AppleWebKit/537.11 (KHTML, like Gecko) Chrome/23.0.1271.95 Safari/537.11" 1.880 "-"
"XX.XX.XX.XX, 127.0.0.1" www.transitionnetwork.org [10/Mar/2013:17:25:31 +0000] "GET /node/add/forum HTTP/1.0" 502 166 766 311 "http://www.transitionnetwork.org/node/add/forum" "Mozilla/5.0 (Windows NT 6.1; rv:9.0.1) Gecko/20100101 Firefox/9.0.1" 1.322 "-"
"XX.XX.XX.XX, 127.0.0.1" www.transitionnetwork.org [10/Mar/2013:17:25:31 +0000] "GET /index.php HTTP/1.0" 502 568 788 713 "http://www.transitionnetwork.org/index.php" "Mozilla/5.0 (Windows NT 5.1) AppleWebKit/535.2 (KHTML, like Gecko) Chrome/15.0.874.121 Safari/535.2" 0.813 "-"
"XX.XX.XX.XX, 127.0.0.1" www.transitionnetwork.org [10/Mar/2013:17:25:31 +0000] "GET /node/add/forum HTTP/1.0" 502 166 768 311 "http://www.transitionnetwork.org/node/add/forum" "Opera/9.80 (Windows NT 6.1; Win64; x64) Presto/2.12.388 Version/12.11" 0.982 "-"
"XX.XX.XX.XX, 127.0.0.1" www.transitionnetwork.org [10/Mar/2013:17:25:31 +0000] "GET /node/add/forum HTTP/1.0" 502 166 760 311 "http://www.transitionnetwork.org/node/add/forum" "Mozilla/5.0 (Windows NT 6.1; rv:17.0) Gecko/17.0 Firefox/17.0" 0.384 "-"
"XX.XX.XX.XX, 127.0.0.1" www.transitionnetwork.org [10/Mar/2013:17:25:31 +0000] "GET / HTTP/1.0" 502 166 748 311 "http://www.transitionnetwork.org/node/add/forum" "Mozilla/5.0 (Windows NT 5.1; rv:8.0) Gecko/20100101 Firefox/8.0" 0.594 "-"
"XX.XX.XX.XX, 127.0.0.1" www.transitionnetwork.org [10/Mar/2013:17:25:31 +0000] "GET /forums/process/researchers/collaborative-bibliography-academic-work-transition HTTP/1.0" 502 568 928 713 "http://www.transitionnetwork.org/forums/process/researchers/collaborative-bibliography-academic-work-transition" "Mozilla/5.0 (Windows NT 6.0) AppleWebKit/537.11 (KHTML, like Gecko) Chrome/23.0.1271.91 Safari/537.11" 0.000 "-"
"XX.XX.XX.XX, 127.0.0.1" www.transitionnetwork.org [10/Mar/2013:17:25:31 +0000] "GET /forums/process/web-and-comms/eco-friendly-printing-and-print-manufacturers HTTP/1.0" 502 166 880 311 "http://www.transitionnetwork.org/forums/process/web-and-comms/eco-friendly-printing-and-print-manufacturers" "Mozilla/5.0 (Windows NT 6.1; rv:17.0) Gecko/17.0 Firefox/17.0" 0.017 "-"
"XX.XX.XX.XX" www.transitionnetwork.org [10/Mar/2013:17:25:31 +0000] "GET /people/braziers HTTP/1.1" 502 166 376 311 "-" "Mozilla/5.0 (compatible; bingbot/2.0; +http://www.bing.com/bingbot.htm)" 0.833 "-"
"XX.XX.XX.XX, 127.0.0.1" www.transitionnetwork.org [10/Mar/2013:17:25:46 +0000] "GET /node/add/forum HTTP/1.0" 502 166 783 311 "http://www.transitionnetwork.org/node/add/forum" "Opera/9.80 (Windows NT 5.1; U; MRA 6.0 (build 5970); ru) Presto/2.7.62 Version/11.00" 0.525 "-"
"XX.XX.XX.XX, 127.0.0.1" www.transitionnetwork.org [10/Mar/2013:17:25:46 +0000] "GET /forums/process/researchers/collaborative-bibliography-academic-work-transition HTTP/1.0" 502 166 911 311 "http://www.transitionnetwork.org/forums/process/researchers/collaborative-bibliography-academic-work-transition" "Opera/9.80 (Windows NT 5.1; U; MRA 6.0 (build 5970); ru) Presto/2.7.62 Version/11.00" 0.000 "-"
"XX.XX.XX.XX, 127.0.0.1" www.transitionnetwork.org [10/Mar/2013:17:25:46 +0000] "GET /index.php HTTP/1.0" 502 568 790 713 "http://www.transitionnetwork.org/index.php" "Mozilla/5.0 (Windows NT 6.0) AppleWebKit/537.11 (KHTML, like Gecko) Chrome/23.0.1271.91 Safari/537.11" 0.001 "-"
"XX.XX.XX.XX, 127.0.0.1" www.transitionnetwork.org [10/Mar/2013:17:25:46 +0000] "GET /index.php HTTP/1.0" 502 568 807 713 "http://www.transitionnetwork.org/index.php" "Mozilla/5.0 (Windows NT 6.1; WOW64) AppleWebKit/535.12 (KHTML, like Gecko) Maxthon/3.0 Chrome/18.0.966.0 Safari/535.12" 0.001 "-"
"XX.XX.XX.XX, 127.0.0.1" www.transitionnetwork.org [10/Mar/2013:17:25:47 +0000] "GET /forums/process/web-and-comms/eco-friendly-printing-and-print-manufacturers HTTP/1.0" 502 166 903 311 "http://www.transitionnetwork.org/forums/process/web-and-comms/eco-friendly-printing-and-print-manufacturers" "Opera/9.80 (Windows NT 5.1; U; MRA 6.0 (build 5970); ru) Presto/2.7.62 Version/11.00" 0.001 "-"
"XX.XX.XX.XX, 127.0.0.1" www.transitionnetwork.org [10/Mar/2013:17:25:47 +0000] "GET /index.php HTTP/1.0" 502 166 756 311 "http://www.transitionnetwork.org/index.php" "Mozilla/5.0 (Windows NT 6.1; rv:9.0.1) Gecko/20100101 Firefox/9.0.1" 0.001 "-"
"XX.XX.XX.XX, 127.0.0.1" www.transitionnetwork.org [10/Mar/2013:17:25:47 +0000] "GET /forums/themes/local-economics/community-idea-needs-careful-exploration HTTP/1.0" 502 166 895 311 "http://www.transitionnetwork.org/forums/themes/local-economics/community-idea-needs-careful-exploration" "Opera/9.80 (Windows NT 5.1; U; MRA 6.0 (build 5970); ru) Presto/2.7.62 Version/11.00" 0.001 "-"
"XX.XX.XX.XX, 127.0.0.1" www.transitionnetwork.org [10/Mar/2013:17:25:47 +0000] "GET /forums/process/general/sailing-farm-tribe-transition-transport-tribe-tomorrow-tttt HTTP/1.0" 502 166 919 311 "http://www.transitionnetwork.org/forums/process/general/sailing-farm-tribe-transition-transport-tribe-tomorrow-tttt" "Opera/9.80 (Windows NT 5.1; U; MRA 6.0 (build 5970); ru) Presto/2.7.62 Version/11.00" 0.001 "-"
"XX.XX.XX.XX" www.transitionnetwork.org [10/Mar/2013:17:25:50 +0000] "GET /people/alistair-millar HTTP/1.1" 502 166 383 311 "-" "Mozilla/5.0 (compatible; bingbot/2.0; +http://www.bing.com/bingbot.htm)" 0.146 "-"
"XX.XX.XX.XX" www.transitionnetwork.org [11/Mar/2013:03:16:14 +0000] "GET /people/rachael-ludlow-williams HTTP/1.1" 502 166 460 311 "-" "Mozilla/5.0 (iPhone; U; CPU iPhone OS 4_1 like Mac OS X; en-us) AppleWebKit/532.9 (KHTML, like Gecko) Version/4.0.5 Mobile/8B117 Safari/6531.22.7 (compatible; Googlebot-Mobile/2.1; +http://www.google.com/bot.html)" 0.491 "-"
Jim you logged into the server at 17:24 on 10th March -- did you by any chance stop or restart the MySQL server? If you did then this would explain the 45 502s that happened within a minute of you sshing in.
There have been no 502 errors today but as documented above, 46 in yesterdays log, 2 the day before, one 5 days ago and 6 days ago, 19 seven days ago, 36 ten days ago, 4 eleven days ago, 2 fourteen days ago, one 16 days ago, 2 twenty one days ago.
Todays nginx log:
grep '1.[0|1]" 502 ' /var/log/nginx/access.log
Yesterdays log:
grep '1.[0|1]" 502 ' /var/log/nginx/access.log.1
The day before (gz'ed log file):
zgrep '1.[0|1]" 502 ' /var/log/nginx/access.log.2.gz
I have added a cronjob on puffin to email me the 502s from todays nginx access log every hour:
1 * * * * grep '1.[0|1]" 502 ' /var/log/nginx/access.log | mutt -s "502s errors from puffin" chris@webarchitects.co.uk
I can find no evidence that newrelic is installed on the server, what has this do to with the problem?
As an aside, you might want to check http://drupal.org/project/issues/barracuda occasionally to keep up to date with what's going on with the platform. I also follow the RSS from http://drupalcode.org/project/barracuda.git to keep up to date.
OK, thanks.
Re slow site:
I have no data to share, but it was VERY slow, taking ages to show pages and top showed a busy PHP-FPM task. Had Munin been working we would have had data.
Munin was working, as I said on the list it was moved to another server, I'll post to graphs to this ticket for the period 7th March to today.
Ed also complained of this on the call, but I'd never seen it until now.
Yes, but we need something concrete to work on don't we?
That covers your points I think. I just want to say we have an update coming up for BOA 2.0.6 that includes fixes for the above issues and a bunch more stuff besides. I would like to make it clear that my position is we should aim for 'stock' where possible to avoid missing out on good stuff, and to avoid spending Transition's money on potentially unnecessary fixes.
I don't have a problem with that.
If you read the comments above it is clear that there was an issue with the 502s that did appear to solved by the stopping of the php-fpm killing cron job -- the 502s did correspond to the times when the cron job was killing php-fpm. Now the 502s have started again, so this is now very much a critical issue again, in fact more critical than before as the site is now live.
We should try update out -- and try the FPM killing too -- then we will have all the information we need to raise a bug should the issue still arise. Else we might have been seeing manifestations of other issues since fixed that appear to be due to the FPM killer cron job.
I can't raise a sensible ticket until we've proven/disproven your theory against a clean base.
I'm not sure that a "clean base" is in this context, but I agree we can no longer blame the 502s on the php-fpm killing alone, however I still don't think we need to start killing php-fpm again -- what is the reason to kill it, when killing it results in 502s? What is the benefit?
Changed 4 years ago by chris
- Attachment multips_memory-week.png added
multips memory usage 7th to 11th March 2013
Changed 4 years ago by chris
- Attachment phpfpm_average-week.png added
phpfpm average process 7th to 11th March 2013
Changed 4 years ago by chris
- Attachment phpfpm_memory-week.png added
phpfpm memory usage 7th to 11th March 2013
comment:38 in reply to: ↑ 37 Changed 4 years ago by chris
- Add Hours to Ticket changed from 0.0 to 0.2
- Total Hours changed from 11.35 to 11.55
Replying to chris:
Munin was working, as I said on the list it was moved to another server, I'll post to graphs to this ticket for the period 7th March to today.
I have attached the graphs for 7th to 11th March 2013 and they do indicate that there was an issue with php-fpm memory usage growing for a 3 hour period on 10th March:
- https://tech.transitionnetwork.org/trac/attachment/ticket/483/multips_memory-week.png
- https://tech.transitionnetwork.org/trac/attachment/ticket/483/phpfpm_average-week.png
- https://tech.transitionnetwork.org/trac/attachment/ticket/483/phpfpm_memory-week.png
I don't know the cause of this memory usage spike. It is however a lot less dramatic when looked at in the context of the other main processes running on the server, so I don't know if it means much.
comment:39 follow-up: ↓ 40 Changed 4 years ago by chris
- Add Hours to Ticket changed from 0.0 to 0.25
- Total Hours changed from 11.55 to 11.8
There was one 502 last night, at 3:17am, served to a spambot:
"XX.XX.XX.XX" www.transitionnetwork.org [12/Mar/2013:03:17:20 +0000] "GET /user/register HTTP/1.1" 502 568 366 713 "-" "Mozilla/4.0 (compatible; MSIE 6.0; Windows NT 5.1; SV1)" 10.257 "-"
In /var/log/messages.1 there is this corresponding entry, the IP address matches the one in the Nginx log:
Mar  3 13:17:19 puffin drupal: http://www.transitionnetwork.org|1362316639|BOTCHA|XX.XX.XX.XX|http://www.transitionnetwork.org/user/register|http://www.transitionnetwork.org/user/register|0||user_register post blocked by BOTCHA: submission looks like from a spambot.Failed 4 of 5 recipes [honeypot, honeypot2, no_resubmit, obscure_url] from "default" recipe book.
Mar  3 13:17:19 puffin drupal: http://www.transitionnetwork.org|1362316639|spambot|XX.XX.XX.XX|http://www.transitionnetwork.org/user/register|http://www.transitionnetwork.org/user/register|0||Blocked registration: email=fashionzxv25@XX.XX,ip=XX.XX.XX.XX
It coincides with these !MySQL errors in /var/log/daemon.log:
Mar 12 03:17:20 puffin mysqld: 130312  3:17:20 [Warning] Aborted connection 4086920 to db: 'transitionnetwor' user: 'transitionnetwor' host: 'localhost' (Unknown error)
Mar 12 03:17:20 puffin mysqld: 130312  3:17:20 [Warning] Aborted connection 4086921 to db: 'transitionnetwor' user: 'transitionnetwor' host: 'localhost' (Unknown error)
Mar 12 03:17:20 puffin mysqld: 130312  3:17:20 [Warning] Aborted connection 4086922 to db: 'transitionnetwor' user: 'transitionnetwor' host: 'localhost' (Unknown error)
Mar 12 03:17:20 puffin mysqld: 130312  3:17:20 [Warning] Aborted connection 4086919 to db: 'transitionnetwor' user: 'transitionnetwor' host: 'localhost' (Unknown error)
This doesn't correspond with the nightly backup which happened at 1am last night.
It does correspond with a large load spike, I'll post the munin graphs of this to this ticket and link to them in the next comment.
Changed 4 years ago by chris
- Attachment mysql_queries-day_2013-03-12.png added
mysql spike 2013-03-12
Changed 4 years ago by chris
- Attachment phpfpm_connections-day_2013-03-12..png added
php-fpm spike 2013-03-12
comment:40 in reply to: ↑ 39 Changed 4 years ago by chris
- Add Hours to Ticket changed from 0.0 to 0.1
- Total Hours changed from 11.8 to 11.9
Replying to chris:
In /var/log/messages.1 there is this corresponding entry, the IP address matches the one in the Nginx log:
Mar  3 13:17:19 puffin drupal: http://www.transitionnetwork.org|1362316639|BOTCHA|XX.XX.XX.XX|http://www.transitionnetwork.org/user/register|http://www.transitionnetwork.org/user/register|0||user_register post blocked by BOTCHA: submission looks like from a spambot.Failed 4 of 5 recipes [honeypot, honeypot2, no_resubmit, obscure_url] from "default" recipe book.
Mar  3 13:17:19 puffin drupal: http://www.transitionnetwork.org|1362316639|spambot|XX.XX.XX.XX|http://www.transitionnetwork.org/user/register|http://www.transitionnetwork.org/user/register|0||Blocked registration: email=fashionzxv25@XX.XX,ip=XX.XX.XX.XX
Oops, the above was the same IP but the date was wrong, it does show it was a spambot but that request was on 3rd March 2013.
Load spike graphs:
- https://tech.transitionnetwork.org/trac/attachment/ticket/483/cpu-day_2013-03-12..png
- https://tech.transitionnetwork.org/trac/attachment/ticket/483/load-day_2013-03-12..png
- https://tech.transitionnetwork.org/trac/attachment/ticket/483/mysql_queries-day_2013-03-12.png
- https://tech.transitionnetwork.org/trac/attachment/ticket/483/phpfpm_connections-day_2013-03-12..png
I haven't tracked down the corresponding Nginx logs for this spike.
comment:41 in reply to: ↑ 37 ; follow-up: ↓ 44 Changed 4 years ago by jim
Replying to chris:
Re Killing PHP-FPM:
I'd love to know the exact reasons, am I wrong in understanding that it was down to memory leaks? Can you point out where the BOA creators have documented the reasons for the killing of php-fpm?
Not right now, but all the 'self-healing' scripts in /var/xdrago do things to generally keep servers serving pages. A zombie or hung or high-cpu FPM task would be killed by the cron jobs in this instance.
OK, we do have logs that indicate that the issue raised on that ticket is happening on the server:
<snip logs>
I've checked and the GEOS PHP extension is not installed, which is good because been marked experimental and removed from the default install, due to badness happening. That's that rules out for now...
However: What worries me is that the issue the person in the OP and comment 1 on the GEOS issue appears to have the same symptoms as us -- have you read that and followed the links, checked the screenshots?
So I'm thinking: either the GEOS thing is is masking another issue that BOA has but no-one is reporting as yet, OR we have something behaving like the same kind of thing -- a PHP extension (.so file) that is causing issues that crashes PHP, and sometimes database connections.
There are 45 502 errors that correspond to the above error on March 10th at 17:25 and one from March 11th at 03:16:
<snippedy>
Jim you logged into the server at 17:24 on 10th March -- did you by any chance stop or restart the MySQL server? If you did then this would explain the 45 502s that happened within a minute of you sshing in.
Nope, as outlined: I logged in, was sloooow, did some stuff, still slow. I did clear the Drupal caches a few times as part of the work I was doing, but didn't restart MySQL -- but I did restart php53-fpm per my earlier comment 34.
Obviously flushing the caches in Drupal will cause LOTS of transactions whist things get rebuilt, so that might explain the source of flurry of 502s/aborted connections if not the cause of the errors themselves.
I can find no evidence that newrelic is installed on the server, what has this do to with the problem?
It is on my server, got my wires crossed, no worries.
Actually that's a good point: New Relic gives you 2 weeks of 'full' reporting for free -- we might be able to use their analytics (that go far deeper than Munin and work with Drupal) to help root out the cause? We can always uninstall it when done.
...update coming up for BOA 2.0.6 that includes fixes for the above issues and a bunch more stuff besides...
I don't have a problem with that.
Ok, well we're just waiting on Omega8cc to finish up and release the next version of BOA.
If you read the comments above it is clear that there was an issue with the 502s that did appear to solved by the stopping of the php-fpm killing cron job -- the 502s did correspond to the times when the cron job was killing php-fpm. Now the 502s have started again, so this is now very much a critical issue again, in fact more critical than before as the site is now live.
I know, what a bummer.
I can't raise a sensible ticket until we've proven/disproven your theory against a clean base.
I'm not sure that a "clean base" is in this context, but I agree we can no longer blame the 502s on the php-fpm killing alone, however I still don't think we need to start killing php-fpm again -- what is the reason to kill it, when killing it results in 502s? What is the benefit?
I broadly agree, but it's clear the 502s are caused by something that is exacerbated by the PHP-FPM killing -- or maybe the re-spawning of the processes once killed. The point being that we've found another thing that generates them (clearing Drupal caches) and a thing that -- at least when I tried it -- stopped some of the errors (that was when I restarted the php53-fpm service.
All I can suggest is these:
- Wait for the next BOA version
- Keep a keener eye on this (you're now doing that via email, which is great)
- Raise an issue on the Barracuda issue tracker.
We're doing all these except the latter... Since we're still in this boat I'll be happy to raise a ticket tomorrow, BUT can I please ask that you try to summarise this ticket and your findings to date in a paragraph or two? That would be really handy as I know what I've seen, but you've tried other stuff... I'll then add to your outline and post in the issue queue with all the appropriate files, and a link to this page as a source further information.
Finally, when logged in to Drupal as an admin/developer the phpinfo() page shows the extensions loaded and versions from the Drupal PHP context... It's a big job but looking these up and comparing their versions to known bugs might get us somewhere... This is a back burner thing I guess.
comment:42 follow-up: ↓ 45 Changed 4 years ago by jim
OK so MariaDB 5.5.30 has finally been released and committed to Barracuda, so we're due a release any day now as that was a blocker...
I am going to go out on a limb, but based on the OP in the GEOS issue, I reckon this might be the solution to our pain -- it's also the only thing that didn't get updated by the up-head I did.
Fingers crossed.
comment:43 Changed 4 years ago by chris
- Add Hours to Ticket changed from 0.0 to 0.25
- Total Hours changed from 11.9 to 12.15
I'll try to spend some time tomorrow addressing the points raised by Jim in ticket:483#comment:41 and ticket:483#comment:42
There was one 502 last night, at 3:16 am served to bingbot:
"157.56.93.216" www.transitionnetwork.org [14/Mar/2013:03:16:39 +0000] "GET /initiatives/honiton HTTP/1.1" 502 166 299 311 "-" "Mozilla/5.0 (compatible; bingbot/2.0; +http://www.bing.com/bingbot.htm)" 4.335 "-"
I need to write a small script so that I only get a email about a 502 when there is one to save having to check the email that is being sent ever hour even when there are none.
comment:44 in reply to: ↑ 41 Changed 4 years ago by chris
- Add Hours to Ticket changed from 0.0 to 0.35
- Total Hours changed from 12.15 to 12.5
Replying to jim:
A zombie or hung or high-cpu FPM task would be killed by the cron jobs in this instance.
But we haven't had an issue like this, look at the stats:
- https://penguin.transitionnetwork.org/munin/transitionnetwork.org/puffin.transitionnetwork.org/index.html#php
- https://penguin.transitionnetwork.org/munin/transitionnetwork.org/puffin.transitionnetwork.org/multips_memory.html
There is no sign of a php-fpm process that has needed killing.
However: What worries me is that the issue the person in the OP and comment 1 on the GEOS issue appears to have the same symptoms as us -- have you read that and followed the links, checked the screenshots?
I don't see what this has to do with us -- his server ran out of memory and stopped working as far as I can see. This isn't something we need to worry about, we are not running out of memory:
So I'm thinking: either the GEOS thing is is masking another issue that BOA has but no-one is reporting as yet, OR we have something behaving like the same kind of thing -- a PHP extension (.so file) that is causing issues that crashes PHP, and sometimes database connections.
What evidence is there that anything like this is happening?
Jim you logged into the server at 17:24 on 10th March -- did you by any chance stop or restart the MySQL server? If you did then this would explain the 45 502s that happened within a minute of you sshing in.
Nope, as outlined: I logged in, was sloooow, did some stuff, still slow. I did clear the Drupal caches a few times as part of the work I was doing, but didn't restart MySQL -- but I did restart php53-fpm per my earlier comment 34.
I think the 502s were caused by you restarting php53-fpm.
Actually that's a good point: New Relic gives you 2 weeks of 'full' reporting for free -- we might be able to use their analytics (that go far deeper than Munin and work with Drupal) to help root out the cause? We can always uninstall it when done.
I don't see the point -- I don't think we have an issue.
I broadly agree, but it's clear the 502s are caused by something that is exacerbated by the PHP-FPM killing -- or maybe the re-spawning of the processes once killed. The point being that we've found another thing that generates them (clearing Drupal caches) and a thing that -- at least when I tried it -- stopped some of the errors (that was when I restarted the php53-fpm service.
I think the 502s happen either when the database or php-fpm isn't running and it's as simple as that.
All I can suggest is these:
- Wait for the next BOA version
- Keep a keener eye on this (you're now doing that via email, which is great)
- Raise an issue on the Barracuda issue tracker.
We're doing all these except the latter... Since we're still in this boat I'll be happy to raise a ticket tomorrow, BUT can I please ask that you try to summarise this ticket and your findings to date in a paragraph or two? That would be really handy as I know what I've seen, but you've tried other stuff... I'll then add to your outline and post in the issue queue with all the appropriate files, and a link to this page as a source further information.
In a nutshell: When php-fpm is killed we get 502 errors from Nginx. So we disabled php-fpm being killed and the 502 stopped.
comment:45 in reply to: ↑ 42 Changed 4 years ago by chris
- Add Hours to Ticket changed from 0.0 to 0.5
- Total Hours changed from 12.5 to 13.0
Replying to jim:
OK so MariaDB 5.5.30 has finally been released and committed to Barracuda, so we're due a release any day now as that was a blocker...
I am going to go out on a limb, but based on the OP in the GEOS issue, I reckon this might be the solution to our pain -- it's also the only thing that didn't get updated by the up-head I did.
Yeah, could be, the last 502, ticket:483#comment:43 does have a corresponding entry in /var/log/daemon.log:
Mar 14 03:16:39 puffin mysqld: 130314  3:16:39 [Warning] Aborted connection 194223 to db: 'transitionnetwor' user: 'transitionnetwor' host: 'localhost' (Unknown error)
Mar 14 03:16:39 puffin mysqld: 130314  3:16:39 [Warning] Aborted connection 194222 to db: 'transitionnetwor' user: 'transitionnetwor' host: 'localhost' (Unknown error)
comment:46 Changed 4 years ago by chris
- Add Hours to Ticket changed from 0.0 to 0.3
- Total Hours changed from 13.0 to 13.3
Draft summary of the 502 issue for raising with the BOA developers:
HTTP 502 Errors
We have a Drupal site running via BOA at http://www.transitionnetwork.org/ on a virtual debian machine with 14 CPU cores and 4GB of RAM (munin stats for it are here: https://penguin.transitionnetwork.org/munin/transitionnetwork.org/puffin.transitionnetwork.org/ ).
We appear have two issues causing Nginx to serve 502 error messages to clients, one being caused by occasional (only a handful a week) MariaDB "Aborted connection" errors, which leave messages like this in /var/log/daemon.log:
Mar 14 03:16:39 puffin mysqld: 130314  3:16:39 [Warning] Aborted connection 194223 to db: 'transitionnetwor' user: 'transitionnetwor' host: 'localhost' (Unknown error)
Mar 14 03:16:39 puffin mysqld: 130314  3:16:39 [Warning] Aborted connection 194222 to db: 'transitionnetwor' user: 'transitionnetwor' host: 'localhost' (Unknown error)
Which correspond with 502 errors from Ngnix, the one that corresponds with the above error:
"157.56.93.216" www.transitionnetwork.org [14/Mar/2013:03:16:39 +0000] "GET /initiatives/honiton HTTP/1.1" 502 166 299 311 "-" "Mozilla/5.0 (compatible; bingbot/2.0; +http://www.bing.com/bingbot.htm)" 4.335 "-"
The other cause of huge number of 502 errors was the cron job that runs /var/xdrago/clear.sh which kills php-fpm on a regular basis -- we found that while it was being killed clients were served 502 errors by Ngnix. We have therefore commented out the cron job that runs /var/xdrago/clear.sh and we can't see any evidence of php-fpm having memory leaks and have no evidence of negative side effects caused by the removal of the cron job. The php-fpm munin stats for the server are here:
- https://penguin.transitionnetwork.org/munin/transitionnetwork.org/puffin.transitionnetwork.org/#php
And the total memory usage of php-fpm can be seen in this graph:
Further detail of these issues are documented on this ticket: /trac/ticket/483
comment:47 Changed 4 years ago by chris
- Add Hours to Ticket changed from 0.0 to 0.25
- Total Hours changed from 13.3 to 13.55
I have written a small bash script which can be run on the command line to display recent 502 errors:
/usr/local/bin/find-502s
  No recent 502 errors were found
And run via cron with a email address to send the result to.
This is the script:
#!/bin/bash

EMAIL=$1

GREP_NGINX=$(grep '1.[0|1]" 502 ' /var/log/nginx/access.log)

# check that the script is being run by root
if [[ "$(id -u)" != "0" ]] ; then
  echo "You must run $0 as root or via sudo"
  exit 2
fi

# check to see if any 502s were found
if [[ $GREP_NGINX ]]; then
  # check for a email address
  if [[ $1 ]]; then
    echo $GREP_NGINX | mutt -s "502 errors from puffin" $EMAIL
  # display the results of the grep
  else [[ ! $1 ]]
    echo "Supply a email address on the command line to send the following results by email"
    echo ""
    echo $GREP_NGINX
  fi
else
   # we don't want any output if a email address is specified as the script is run via cron
   if [[ ! $EMAIL ]] ; then
     echo "No recent 502 errors were found"
   fi
fi
comment:48 Changed 4 years ago by chris
- Add Hours to Ticket changed from 0.0 to 0.25
- Total Hours changed from 13.55 to 13.8
There was another 502 last night, again at 3:17 am:
"117.26.254.40" www.transitionnetwork.org [19/Mar/2013:03:17:02 +0000] "GET /user/login HTTP/1.1" 502 568 259 713 "http://www.transitionnetwork.org/" "Mozilla/4.0 (compatible; MSIE 6.0; Windows NT 5.1; SV1;)" 0.389 "-"
The IP address is from China and all that this this bot, which is pretending to be IE6, has done the the last 4 days is make 14 GET requests for /user/login and 16 POST requests to /
This time there were not corresponding MySQL entries in the daemon.log.
I think it's worth noting the times:
- 03:17:02 ticket:483#comment:48
- 03:16:39 ticket:483#comment:43 and ticket:483#comment:45
- 03:17:20 ticket:483#comment:39
I'd guess there is some MySQL related task that runs at this time?
comment:49 Changed 4 years ago by chris
- Add Hours to Ticket changed from 0.0 to 0.65
- Total Hours changed from 13.8 to 14.45
There were two 502 errors last night, both at exactly the same time, both on Port 80 and both from the the same Russian IP address, one request pretending to be Opera and one pretending to be Firefox.
Again this was a spam bot -- this IP address has posted 123 registration attempts to the site today so far.
"31.192.104.144, 127.0.0.1" www.transitionnetwork.org [21/Mar/2013:03:16:56 +0000] "GET /index.php HTTP/1.0" 502 166 757 311 "http://www.transitionnetwork.org/index.php" "Opera/9.80 (Windows NT 6.2; U; en) Presto/2.10.289 Version/12.02" 0.604 "-"
"31.192.104.144, 127.0.0.1" www.transitionnetwork.org [21/Mar/2013:03:16:56 +0000] "GET / HTTP/1.0" 502 166 761 311 "http://www.transitionnetwork.org/node/add/forum" "Mozilla/5.0 (Windows NT 6.1; WOW64; rv:17.0) Gecko/20100101 Firefox/17.0" 0.625 "-"
These are some of the logs from around the same time in /var/log/daemon.log:
Mar 21 03:16:56 puffin mysqld: 130321  3:16:56 [Warning] Aborted connection 1169164 to db: 'transitionnetwor' user: 'transitionnetwor' host: 'localhost' (Unknown error)
Mar 21 03:16:56 puffin mysqld: 130321  3:16:56 [Warning] Aborted connection 1169163 to db: 'transitionnetwor' user: 'transitionnetwor' host: 'localhost' (Unknown error)
And this is a selection of a few of the 606 entries from this IP address in /var/log/messages from around the same time:
Mar 21 03:16:38 puffin drupal: https://www.transitionnetwork.org|1363835798|BOTCHA|31.192.104.144|https://www.transitionnetwork.org/user/register|http://www.transitionnetwork.org/user/register|0||user_register post blocked by BOTCHA: submission looks like from a spambot.Failed 4 of 5 recipes [honeypot, honeypot2, obscure_url, timegate] from "default" recipe book.
Mar 21 03:16:38 puffin drupal: https://www.transitionnetwork.org|1363835798|spambot|31.192.104.144|https://www.transitionnetwork.org/user/register|http://www.transitionnetwork.org/user/register|0||Blocked registration: email=beardjfg@outlook.com,ip=31.192.104.144
Mar 21 03:16:42 puffin drupal: https://www.transitionnetwork.org|1363835802|BOTCHA|31.192.104.144|https://www.transitionnetwork.org/user/register|http://www.transitionnetwork.org/user/register|0||user_register post blocked by BOTCHA: submission looks like from a spambot.Failed 4 of 5 recipes [honeypot, honeypot2, obscure_url, timegate] from "default" recipe book.
Mar 21 03:16:42 puffin drupal: https://www.transitionnetwork.org|1363835802|spambot|31.192.104.144|https://www.transitionnetwork.org/user/register|http://www.transitionnetwork.org/user/register|0||Blocked registration: email=beardjfg@outlook.com,ip=31.192.104.144
Mar 21 03:16:47 puffin drupal: https://www.transitionnetwork.org|1363835807|user|31.192.104.144|https://www.transitionnetwork.org/user|http://www.transitionnetwork.org/user|0||Login attempt failed for Spoonsody.
Mar 21 03:16:50 puffin drupal: https://www.transitionnetwork.org|1363835810|user|31.192.104.144|https://www.transitionnetwork.org/user|http://www.transitionnetwork.org/user|0||Login attempt failed for Spoonsody.
Mar 21 03:16:51 puffin drupal: http://www.transitionnetwork.org|1363835811|access denied|31.192.104.144|http://www.transitionnetwork.org/node/add/forum|http://www.transitionnetwork.org/node/add/forum|0||node/add/forum
Mar 21 03:16:52 puffin drupal: https://www.transitionnetwork.org|1363835812|access denied|31.192.104.144|https://www.transitionnetwork.org/node/add/forum|http://www.transitionnetwork.org/node/add/forum|0||node/add/forum
Mar 21 03:16:54 puffin drupal: http://www.transitionnetwork.org|1363835814|access denied|31.192.104.144|http://www.transitionnetwork.org/node/add/forum|http://www.transitionnetwork.org/node/add/forum|0||node/add/forum
Mar 21 03:16:55 puffin drupal: https://www.transitionnetwork.org|1363835815|access denied|31.192.104.144|https://www.transitionnetwork.org/node/add/forum|http://www.transitionnetwork.org/node/add/forum|0||node/add/forum
Again the 502s happened at the same time as usual, these are the 4 times in the last 10 days there have been 502 errors:
- 2013-03-21 03:16:56 ticket:483#comment:49
- 2013-03-19 03:17:02 ticket:483#comment:48
- 2013-03-14 03:16:39 ticket:483#comment:43 and ticket:483#comment:45
- 2013-03-12 03:17:20 ticket:483#comment:39
There is a page on the MySQL site, Communication Errors and Aborted Connections which lists a number of reasons for this error and also points out that "the server increments the Aborted_clients status variable" -- we are at 1,169,164!
As we are only seeing one or two 502 a night, every few days and always between 3:16:30 am and 3:17:30 am and generally these are served up to spam bots I'm not sure this issue is worth spending much more time on?
I have checked for cron jobs that run at this time in /etc/cron.d/ but there are none, I don't know why these errors only happen at this time.
comment:50 Changed 4 years ago by chris
- Add Hours to Ticket changed from 0.0 to 0.1
- Total Hours changed from 14.45 to 14.55
There was a pair of 502 error's served up to a couple of bots last night:
"86.48.79.199, 127.0.0.1" transitionnetwork.org [24/Mar/2013:03:16:37 +0000] "GET /training/sponsoring HTTP/1.0" 502 166 354 311 "-" "Riddler (http://riddler.io/about.html)" 0.526 "-"
"180.76.5.151" www.transitionnetwork.org [24/Mar/2013:03:16:37 +0000] "GET /events/ HTTP/1.1" 502 166 234 311 "-" "Mozilla/5.0 (compatible; Baiduspider/2.0; +http://www.baidu.com/search/spider.html)" 1.133 "-"
These are corresponding /var/log/daemon.log entries:
Mar 24 03:16:37 puffin mysqld: 130324  3:16:37 [Warning] Aborted connection 1601751 to db: 'transitionnetwor' user: 'transitionnetwor' host: 'localhost' (Unknown error)
Mar 24 03:16:37 puffin mysqld: 130324  3:16:37 [Warning] Aborted connection 1601752 to db: 'transitionnetwor' user: 'transitionnetwor' host: 'localhost' (Unknown error)
Updating the list of recent 502 errors:
- 2013-03-24 03:16:37 ticket:483#comment:50
- 2013-03-21 03:16:56 ticket:483#comment:49
- 2013-03-19 03:17:02 ticket:483#comment:48
- 2013-03-14 03:16:39 ticket:483#comment:43 and ticket:483#comment:45
- 2013-03-12 03:17:20 ticket:483#comment:39
comment:51 Changed 4 years ago by chris
- Add Hours to Ticket changed from 0.0 to 0.1
- Total Hours changed from 14.55 to 14.65
There was a 502 last night served up to a real person in the USA:
"XX.XX.XX.XX" www.transitionnetwork.org [26/Mar/2013:03:16:52 +0000] "GET /initiatives?page=2&themes=13&community_type=All&status_value=All&country=us&field_title_search= HTTP/1.1" 502 166 629 311 "http://www.transitionnetwork.org/initiatives?page=1&themes=13&community_type=All&status_value=All&country=us&field_title_search=" "Mozilla/5.0 (Macintosh; Intel Mac OS X 10.5; rv:16.0) Gecko/20100101 Firefox/16.0" 1.175 "-"
The corresponding /var/log/daemon.log entries:
Mar 26 03:16:52 puffin mysqld: 130326  3:16:52 [Warning] Aborted connection 1874815 to db: 'transitionnetwor' user: 'transitionnetwor' host: 'localhost' (Unknown error)
Mar 26 03:16:52 puffin mysqld: 130326  3:16:52 [Warning] Aborted connection 1874816 to db: 'transitionnetwor' user: 'transitionnetwor' host: 'localhost' (Unknown error)
Updating the list of recent 502 errors:
- 2013-03-26 03:16:52 ticket:483#comment:51
- 2013-03-24 03:16:37 ticket:483#comment:50
- 2013-03-21 03:16:56 ticket:483#comment:49
- 2013-03-19 03:17:02 ticket:483#comment:48
- 2013-03-14 03:16:39 ticket:483#comment:43 and ticket:483#comment:45
- 2013-03-12 03:17:20 ticket:483#comment:39
comment:52 Changed 4 years ago by chris
- Add Hours to Ticket changed from 0.0 to 0.1
- Total Hours changed from 14.65 to 14.75
Upgrading php-fpm, see ticket:218#comment:72, required a restart of php-fpm and during the restart these 502 errors were served to 4 different clients, at least two of these were bots:
"AAA.AAA.AAA.AAA" www.transitionnetwork.org [26/Mar/2013:12:46:45 +0000] "GET /training/courses HTTP/1.1" 502 166 367 311 "http://www.transitionnetwork.org/deepening" "Mozilla/5.0 (Windows NT 6.1; WOW64; rv:19.0) Gecko/20100101 Firefox/19.0" 0.035 "-"
"BB.BB.BBB.BBB" www.transitionnetwork.org [26/Mar/2013:12:46:46 +0000] "GET /resources/all?stage_nid=All&themes=All&language=es&country=All&asset_type=All&keywords= HTTP/1.1" 502 568 407 713 "-" "Mozilla/4.0 (compatible; MSIE 7.0; Windows NT 6.1; WOW64; Trident/5.0; SLCC2; .NET CLR 2.0.50727; .NET CLR 3.5.30729; .NET CLR 3.0.30729; Media Center PC 6.0; MALN; .NET4.0C; InfoPath.2)" 0.105 "-"
"CCC.CCC.CCC.CC" www.transitionnetwork.org [26/Mar/2013:12:46:46 +0000] "GET /news/2011-05-24/transitioner-selected-yellow-pages-cover HTTP/1.1" 502 166 222 311 "-" "ichiro/3.0 (http://help.goo.ne.jp/door/crawler.html)" 0.299 "-"
"DDD.DD.DD.DDD" www.transitionnetwork.org [26/Mar/2013:12:46:48 +0000] "GET /tags/community-supported-agriculture HTTP/1.1" 502 166 368 311 "-" "Mozilla/5.0 (compatible; bingbot/2.0; +http://www.bing.com/bingbot.htm)" 0.152 "-"
"86.48.79.199, 127.0.0.1" transitionnetwork.org [26/Mar/2013:12:46:51 +0000] "GET /user/login?destination=users/javier-guerrero HTTP/1.0" 502 166 379 311 "-" "Riddler (http://riddler.io/about.html)" 0.001 "-"
comment:53 Changed 4 years ago by chris
- Add Hours to Ticket changed from 0.0 to 0.1
- Total Hours changed from 14.75 to 14.85
There were two 502 errors served up to bots last night:
"86.48.79.199" transitionnetwork.org [29/Mar/2013:03:18:59 +0000] "GET /media/%22/people/peter-aston/%22/u003ePeter?page=8&order=name&sort=asc HTTP/1.0" 502 166 267 311 "-" "Riddler (http://riddler.io/about.html)" 0.199 "-"
"95.108.247.253" www.transitionnetwork.org [29/Mar/2013:03:18:59 +0000] "GET /initiatives/marlborough HTTP/1.1" 502 166 363 311 "-" "Mozilla/5.0 (compatible; YandexBot/3.0; +http://yandex.com/bots)" 1.645 "-"
These were a bit later than usual time -- the server clock was out by several minutes so I installed ntp, see ticket:466#comment:78.
The corresponding /var/log/daemon.log entries:
Mar 29 03:18:59 puffin mysqld: 130329  3:18:59 [Warning] Aborted connection 2370670 to db: 'transitionnetwor' user: 'transitionnetwor' host: 'localhost' (Unknown error)
Mar 29 03:18:59 puffin mysqld: 130329  3:18:59 [Warning] Aborted connection 2370672 to db: 'transitionnetwor' user: 'transitionnetwor' host: 'localhost' (Unknown error)
The updated list of recent 502s which were not caused by things like php-fpm updates and manual restarts:
- 2013-03-29 03:18:59 ticket:483#comment:53
- 2013-03-26 03:16:52 ticket:483#comment:51
- 2013-03-24 03:16:37 ticket:483#comment:50
- 2013-03-21 03:16:56 ticket:483#comment:49
- 2013-03-19 03:17:02 ticket:483#comment:48
- 2013-03-14 03:16:39 ticket:483#comment:43 and ticket:483#comment:45
- 2013-03-12 03:17:20 ticket:483#comment:39
comment:54 Changed 4 years ago by chris
- Add Hours to Ticket changed from 0.0 to 0.1
- Total Hours changed from 14.85 to 14.95
The upgrade to the latest BOA, ticket:529 has resulted in the script which clobbers log files and restarts php-fpm being re-enabled, it's run via the root crontab at 11 mins past the hour:
11 * * * * bash /var/xdrago/clear.sh >/dev/null 2>&1
It contains:
#!/bin/bash

SHELL=/bin/bash
PATH=/usr/local/sbin:/usr/local/bin:/opt/local/bin:/usr/sbin:/usr/bin:/sbin:/bin

touch /var/run/fmp_wait.pid
if [ -e "/etc/cron.daily/logrotate" ] ; then
  _SYSLOG_SIZE_TEST=$(du -s -h /var/log/syslog)
  if [[ "$_SYSLOG_SIZE_TEST" =~ "G" ]] ; then
    echo $_SYSLOG_SIZE_TEST too big
    bash /etc/cron.daily/logrotate
    echo system logs rotated
  fi
fi
echo rotate > /var/log/php/php-fpm-error.log
echo rotate > /var/log/php/php-fpm-slow.log
echo rotate > /var/log/php/php53-fpm-error.log
echo rotate > /var/log/php/php53-fpm-slow.log
echo rotate > /var/log/php/error_log_52
echo rotate > /var/log/php/error_log_53
echo rotate > /var/log/php/error_log_cli_52
echo rotate > /var/log/php/error_log_cli_53
echo rotate > /var/log/redis/redis-server.log
echo rotate > /var/log/mysql/sql-slow-query.log
if test -f /root/.high_traffic.cnf ; then
  echo rotate > /var/log/nginx/access.log
else
  /etc/init.d/php53-fpm reload
  if test -f /etc/init.d/php-fpm ; then
    /etc/init.d/php-fpm reload
  fi
  sleep 8
fi
if test -f /var/run/boa_run.pid ; then
  sleep 1
else
  rm -f /tmp/*error*
fi
rm -f /var/run/fmp_wait.pid
touch /var/xdrago/log/clear.done
###EOF2013###
If the restart of php-fpm that it'll do in 10 mins time caused any 502 errors I'm going to disable this cronjob again.
comment:55 Changed 4 years ago by chris
- Add Hours to Ticket changed from 0.0 to 0.2
- Total Hours changed from 14.95 to 15.15
There were no 502's at 9:11pm so I'm leaving the script in place for now.
comment:56 Changed 4 years ago by chris
- Add Hours to Ticket changed from 0.0 to 0.25
- Total Hours changed from 15.15 to 15.4
There was a 502 served to a Chinese dynamic IP address at 07:11:04 am pretending to be IE6, I expect it was a spambot, it was in response to a registration POST:
"117.26.XX.XX" www.transitionnetwork.org [08/Apr/2013:07:11:04 +0100] "POST /user/register HTTP/1.1" 502 568 1289 713 "http://www.transitionnetwork.org/user/register" "Mozilla/4.0 (compatible; MSIE 6.0; Windows NT 5.1; SV1;)" 3.479 "-"
This means that the cronjob running /var/xdrago/clear.sh at 11 mins past the hour is, once again, causing clients to get 502 errors when it kills php-fpm, so I have commented it out or root crontab:
#11 * * * * bash /var/xdrago/clear.sh >/dev/null 2>&1
This will need re-commenting after the upgrade to BOA-2.0.8 on ticket:530 and I have added this task to the BOA upgrade process documneted here wiki:PuffinServer#UpgradingBOA.
comment:57 Changed 4 years ago by chris
- Add Hours to Ticket changed from 0.0 to 0.1
- Total Hours changed from 15.4 to 15.5
The cronjob to run the script to find 502 errors (see ticket:483#comment:47) and send them out by email got clobbered in a BOA upgrade, so I have now added it to the pre-rotation task in /etc/logrotate.d/nginx:
/var/log/nginx/*.log {
        daily
        missingok
        rotate 52
        compress
        delaycompress
        notifempty
        create 0640 www-data adm
        sharedscripts
        prerotate
                /usr/local/bin/find-502s chris@webarchitects.co.uk
                if [ -d /etc/logrotate.d/httpd-prerotate ]; then \
                        run-parts /etc/logrotate.d/httpd-prerotate; \
                fi \
        endscript
        postrotate
                [ ! -f /var/run/nginx.pid ] || kill -USR1 `cat /var/run/nginx.pid`
        endscript
}
comment:58 Changed 4 years ago by chris
- Add Hours to Ticket changed from 0.0 to 0.35
- Total Hours changed from 15.5 to 15.85
The 502 errors that were happening between 3:16am and 3:19am, see ticket:483#comment:53 are now happening at 19 mins past midnight (apart from one case at 9pm):
9th April 00:19:07
Apache errors:
"192.XX.XXX.XX" www.transitionnetwork.org [11/Apr/2013:00:19:07 +0100] "GET /user/register HTTP/1.0" 502 568 507 713 "http://www.transitionnetwork.org/user/register" "Mozilla/5.0 (Windows NT 6.0; WOW64) AppleWebKit/537.11 (KHTML, like Gecko) Chrome/23.0.1271.64 Safari/537.11" 0.193 "-"
"66.249.XX.XXX" www.transitionnetwork.org [11/Apr/2013:00:19:07 +0100] "GET /tags/stop-shopping HTTP/1.1" 502 166 307 311 "-" "Mozilla/5.0 (compatible; Googlebot/2.1; +http://www.google.com/bot.html)" 0.528 "-"
The corresponding MariaDB error from the daemon.log:
Apr 11 00:19:07 puffin mysqld: 130411 0:19:07 [Warning] Aborted connection 341263 to db: 'transitionnetwor' user: 'transitionnetwor' host: 'localhost' (Unknown error)
12th April 21:00:32
Apache error:
"XXX.X.XXX.X" www.transitionnetwork.org [11/Apr/2013:21:00:32 +0100] "GET /forums/process/researchers/collaborative-bibliography-academic-work-transition HTTP/1.0" 502 568 778 713 "http://www.transitionnetwork.org/forums/process/researchers/collaborative-bibliography-academic-work-transition" "Mozilla/5.0 (Windows NT 6.2; WOW64) AppleWebKit/537.11 (KHTML, like Gecko) Chrome/23.0.1271.95 Safari/537.11" 0.146 "-"
The corresponding MariaDB errors:
Apr 11 21:00:19 puffin mysqld: 130411 21:00:19 [Warning] Aborted connection 499168 to db: 'transitionnetwor' user: 'transitionnetwor' host: 'localhost' (Unknown error)
Apr 11 21:00:19 puffin mysqld: 130411 21:00:19 [Warning] Aborted connection 499172 to db: 'transitionnetwor' user: 'transitionnetwor' host: 'localhost' (Unknown error)
Apr 11 21:00:19 puffin mysqld: 130411 21:00:19 [Warning] Aborted connection 499170 to db: 'transitionnetwor' user: 'transitionnetwor' host: 'localhost' (Unknown error)
Apr 11 21:00:19 puffin mysqld: 130411 21:00:19 [Warning] Aborted connection 499147 to db: 'transitionnetwor' user: 'transitionnetwor' host: 'localhost' (Unknown error)
Apr 11 21:00:19 puffin mysqld: 130411 21:00:19 [Warning] Aborted connection 499146 to db: 'transitionnetwor' user: 'transitionnetwor' host: 'localhost' (Unknown error)
13th April 00:19:06
Apache error:
"XX.XXX.XX.XX, 127.0.0.1" www.transitionnetwork.org [13/Apr/2013:00:19:06 +0100] "GET /forums/process/general/list-ideas-starting-transition HTTP/1.0" 502 166 838 311 "http://www.transitionnetwork.org/forums/process/general/list-ideas-starting-transition" "Mozilla/5.0 (Windows NT 5.2; rv:17.0) Gecko/17.0 Firefox/17.0" 1.273 "-"
MariaDB error:
Apr 13 00:19:06 puffin mysqld: 130413 0:19:06 [Warning] Aborted connection 678014 to db: 'transitionnetwor' user: 'transitionnetwor' host: 'localhost' (Unknown error)
14th April 00:19:07
Apache errors, served to the same IP address but different browsers, this will be a spambot:
"XXX.XXX.XXX.X, 127.0.0.1" www.transitionnetwork.org [14/Apr/2013:00:19:07 +0100] "POST /user/register HTTP/1.0" 502 568 2826 713 "http://www.transitionnetwork.org/user/register" "Mozilla/5.0 (compatible; MSIE 9.0; Windows NT 6.1; WOW64; Trident/5.0)" 1.710 "-"
"XXX.XXX.XXX.X, 127.0.0.1" www.transitionnetwork.org [14/Apr/2013:00:19:07 +0100] "POST /user/register HTTP/1.0" 502 568 2870 713 "http://www.transitionnetwork.org/user/register" "Mozilla/5.0 (Windows NT 6.1; WOW64) AppleWebKit/537.4 (KHTML, like Gecko) Chrome/22.0.1229.79 Safari/537.4" 2.244 "-"
"222.187.221.8, 127.0.0.1" www.transitionnetwork.org [14/Apr/2013:00:19:07 +0100] "POST /user/register HTTP/1.0" 502 166 2851 311 "http://www.transitionnetwork.org/user/register" "Opera/9.80 (Windows NT 5.1; U; MRA 6.0 (build 5970); ru) Presto/2.7.62 Version/11.00" 2.966 "-"
MariaDB errors:
Apr 14 00:19:07 puffin mysqld: 130414  0:19:07 [Warning] Aborted connection 819687 to db: 'transitionnetwor' user: 'transitionnetwor' host: 'localhost' (Unknown error)
Apr 14 00:19:07 puffin mysqld: 130414  0:19:07 [Warning] Aborted connection 819688 to db: 'transitionnetwor' user: 'transitionnetwor' host: 'localhost' (Unknown error)
Apr 14 00:19:07 puffin mysqld: 130414  0:19:07 [Warning] Aborted connection 819683 to db: 'transitionnetwor' user: 'transitionnetwor' host: 'localhost' (Unknown error)
Apr 14 00:19:07 puffin mysqld: 130414  0:19:07 [Warning] Aborted connection 819684 to db: 'transitionnetwor' user: 'transitionnetwor' host: 'localhost' (Unknown error)
Apr 14 00:19:07 puffin mysqld: 130414  0:19:07 [Warning] Aborted connection 819681 to db: 'transitionnetwor' user: 'transitionnetwor' host: 'localhost' (Unknown error)
Apr 14 00:19:07 puffin mysqld: 130414  0:19:07 [Warning] Aborted connection 819682 to db: 'transitionnetwor' user: 'transitionnetwor' host: 'localhost' (Unknown error)
Apr 14 00:19:07 puffin mysqld: 130414  0:19:07 [Warning] Aborted connection 819685 to db: 'transitionnetwor' user: 'transitionnetwor' host: 'localhost' (Unknown error)
Apr 14 00:19:07 puffin mysqld: 130414  0:19:07 [Warning] Aborted connection 819686 to db: 'transitionnetwor' user: 'transitionnetwor' host: 'localhost' (Unknown error)
15th April 00:19:58
Apache errors:
"66.XXX.XX.XX" www.transitionnetwork.org [15/Apr/2013:00:19:58 +0100] "GET /ingredients/starting/measurement HTTP/1.1" 502 166 462 311 "-" "Mozilla/5.0 (iPhone; U; CPU iPhone OS 4_1 like Mac OS X; en-us) AppleWebKit/532.9 (KHTML, like Gecko) Version/4.0.5 Mobile/8B117 Safari/6531.22.7 (compatible; Googlebot-Mobile/2.1; +http://www.google.com/bot.html)" 0.622 "-"
"157.XX.XX.XX" www.transitionnetwork.org [15/Apr/2013:00:19:58 +0100] "GET /people/tully-wakeman HTTP/1.1" 502 166 352 311 "-" "Mozilla/5.0 (compatible; bingbot/2.0; +http://www.bing.com/bingbot.htm)" 0.274 "-"
MariaDB errors:
Apr 15 00:19:58 puffin mysqld: 130415  0:19:58 [Warning] Aborted connection 968953 to db: 'transitionnetwor' user: 'transitionnetwor' host: 'localhost' (Unknown error)
Apr 15 00:19:58 puffin mysqld: 130415  0:19:58 [Warning] Aborted connection 968952 to db: 'transitionnetwor' user: 'transitionnetwor' host: 'localhost' (Unknown error)
comment:59 Changed 4 years ago by chris
- Add Hours to Ticket changed from 0.0 to 0.25
- Total Hours changed from 15.85 to 16.1
There was another 502 last night at 00:19:18, the usual time...
"XXX.XXX.XX.XXX" www.transitionnetwork.org [16/Apr/2013:00:19:18 +0100] "GET /ingredients/deepening/celebrate-failure HTTP/1.1" 502 568 854 713 "http://www.transitionnetwork.org/ingredients" "Mozilla/4.0 (compatible; MSIE 7.0; Windows NT 5.1; .NET CLR 1.1.4322; .NET CLR 2.0.50727; .NET CLR 3.0.04506.30; .NET CLR 3.0.4506.2152; .NET CLR 3.5.30729; MDDR; InfoPath.3)" 1.187 "-"
This is the corresponding entry in /var/log/daemon.log:
Apr 16 00:19:18 puffin mysqld: 130416 0:19:18 [Warning] Aborted connection 1136789 to db: 'transitionnetwor' user: 'transitionnetwor' host: 'localhost' (Unknown error)
Since then there have been a further two sets of "Aborted connection" errors, one set at 08:01:53:
Apr 16 08:01:53 puffin mysqld: 130416  8:01:53 [Warning] Aborted connection 1187027 to db: 'masterpuffinweba' user: 'masterpuffinweba' host: 'localhost' (Unknown error)
Apr 16 08:01:54 puffin mysqld: 130416  8:01:54 [Warning] Aborted connection 1187075 to db: 'transitionnetwor' user: 'transitionnetwor' host: 'localhost' (Unknown error)
Apr 16 08:01:54 puffin mysqld: 130416  8:01:54 [Warning] Aborted connection 1187071 to db: 'transitionnetwor' user: 'transitionnetwor' host: 'localhost' (Unknown error)
Apr 16 08:01:54 puffin mysqld: 130416  8:01:54 [Warning] Aborted connection 1187073 to db: 'transitionnetwor' user: 'transitionnetwor' host: 'localhost' (Unknown error)
Apr 16 08:01:54 puffin mysqld: 130416  8:01:54 [Warning] Aborted connection 1187025 to db: 'transitionnetwor' user: 'transitionnetwor' host: 'localhost' (Unknown error)
Apr 16 08:01:54 puffin mysqld: 130416  8:01:54 [Warning] Aborted connection 1187023 to db: 'transitionnetwor' user: 'transitionnetwor' host: 'localhost' (Unknown error)
Apr 16 08:01:54 puffin mysqld: 130416  8:01:54 [Warning] Aborted connection 1187061 to db: 'transitionnetwor' user: 'transitionnetwor' host: 'localhost' (Unknown error)
And again at 17:01:00:
Apr 16 17:01:00 puffin mysqld: 130416 17:01:00 [Warning] Aborted connection 1241538 to db: 'masterpuffinweba' user: 'masterpuffinweba' host: 'localhost' (Unknown error)
Apr 16 17:01:00 puffin mysqld: 130416 17:01:00 [Warning] Aborted connection 1241522 to db: 'masterpuffinweba' user: 'masterpuffinweba' host: 'localhost' (Unknown error)
Apr 16 17:01:01 puffin mysqld: 130416 17:01:01 [Warning] Aborted connection 1241564 to db: 'transitionnetwor' user: 'transitionnetwor' host: 'localhost' (Unknown error)
Apr 16 17:01:01 puffin mysqld: 130416 17:01:01 [Warning] Aborted connection 1241518 to db: 'transitionnetwor' user: 'transitionnetwor' host: 'localhost' (Unknown error)
Apr 16 17:01:01 puffin mysqld: 130416 17:01:01 [Warning] Aborted connection 1241544 to db: 'transitionnetwor' user: 'transitionnetwor' host: 'localhost' (Unknown error)
Apr 16 17:01:01 puffin mysqld: 130416 17:01:01 [Warning] Aborted connection 1241574 to db: 'transitionnetwor' user: 'transitionnetwor' host: 'localhost' (Unknown error)
Can the possibility that it could have been caused by the GEOS PHP extension now be ruled out as this has been disabled in the latest BOA?
comment:60 Changed 4 years ago by jim
Chris, here's a commit that'll make you happy :-) PHP: Do not reload FPM every hour - it causes error 502 if request is in progress.
There are a couple of cleanup commits after this, so there will be no more commenting out the offending scripts etc from the next BOA onwards. Good news (and a vindication of your position)!
comment:62 Changed 4 years ago by chris
This text has been removed from the wiki:PuffinServer#UpgradingBOA
Then the root cronjob running /var/xdrago/clear.sh at 11 mins past the hour needs commenting out due to the 502 errors it causes, see ticket:483:
sudo -i
export EDITOR=vim
crontab -e

#11 * * * * bash /var/xdrago/clear.sh >/dev/null 2>&1
As the script no longer kills php-fpm every hour, see ticket:547.
comment:63 Changed 3 years ago by chris
- Add Hours to Ticket changed from 0.0 to 0.25
- Status changed from assigned to closed
- Resolution set to fixed
- Total Hours changed from 16.1 to 16.35
We have only once had more that 100 502 errors in a day since early August 2013, these are the subject lines from the cron script that checks for these errors just before the logs are rotated, which contains the totals for each day:
Aug 04  558 403, 3121 404, 0 502, 69 503 and 0 504 errors from puffin.webarch.net
Aug 05  532 403, 2897 404, 1 502, 82 503 and 1 504 errors from puffin.webarch.net
Aug 06  770 403, 2879 404, 5 502, 265 503 and 1 504 errors from puffin.webarch.net
Aug 07  827 403, 3339 404, 6 502, 142 503 and 0 504 errors from puffin.webarch.net
Aug 08  852 403, 3919 404, 12 502, 349 503 and 45 504 errors from puffin.webarch.net
Aug 09  1165 403, 3637 404, 3 502, 267 503 and 5 504 errors from puffin.webarch.net
Aug 10  1166 403, 3679 404, 12 502, 226 503 and 0 504 errors from puffin.webarch.net
Aug 11  695 403, 3397 404, 1 502, 105 503 and 0 504 errors from puffin.webarch.net
Aug 12  619 403, 4100 404, 1 502, 46 503 and 0 504 errors from puffin.webarch.net
Aug 13  587 403, 2877 404, 5050 502, 295 503 and 0 504 errors from puffin.webarch.net
Aug 14  654 403, 4196 404, 8 502, 233 503 and 2 504 errors from puffin.webarch.net
Aug 15  853 403, 3385 404, 7 502, 30 503 and 0 504 errors from puffin.webarch.net
Aug 16  750 403, 2967 404, 2 502, 127 503 and 0 504 errors from puffin.webarch.net
Aug 17  934 403, 3568 404, 7 502, 155 503 and 0 504 errors from puffin.webarch.net
Aug 18  890 403, 2881 404, 1 502, 8 503 and 0 504 errors from puffin.webarch.net
Aug 19  532 403, 2473 404, 1 502, 170 503 and 1 504 errors from puffin.webarch.net
Aug 20  619 403, 2636 404, 2 502, 157 503 and 3 504 errors from puffin.webarch.net
Aug 21  640 403, 3700 404, 7 502, 265 503 and 7 504 errors from puffin.webarch.net
Aug 22  1361 403, 2907 404, 4 502, 91 503 and 1 504 errors from puffin.webarch.net
Aug 23  1324 403, 3321 404, 2 502, 89 503 and 0 504 errors from puffin.webarch.net
Aug 24  840 403, 3308 404, 14 502, 582 503 and 0 504 errors from puffin.webarch.net
Aug 25  730 403, 2772 404, 1 502, 29 503 and 0 504 errors from puffin.webarch.net
Aug 26  673 403, 2702 404, 19 502, 212 503 and 0 504 errors from puffin.webarch.net
Aug 27  726 403, 3459 404, 9 502, 121 503 and 0 504 errors from puffin.webarch.net
Aug 28  636 403, 3582 404, 20 502, 396 503 and 7 504 errors from puffin.webarch.net
Aug 29  828 403, 3209 404, 15 502, 490 503 and 11 504 errors from puffin.webarch.net
Aug 30  679 403, 4128 404, 11 502, 411 503 and 3 504 errors from puffin.webarch.net
Aug 31  593 403, 5750 404, 8 502, 56 503 and 0 504 errors from puffin.webarch.net
Sep 01  735 403, 3348 404, 0 502, 17 503 and 0 504 errors from puffin.webarch.net
Sep 02  551 403, 2939 404, 2 502, 38 503 and 0 504 errors from puffin.webarch.net
Sep 04  1352 403, 6744 404, 59 502, 935 503 and 7 504 errors from puffin.webarch.net
Sep 05  1679 403, 3364 404, 29 502, 219 503 and 1 504 errors from puffin.webarch.net
Sep 06  1916 403, 3627 404, 9 502, 317 503 and 1 504 errors from puffin.webarch.net
Sep 08  2947 403, 6114 404, 18 502, 1366 503 and 14 504 errors from puffin.webarch.net
Sep 09  1634 403, 3698 404, 9 502, 219 503 and 0 504 errors from puffin.webarch.net
Sep 10  1734 403, 5584 404, 11 502, 531 503 and 0 504 errors from puffin.webarch.net
Sep 11  1269 403, 13393 404, 36 502, 1591 503 and 30 504 errors from puffin.webarch.net
Sep 12  1679 403, 7105 404, 4 502, 863 503 and 19 504 errors from puffin.webarch.net
Sep 14  2780 403, 8882 404, 15 502, 2634 503 and 0 504 errors from puffin.webarch.net
Sep 15  1752 403, 5810 404, 1 502, 485 503 and 0 504 errors from puffin.webarch.net
Sep 16  1910 403, 4832 404, 60 502, 361 503 and 0 504 errors from puffin.webarch.net
Sep 18  3388 403, 9494 404, 35 502, 1461 503 and 0 504 errors from puffin.webarch.net
Sep 19  1489 403, 5994 404, 6 502, 792 503 and 0 504 errors from puffin.webarch.net
Sep 20  1774 403, 4775 404, 10 502, 762 503 and 0 504 errors from puffin.webarch.net
Sep 21  1936 403, 4081 404, 14 502, 580 503 and 0 504 errors from puffin.webarch.net
Sep 22  1942 403, 4589 404, 32 502, 301 503 and 0 504 errors from puffin.webarch.net
Sep 23  1878 403, 4447 404, 10 502, 406 503 and 0 504 errors from puffin.webarch.net
Sep 24  1822 403, 4616 404, 6 502, 215 503 and 0 504 errors from puffin.webarch.net
Sep 25  1836 403, 5263 404, 4 502, 64 503 and 0 504 errors from puffin.webarch.net
Sep 26  2319 403, 5889 404, 7 502, 288 503 and 0 504 errors from puffin.webarch.net
Sep 27  2278 403, 6601 404, 7 502, 262 503 and 0 504 errors from puffin.webarch.net
Sep 28  2169 403, 7631 404, 8 502, 152 503 and 0 504 errors from puffin.webarch.net
Sep 29  2099 403, 6310 404, 10 502, 77 503 and 0 504 errors from puffin.webarch.net
Sep 30  2628 403, 6351 404, 27 502, 802 503 and 0 504 errors from puffin.webarch.net
Oct 01  2744 403, 7097 404, 103 502, 3162 503 and 0 504 errors from puffin.webarch.net
Oct 02  2448 403, 7249 404, 38 502, 2152 503 and 0 504 errors from puffin.webarch.net
Oct 03  2515 403, 6332 404, 54 502, 3554 503 and 0 504 errors from puffin.webarch.net
Oct 04  2394 403, 4961 404, 71 502, 3453 503 and 0 504 errors from puffin.webarch.net
Oct 05  2337 403, 4719 404, 7 502, 228 503 and 0 504 errors from puffin.webarch.net
Oct 06  2327 403, 5885 404, 32 502, 363 503 and 0 504 errors from puffin.webarch.net
Oct 07  2661 403, 6267 404, 8 502, 286 503 and 0 504 errors from puffin.webarch.net
Oct 08  3006 403, 5432 404, 37 502, 1466 503 and 0 504 errors from puffin.webarch.net
Oct 09  2685 403, 5714 404, 40 502, 3504 503 and 0 504 errors from puffin.webarch.net
Oct 10  3371 403, 5213 404, 59 502, 6327 503 and 0 504 errors from puffin.webarch.net
Oct 11  3304 403, 5825 404, 56 502, 2065 503 and 0 504 errors from puffin.webarch.net
Oct 12  3113 403, 4921 404, 52 502, 2252 503 and 0 504 errors from puffin.webarch.net
Oct 13  3527 403, 4912 404, 40 502, 289 503 and 0 504 errors from puffin.webarch.net
Oct 14  3210 403, 7936 404, 41 502, 436 503 and 0 504 errors from puffin.webarch.net
Oct 15  3400 403, 9043 404, 33 502, 677 503 and 0 504 errors from puffin.webarch.net
Oct 16  3286 403, 5362 404, 50 502, 1010 503 and 0 504 errors from puffin.webarch.net
Oct 17  3409 403, 5837 404, 17 502, 426 503 and 0 504 errors from puffin.webarch.net
Oct 18  4060 403, 4747 404, 15 502, 224 503 and 0 504 errors from puffin.webarch.net
Oct 19  3808 403, 4420 404, 6 502, 14 503 and 0 504 errors from puffin.webarch.net
Oct 20  3457 403, 3904 404, 13 502, 215 503 and 0 504 errors from puffin.webarch.net
Oct 21  3200 403, 4270 404, 5 502, 379 503 and 0 504 errors from puffin.webarch.net
Oct 22  2994 403, 5661 404, 9 502, 275 503 and 0 504 errors from puffin.webarch.net
Oct 23  3359 403, 4950 404, 3 502, 54 503 and 0 504 errors from puffin.webarch.net
Oct 24  3200 403, 4620 404, 5 502, 16 503 and 0 504 errors from puffin.webarch.net
Oct 25  3262 403, 4728 404, 10 502, 16 503 and 0 504 errors from puffin.webarch.net
Oct 26  3026 403, 5553 404, 9 502, 19 503 and 0 504 errors from puffin.webarch.net
Oct 27  3001 403, 4599 404, 6 502, 41 503 and 0 504 errors from puffin.webarch.net
Oct 28  2939 403, 3725 404, 2 502, 20 503 and 0 504 errors from puffin.webarch.net
Oct 29  2967 403, 4119 404, 8 502, 15 503 and 0 504 errors from puffin.webarch.net
Oct 30  2782 403, 5032 404, 7 502, 9 503 and 0 504 errors from puffin.webarch.net
Oct 31  3500 403, 4254 404, 10 502, 24 503 and 0 504 errors from puffin.webarch.net
Nov 01  3335 403, 4973 404, 11 502, 70 503 and 0 504 errors from puffin.webarch.net
Nov 02  3581 403, 7293 404, 9 502, 17 503 and 0 504 errors from puffin.webarch.net
Nov 03  2972 403, 4330 404, 7 502, 18 503 and 0 504 errors from puffin.webarch.net
Nov 04  3284 403, 4797 404, 5 502, 26 503 and 0 504 errors from puffin.webarch.net
Nov 05  2844 403, 4637 404, 5 502, 10 503 and 0 504 errors from puffin.webarch.net
Nov 06  3523 403, 4657 404, 17 502, 27 503 and 0 504 errors from puffin.webarch.net
Nov 07  3210 403, 13280 404, 4 502, 37 503 and 0 504 errors from puffin.webarch.net
Nov 08  3472 403, 7198 404, 11 502, 28 503 and 0 504 errors from puffin.webarch.net
Nov 09  6897 403, 6470 404, 11 502, 315 503 and 0 504 errors from puffin.webarch.net
Nov 10  3996 403, 4431 404, 9 502, 31 503 and 0 504 errors from puffin.webarch.net
Nov 11  4268 403, 4168 404, 2 502, 45 503 and 0 504 errors from puffin.webarch.net
Nov 12  3800 403, 4111 404, 10 502, 33 503 and 0 504 errors from puffin.webarch.net
Nov 13  3513 403, 7100 404, 11 502, 27 503 and 0 504 errors from puffin.webarch.net
Nov 14  3969 403, 9565 404, 12 502, 23 503 and 0 504 errors from puffin.webarch.net
Nov 15  3260 403, 8559 404, 8 502, 8 503 and 0 504 errors from puffin.webarch.net
It's worth noting that 404 and 403 errors have gone up by a significant amount in this time.
However this issue was resolved on ticket:483#comment:60 so this ticket is being closed.