Ticket #554 (closed maintenance: fixed)
Site slow down and MySQL load increase
| Reported by: | chris | Owned by: | chris |
|---|---|---|---|
| Priority: | major | Milestone: | Maintenance |
| Component: | Live server | Keywords: | |
| Cc: | ed, jim | Estimated Number of Hours: | 0.0 |
| Add Hours to Ticket: | 0 | Billable?: | yes |
| Total Hours: | 0.75 |
Description
Since the upgrade to MariaDB 5.5.31, done on ticket:218#comment:93 (and fixed on ticket:548#comment:32) there appears to have been been a noticeable slowdown in the time for pages to be generated, measuring with http://tools.pingdom.com/fpt/ the front page alone takes around 5 seconds to generate.
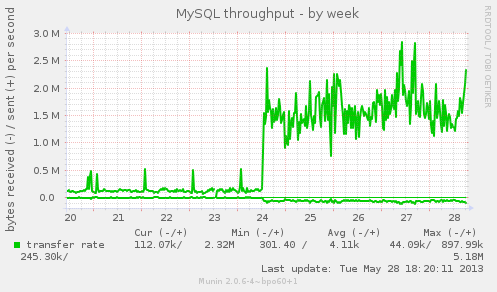
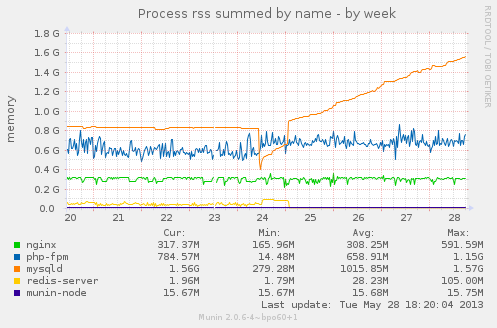
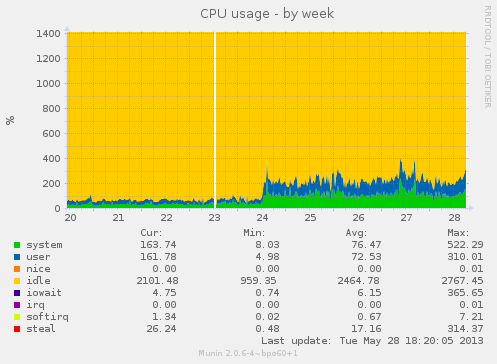
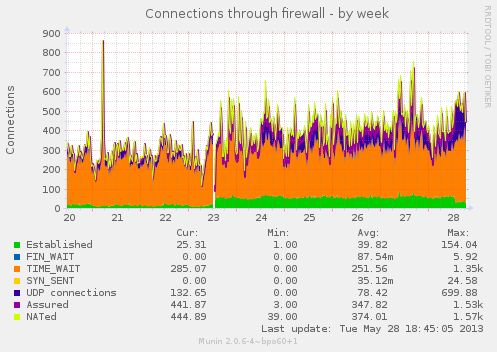
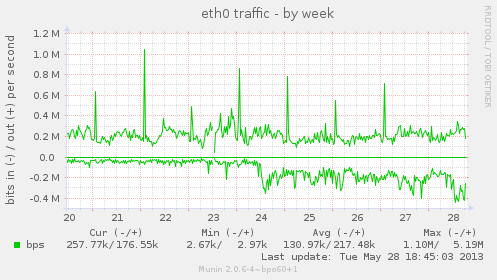
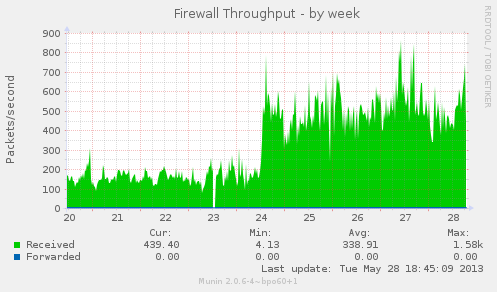
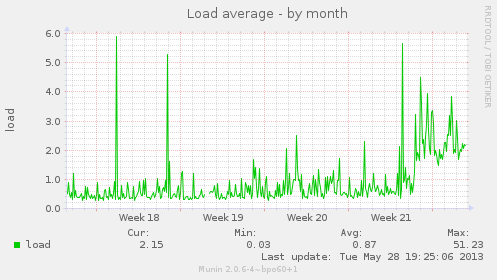
There is a clear increase in the amount of MySQL/MariaDB activity measured by Munin, see the attached graphs, the upgrade was done around midday on 24th May 2013. There has also been a increase in traffic according to the firewall graphs. The memory usage of redis has also dropped right down and the database memory usage has significantly increased.
It's not totally clear if the cause of this change in behaviour of the site is related to the MySQL/MariaDB upgrade or if there was a coincidental change in the traffic to the site at the same time. There is no noticeable change in the visitors recorded in the Piwik stats.
According to pingdom the front page of the site is now "slower than 77% of all tested websites" with a total load time of around 6 seconds, almost all of this is down to the wait of around 5 seconds for the index.php file. This can also be tested from parrot with Apache bench, sometimes cached pages are served up and these appear in an instance, if the front page is generated it takes around 5 seconds, see wiki:LoadTimes#a2013-05-28
Attachments
Change History
comment:1 Changed 3 years ago by chris
- Add Hours to Ticket changed from 0.0 to 0.25
- Total Hours changed from 0.0 to 0.25
Changed 3 years ago by chris
- Attachment puffin-mysql_queries-week-2013-05-28.png added
MySQL Queries
Changed 3 years ago by chris
- Attachment puffin-multips_memory-week-2013-05-28.png added
Memory usage
comment:2 Changed 3 years ago by chris
- Add Hours to Ticket changed from 0.0 to 0.15
- Total Hours changed from 0.25 to 0.4
These are the munin graphs from https://penguin.transitionnetwork.org/munin/transitionnetwork.org/puffin.transitionnetwork.org/ which have been attached to this ticket:
comment:4 Changed 3 years ago by chris
Using Apache banch to request the front page (just the index.php file, no css, js or images) 200 times running 10 concurrent requests at a time, from another machine in the same rack is something we have stats for from the last few years -- for comparison it now looks like the site is now roughly back to the speed it was when it was running with apache without varnish, two years ago:
- wiki:LoadTimes#a2013-05-28 5.539 seconds wiki:PuffinServer
- wiki:LoadTimes#a2013-01-28 0.253 seconds wiki:NewLiveServer
- wiki:LoadTimes#a2013-01-28 0.262 seconds wiki:PuffinServer
- wiki:LoadTimes#a2011-07-13 3.417 seconds wiki:NewLiveServer without varnish
- wiki:LoadTimes#a2011-07-05 5.131 seconds wiki:NewLiveServer without varnish
comment:5 Changed 3 years ago by jim
- Add Hours to Ticket changed from 0.0 to 0.1
- Status changed from new to closed
- Resolution set to fixed
- Total Hours changed from 0.4 to 0.5
It's because Redis couldn't be used since the global.inc replacement... the fix I said to do wiped the Redis password from /data/conf/global.inc - near the bottom:
$conf['redis_client_password'] = 'isfoobared';
I replaced this with the correct pw from global.inc.bak, which is the auto-generated password BOA creates.
This explains the more load/connections to MySQL and the slowness.
Apologies for missing this, should be fixed now. Graphs settling back down...
comment:6 Changed 3 years ago by chris
- Add Hours to Ticket changed from 0.0 to 0.25
- Total Hours changed from 0.5 to 0.75
Thanks Jim, that did the trick, sorry for not spotting that the slowness was down to redis being unavailable, I had checked it was running a few times but didn't think to check the password.
I have checked the speed of the site and it's back to loading the front page and all the js, css and images in less than a second via pingdom.com and 200 copies of index.php loads in less than 0.2 seconds, see wiki:LoadTimes#a2013-05-29


