Ticket #823 (closed maintenance: fixed)
Pwiki 2014 annual report
| Reported by: | chris | Owned by: | chris |
|---|---|---|---|
| Priority: | minor | Milestone: | Maintenance |
| Component: | Piwik | Keywords: | |
| Cc: | ed, ade | Estimated Number of Hours: | 0.0 |
| Add Hours to Ticket: | 0 | Billable?: | yes |
| Total Hours: | 1.71 |
Description
Ed would like a some PDF reports of Transition Network site usage for 2014 from Piwik.
Attachments
Change History
Changed 23 months ago by chris
- Attachment memory-year.png added
comment:1 Changed 23 months ago by chris
- Add Hours to Ticket changed from 0.0 to 0.25
- Total Hours changed from 0.0 to 0.25
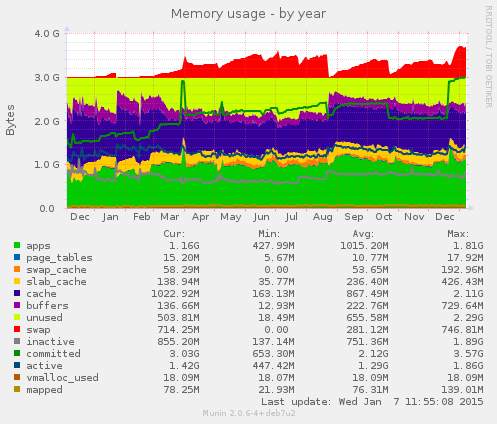
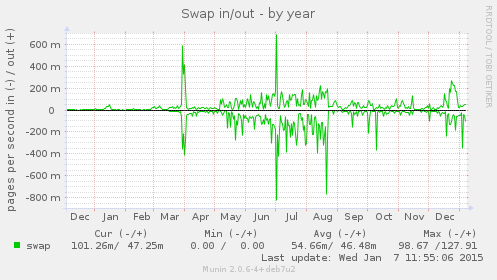
Pwiki is struggling with the lack of RAM on the server which hosts it, PenguinServer, see the Munin stats:
See the "committed" line in the graph above.
The server has 3GB of RAM, I'm going to dramatically increase this, which will require a reboot, and then generate the Piwik report and then put it back to 3GB and do another reboot.
comment:2 Changed 23 months ago by chris
The server is now running with 15 rather than 8 CPUs and 20GB rather than 3GB of RAM.
Changed 23 months ago by chris
- Attachment Report_Transition_Network_-_2014.pdf added
TN Piwik Stats 2014 Version 1
Changed 23 months ago by chris
- Attachment Report_Transition_Network_-_2014_v2.pdf added
Transition Network Pwiki Stats 2014
comment:3 Changed 23 months ago by chris
- Add Hours to Ticket changed from 0.0 to 1.21
- Total Hours changed from 0.25 to 1.46
I edited /etc/php5/fpm/pool.d/www.conf:
php_admin_value[memory_limit] = 16G
And /etc/php5/fpm/php.ini:
;max_execution_time = 30
max_execution_time = 3600

;max_input_time = 60
max_input_time = 3600

#memory_limit = 128M
memory_limit = 18G
And restarted php-fpm.
And then edited /etc/nginx/nginx.conf and edited:
        #keepalive_timeout 240;
        keepalive_timeout 3600;
And edited /etc/nginx/stats-shared :
fastcgi_read_timeout 3600;
And restarted Nginx.
Things to note from watching top, each php-fpm process uses one processor, memory usage per php-fpm process reached 780M.
Dispite changing all these settings (and the values above are the final values not all the ones tried) I was still getting "504 Gateway Time-out" from Nginx when trying to generate a PDF via the browser, however the "send report via email" function, which I expect uses the cli version of php, does appear to work... However there are some stats from the imported GA data which are no longer being collected and also some graphs which go from 2005 to 2009 -- this appears to be a Piwik bug, see:
So I generated another report without the buggy reports:
However I don't know if this has enough data?
A better job could be done manually generating graphs using the web interface and exporting tables etc, but that would be more time consuming -- Ed is the last PDF you have been sent adequate?
comment:4 Changed 23 months ago by chris
The 2005 to 2009 graphs deserve a ticket with Piwik -- if these graphs are wanted from the PDF -- I'm happy to follow this up if you think it deserves the time.
comment:5 Changed 23 months ago by ed
- Status changed from new to closed
- Resolution set to fixed
That's great Chris thanks. Closing ticket.
comment:6 Changed 23 months ago by chris
- Add Hours to Ticket changed from 0.0 to 0.25
- Total Hours changed from 1.46 to 1.71
OK, undoing the changes / setting sane values, /etc/php5/fpm/pool.d/www.conf:
php_admin_value[memory_limit] = 256M
In /etc/php5/fpm/php.ini:
max_execution_time = 60

max_input_time = 60

memory_limit = 256M
In /etc/nginx/nginx.conf:
keepalive_timeout 240;
In /etc/nginx/stats-shared:
fastcgi_read_timeout 240;
And I'm now rebooting the server to reset the RAM and CPUs.


Penguin Memory 2014