Ticket #555 (closed maintenance: fixed)
Load spikes causing the TN site to be stopped for 15 min at a time
| Reported by: | chris | Owned by: | chris |
|---|---|---|---|
| Priority: | major | Milestone: | Maintenance |
| Component: | Live server | Keywords: | |
| Cc: | ed, jim, aland | Estimated Number of Hours: | 0.25 |
| Add Hours to Ticket: | 0 | Billable?: | yes |
| Total Hours: | 50.18 |
Description (last modified by chris) (diff)
The BOA /var/xdrago/second.sh script is run every minute via the root crontab and if it detects a certain load level it changes the nginx config to a "high load" config which results in bots being served 503 errors when they spider the site, see ticket:563. When the load goes higher and hits another threshold the second.sh script kills the webserver applications, nginx and php-fpm, and waits till the load has dropped before starting them up again. This was happening once or twice a day following the increase in traffic around the launch of The Power of Just Doing Stuff. This has been addressed by multiplying the thresholds by 5 in second.sh.
Original Description
This morning at 10:19:24 I received the following alert from puffin:
Subject: lfd on puffin.webarch.net: High 5 minute load average alert - 6.59

Time:                    Wed May 29 10:17:02 2013 +0100
1 Min Load Avg:          23.39
5 Min Load Avg:          6.59
15 Min Load Avg:         2.57
Running/Total Processes: 44/326
At 10:21:57 I got an alert regarding ssh:
Service: SSH
Host: puffin
Address: puffin.webarch.net
State: CRITICAL

Date/Time: Wed May 29 10:21:57 BST 2013

Additional Info:

CRITICAL - Socket timeout after 10 seconds
Then at 10:26:47 ssh appeared to have recovered:
Service: SSH
Host: puffin
Address: puffin.webarch.net
State: OK

Date/Time: Wed May 29 10:26:47 BST 2013

Additional Info:

SSH OK - OpenSSH_5.5p1 Debian-6+squeeze3 (protocol 2.0)
But then pingdom reported at 10:29:07:
www.transitionnetwork.org is down since 29/05/2013 10:24:57.
There was then a report regarding Nginx at 10:32:07:
Notification Type: PROBLEM

Service: HTTP
Host: puffin
Address: puffin.webarch.net
State: CRITICAL

Date/Time: Wed May 29 10:32:07 BST 2013

Additional Info:

Connection refused
So at 10:33:47 I ssh'd in and found that php53-fpm and nginx were not running and it took several attempts to get them running again.
The up email from pingdom reported:
www.transitionnetwork.org is UP again at 29/05/2013 10:36:57, after 12m of downtime.
I can't find anything in the logs to indicate what caused the load spike and php-fpm and nginx to stopp running.
Attachments
Change History
comment:1 Changed 3 years ago by chris
- Add Hours to Ticket changed from 0.0 to 0.25
- Total Hours changed from 0.0 to 0.25
comment:2 follow-up: ↓ 6 Changed 3 years ago by jim
Ran the same on my VPS and got:
May 21 04:20:47 babylon lfd[8020]: *LOAD* 5 minute load average is 11.32, threshold is 6 - email sent
May 22 15:46:04 babylon lfd[18283]: *LOAD* 5 minute load average is 6.13, threshold is 6 - email sent
May 23 04:18:57 babylon lfd[1874]: *LOAD* 5 minute load average is 14.04, threshold is 6 - email sent
May 25 04:20:28 babylon lfd[17059]: *LOAD* 5 minute load average is 22.00, threshold is 6 - email sent
May 27 04:19:07 babylon lfd[1056]: *LOAD* 5 minute load average is 8.93, threshold is 6 - email sent
May 28 04:20:48 babylon lfd[1050]: *LOAD* 5 minute load average is 8.50, threshold is 6 - email sent
May 29 04:20:20 babylon lfd[29153]: *LOAD* 5 minute load average is 6.95, threshold is 6 - email sent
Gmail had been auto-archiving me alerts so I missed these, but they are in my mailbox. Tweaked my filter to promote these now.
On Babylon (my system) it started on the 21st -- that does coincide with a system update for me (I left these a few weeks). What follows is a condensed set of entries from late 20th when I did a barracuda up-stable system, minus the stuff I've got that's extra like NewRelic? and Webmin:
grep "status installed" /var/log/dpkg.log
...
2013-05-20 22:23:02 status installed man-db 2.5.7-8
2013-05-20 22:23:02 status installed php5-common 5.3.25-1~dotdeb.0
2013-05-20 22:23:04 status installed php5-cli 5.3.25-1~dotdeb.0
2013-05-20 22:23:06 status installed php5-fpm 5.3.25-1~dotdeb.0
2013-05-20 22:23:07 status installed php5-mysql 5.3.25-1~dotdeb.0
2013-05-20 22:23:07 status installed php5-imap 5.3.25-1~dotdeb.0
2013-05-20 22:23:07 status installed php5-ldap 5.3.25-1~dotdeb.0
2013-05-20 22:23:07 status installed php5-geoip 5.3.25-1~dotdeb.0
2013-05-20 22:23:07 status installed php5-xsl 5.3.25-1~dotdeb.0
2013-05-20 22:23:07 status installed php5-mcrypt 5.3.25-1~dotdeb.0
2013-05-20 22:23:07 status installed php5-curl 5.3.25-1~dotdeb.0
2013-05-20 22:23:07 status installed php5-xmlrpc 5.3.25-1~dotdeb.0
2013-05-20 22:23:07 status installed php5-sqlite 5.3.25-1~dotdeb.0
2013-05-20 22:23:07 status installed php5-gd 5.3.25-1~dotdeb.0
2013-05-20 22:23:07 status installed php5-apc 5.3.25-1~dotdeb.0
2013-05-20 22:23:07 status installed php5-imagick 5.3.25-1~dotdeb.0
2013-05-20 22:23:07 status installed php5-gmp 5.3.25-1~dotdeb.0
2013-05-20 22:23:22 status installed linux-libc-dev 2.6.32-48squeeze3
2013-05-20 22:23:22 status installed php-pear 5.3.25-1~dotdeb.0
2013-05-20 22:23:22 status installed php5-dev 5.3.25-1~dotdeb.0
2013-05-20 22:23:23 status installed libxenstore3.0 4.0.1-5.11
...
I'd bet my ass that one of the above is doing this.
Chris, when did the load spikes start for Puffin? And do you have any matching entries around that time?
My money is on an issue in PHP 5.3.25-1.
comment:3 Changed 3 years ago by jim
- Add Hours to Ticket changed from 0.0 to 0.5
- Total Hours changed from 0.25 to 0.75
comment:4 Changed 3 years ago by jim
The earlier version was php5-common 5.3.24-1~dotdeb.0, and that gave me not issues... Looking on https://bugs.php.net now.
comment:5 Changed 3 years ago by chris
- Add Hours to Ticket changed from 0.0 to 0.25
- Total Hours changed from 0.75 to 1.0
These are all the ones I have in my inbox:
Apr 22 lfd on puffin.webarch.net: High 5 minute load average alert - 6.01
Apr 22 lfd on puffin.webarch.net: High 5 minute load average alert - 6.02
Apr 23 lfd on puffin.webarch.net: High 5 minute load average alert - 7.22
Apr 24 lfd on puffin.webarch.net: High 5 minute load average alert - 8.59
Apr 25 lfd on puffin.webarch.net: High 5 minute load average alert - 6.35
Apr 26 lfd on puffin.webarch.net: High 5 minute load average alert - 9.26
Apr 28 lfd on puffin.webarch.net: High 5 minute load average alert - 7.39
Apr 28 lfd on puffin.webarch.net: High 5 minute load average alert - 16.03
Apr 28 lfd on puffin.webarch.net: High 5 minute load average alert - 6.97
Apr 29 lfd on puffin.webarch.net: High 5 minute load average alert - 7.67
Apr 29 lfd on puffin.webarch.net: High 5 minute load average alert - 64.21
Apr 30 lfd on puffin.webarch.net: High 5 minute load average alert - 7.49
May 01 lfd on puffin.webarch.net: High 5 minute load average alert - 6.69
May 03 lfd on puffin.webarch.net: High 5 minute load average alert - 6.09
May 03 lfd on puffin.webarch.net: High 5 minute load average alert - 7.62
May 04 lfd on puffin.webarch.net: High 5 minute load average alert - 6.04
May 05 lfd on puffin.webarch.net: High 5 minute load average alert - 6.04
May 06 lfd on puffin.webarch.net: High 5 minute load average alert - 6.67
May 07 lfd on puffin.webarch.net: High 5 minute load average alert - 6.75
May 07 lfd on puffin.webarch.net: High 5 minute load average alert - 7.40
May 08 lfd on puffin.webarch.net: High 5 minute load average alert - 7.21
May 10 lfd on puffin.webarch.net: High 5 minute load average alert - 9.86
May 10 lfd on puffin.webarch.net: High 5 minute load average alert - 6.02
May 11 lfd on puffin.webarch.net: High 5 minute load average alert - 12.52
May 11 lfd on puffin.webarch.net: High 5 minute load average alert - 7.30
May 11 lfd on puffin.webarch.net: High 5 minute load average alert - 6.60
May 11 lfd on puffin.webarch.net: High 5 minute load average alert - 9.22
May 12 lfd on puffin.webarch.net: High 5 minute load average alert - 10.70
May 12 lfd on puffin.webarch.net: High 5 minute load average alert - 7.26
May 13 lfd on puffin.webarch.net: High 5 minute load average alert - 6.54
May 13 lfd on puffin.webarch.net: High 5 minute load average alert - 10.77
May 14 lfd on puffin.webarch.net: High 5 minute load average alert - 8.79
May 14 lfd on puffin.webarch.net: High 5 minute load average alert - 7.96
May 14 lfd on puffin.webarch.net: High 5 minute load average alert - 9.26
May 16 lfd on puffin.webarch.net: High 5 minute load average alert - 10.61
May 17 lfd on puffin.webarch.net: High 5 minute load average alert - 6.02
May 17 lfd on puffin.webarch.net: High 5 minute load average alert - 6.16
May 18 lfd on puffin.webarch.net: High 5 minute load average alert - 7.40
May 20 lfd on puffin.webarch.net: High 5 minute load average alert - 16.78
May 20 lfd on puffin.webarch.net: High 5 minute load average alert - 16.78
May 20 lfd on puffin.webarch.net: High 5 minute load average alert - 16.78
May 20 lfd on puffin.webarch.net: High 5 minute load average alert - 16.78
May 21 lfd on puffin.webarch.net: High 5 minute load average alert - 6.89
May 22 lfd on puffin.webarch.net: High 5 minute load average alert - 12.08
May 23 lfd on puffin.webarch.net: High 5 minute load average alert - 12.14
May 23 lfd on puffin.webarch.net: High 5 minute load average alert - 6.51
May 23 lfd on puffin.webarch.net: High 5 minute load average alert - 7.20
May 24 lfd on puffin.webarch.net: High 5 minute load average alert - 9.52
May 24 lfd on puffin.webarch.net: High 5 minute load average alert - 8.13
May 24 lfd on puffin.webarch.net: High 5 minute load average alert - 6.18
May 24 lfd on puffin.webarch.net: High 5 minute load average alert - 6.16
May 24 lfd on puffin.webarch.net: High 5 minute load average alert - 7.13
May 25 lfd on puffin.webarch.net: High 5 minute load average alert - 8.23
May 25 lfd on puffin.webarch.net: High 5 minute load average alert - 7.03
May 25 lfd on puffin.webarch.net: High 5 minute load average alert - 6.70
May 25 lfd on puffin.webarch.net: High 5 minute load average alert - 7.16
May 25 lfd on puffin.webarch.net: High 5 minute load average alert - 10.29
May 25 lfd on puffin.webarch.net: High 5 minute load average alert - 10.04
May 25 lfd on puffin.webarch.net: High 5 minute load average alert - 8.82
May 25 lfd on puffin.webarch.net: High 5 minute load average alert - 9.22
May 25 lfd on puffin.webarch.net: High 5 minute load average alert - 7.43
May 26 lfd on puffin.webarch.net: High 5 minute load average alert - 8.12
May 27 lfd on puffin.webarch.net: High 5 minute load average alert - 6.43
May 27 lfd on puffin.webarch.net: High 5 minute load average alert - 7.20
May 27 lfd on puffin.webarch.net: High 5 minute load average alert - 6.25
May 27 lfd on puffin.webarch.net: High 5 minute load average alert - 6.67
May 27 lfd on puffin.webarch.net: High 5 minute load average alert - 9.81
May 27 lfd on puffin.webarch.net: High 5 minute load average alert - 6.47
May 28 lfd on puffin.webarch.net: High 5 minute load average alert - 10.78
May 28 lfd on puffin.webarch.net: High 5 minute load average alert - 6.83
May 28 lfd on puffin.webarch.net: High 5 minute load average alert - 6.58
May 28 lfd on puffin.webarch.net: High 5 minute load average alert - 6.01
May 29 lfd on puffin.webarch.net: High 5 minute load average alert - 6.59
I'm not sure if there were any prior to this, there might have been and I deleted them or there might not have been any, in any case it's been happening since late April at least.
There is a 5 days worth of Munin stats, attached, from March which show it wasn't an issue then, max load 1.88.
I have edited /etc/logrotate.d/lfd so we will keep a years worth of lfd logs rather than a weeks worth.
Changed 3 years ago by chris
- Attachment puffin-load-week-2013-03.png added
Puffin load from March 2013
comment:6 in reply to: ↑ 2 ; follow-up: ↓ 8 Changed 3 years ago by chris
Replying to jim:
On Babylon (my system) it started on the 21st
How much further back than that do you have logs for?
comment:7 Changed 3 years ago by jim
Nothing on bugs.php.net, so it must be a related sub-package...
I've now scanned my other logs and nothing jumps out... And I note the high load for me usually happens around 4.20am except for one entry.
I now think that Puffin is not necessarily suffering the same issue as Babylon...
I note one thing though -- on the update for the 20th I did, the Barracuda email sent telling me it was successful said this near the bottom:
Barracuda [Mon May 20 22:27:27 BST 2013] ==> ALRT: Your OS kernel has been upgraded!
Barracuda [Mon May 20 22:27:27 BST 2013] ==> ALRT: You *must* reboot immediately to make it active and stay secure!
I did reboot after that...
Anyway, that's all the analysis of Babylon I can/will do for now... I'll do some Googling for similar symptoms around:
- NginX 1.5.0
- PHP 5.3.25 (and related)
- MariaDB 5.5.31.
comment:8 in reply to: ↑ 6 Changed 3 years ago by jim
- Add Hours to Ticket changed from 0.0 to 0.25
- Total Hours changed from 1.0 to 1.25
Replying to chris:
How much further back than that do you have logs for?
I have all the alert emails since the dawn of (Babylon) time, but there's nothing before 21th that's suspect. Got GZipped logs that go back too, but again nothing in them before (or after TBH) 20th that looks interesting.
Looking at the Puffin email list, I'd chalk the occasional ~6 load down to a burst of traffic, but definitely a cluster around 11th that's very suspect -- does that coincide with updates?
Last word on Babylon: in case you want to compare, my CGP is here cgp.aegir.i-jk.co.uk - and its def not a Kernel thing, as I'm on 3.9...
Got to go out now, will look at this again tonight.
comment:9 Changed 3 years ago by chris
- Add Hours to Ticket changed from 0.0 to 0.25
- Total Hours changed from 1.25 to 1.5
There was just another load spike, but this time nginx and php53-fpm didn't stop running, lfd email:
Subject: lfd on puffin.webarch.net: High 5 minute load average alert - 34.49

Time:                    Wed May 29 15:43:38 2013 +0100
1 Min Load Avg:          80.66
5 Min Load Avg:          34.49
15 Min Load Avg:         13.19
Running/Total Processes: 90/311
Pingdom reported:
www.transitionnetwork.org is down since 29/05/2013 15:40:57.
Nagios alert (these are the ones that go direct to my phone):
Notification Type: PROBLEM

Service: HTTP
Host: puffin
Address: puffin.webarch.net
State: CRITICAL

Date/Time: Wed May 29 15:45:07 BST 2013

Additional Info:

Connection refused
Pingdom:
www.transitionnetwork.org is UP again at 29/05/2013 15:51:57, after 11m of downtime.
And nagios:
Notification Type: RECOVERY

Service: HTTP
Host: puffin
Address: puffin.webarch.net
State: OK

Date/Time: Wed May 29 15:55:07 BST 2013

Additional Info:

HTTP OK: HTTP/1.1 200 OK - 692 bytes in 0.005 second response time
comment:10 Changed 3 years ago by chris
- Add Hours to Ticket changed from 0.0 to 0.25
- Total Hours changed from 1.5 to 1.75
The site was down again for 5 mins last night, I have set Munin to send me a email if the load goes over 4, at 30 May 2013 04:05:13 I was sent:
transitionnetwork.org :: puffin.transitionnetwork.org :: Load average
        CRITICALs: load is 10.97 (outside range [:4]).
Then from pingdom at 30 May 2013 04:06:02 +0100:
www.transitionnetwork.org is down since 30/05/2013 04:01:57.
And from pingdom when it came back up, 30 May 2013 04:07:04 +0100:
www.transitionnetwork.org is UP again at 30/05/2013 04:06:57, after 5m of downtime.
From munin, 30 May 2013 04:10:15 +0100:
transitionnetwork.org :: puffin.transitionnetwork.org :: Load average
        CRITICALs: load is 4.08 (outside range [:4]).
And munin again, 30 May 2013 04:15:12 +0100:
transitionnetwork.org :: puffin.transitionnetwork.org :: Load average
        OKs: load is 1.81.
Again I can't see anything in the logs to indicate the cause of this.
comment:11 Changed 3 years ago by chris
Actually 5 mins before the above happened there was this email from lfd:
Date: Thu, 30 May 2013 04:01:42 +0100 (BST)
Subject: lfd on puffin.webarch.net: High 5 minute load average alert - 21.26

Time:                    Thu May 30 04:01:41 2013 +0100
1 Min Load Avg:          65.70
5 Min Load Avg:          21.26
15 Min Load Avg:         7.69
Running/Total Processes: 25/331
And this coincides with these errors in /var/log/syslog:
May 30 04:01:43 puffin mysqld: 130530  4:01:43 [Warning] Aborted connection 1011234 to db: 'transitionnetwor' user: 'transitionnetwor' host: 'localhost' (Unknown error)
May 30 04:01:43 puffin mysqld: 130530  4:01:43 [Warning] Aborted connection 1011237 to db: 'transitionnetwor' user: 'transitionnetwor' host: 'localhost' (Unknown error)
May 30 04:01:43 puffin mysqld: 130530  4:01:43 [Warning] Aborted connection 1011247 to db: 'transitionnetwor' user: 'transitionnetwor' host: 'localhost' (Unknown error)
May 30 04:01:43 puffin mysqld: 130530  4:01:43 [Warning] Aborted connection 1011260 to db: 'transitionnetwor' user: 'transitionnetwor' host: 'localhost' (Unknown error)
May 30 04:01:43 puffin mysqld: 130530  4:01:43 [Warning] Aborted connection 1011239 to db: 'transitionnetwor' user: 'transitionnetwor' host: 'localhost' (Unknown error)
May 30 04:01:43 puffin mysqld: 130530  4:01:43 [Warning] Aborted connection 1011229 to db: 'transitionnetwor' user: 'transitionnetwor' host: 'localhost' (Unknown error)
May 30 04:01:43 puffin mysqld: 130530  4:01:43 [Warning] Aborted connection 1011240 to db: 'transitionnetwor' user: 'transitionnetwor' host: 'localhost' (Unknown error)
May 30 04:01:43 puffin mysqld: 130530  4:01:43 [Warning] Aborted connection 1011231 to db: 'transitionnetwor' user: 'transitionnetwor' host: 'localhost' (Unknown error)
May 30 04:01:43 puffin mysqld: 130530  4:01:43 [Warning] Aborted connection 1011261 to db: 'transitionnetwor' user: 'transitionnetwor' host: 'localhost' (Unknown error)
May 30 04:01:43 puffin mysqld: 130530  4:01:43 [Warning] Aborted connection 1011238 to db: 'transitionnetwor' user: 'transitionnetwor' host: 'localhost' (Unknown error)
May 30 04:01:43 puffin mysqld: 130530  4:01:43 [Warning] Aborted connection 1011232 to db: 'transitionnetwor' user: 'transitionnetwor' host: 'localhost' (Unknown error)
I don't know if the high load caused the mysql problem or if the mysql problem was caused by the high load.
Changed 3 years ago by chris
- Attachment puffin-multips_memory-month-2013-05-31.png added
Puffin memory usage by selected application
comment:12 Changed 3 years ago by chris
- Add Hours to Ticket changed from 0.0 to 0.25
- Total Hours changed from 1.75 to 2.0
The memory usage of MariaDB/MySQL is still going up and has now hit 2G, half the physical RAM, I don't know if this is related to the load spikes and downtime:

I have installed some additional MySQL munin plugins to get some better stats:
cd /etc/munin/plugins
ln -s /usr/share/munin/plugins/mysql_ mysql_bin_relay_log
ln -s /usr/share/munin/plugins/mysql_ mysql_commands
ln -s /usr/share/munin/plugins/mysql_ mysql_connections
ln -s /usr/share/munin/plugins/mysql_ mysql_files_tables
ln -s /usr/share/munin/plugins/mysql_ mysql_innodb_bpool
ln -s /usr/share/munin/plugins/mysql_ mysql_innodb_bpool_act
ln -s /usr/share/munin/plugins/mysql_ mysql_innodb_insert_buf
ln -s /usr/share/munin/plugins/mysql_ mysql_innodb_io
ln -s /usr/share/munin/plugins/mysql_ mysql_innodb_io_pend
ln -s /usr/share/munin/plugins/mysql_ mysql_innodb_log
ln -s /usr/share/munin/plugins/mysql_ mysql_innodb_rows
ln -s /usr/share/munin/plugins/mysql_ mysql_innodb_semaphores
ln -s /usr/share/munin/plugins/mysql_ mysql_innodb_tnx
ln -s /usr/share/munin/plugins/mysql_ mysql_myisam_indexes
ln -s /usr/share/munin/plugins/mysql_ mysql_network_traffic
ln -s /usr/share/munin/plugins/mysql_ mysql_qcache
ln -s /usr/share/munin/plugins/mysql_ mysql_qcache_mem
ln -s /usr/share/munin/plugins/mysql_ mysql_select_types
ln -s /usr/share/munin/plugins/mysql_ mysql_slow
ln -s /usr/share/munin/plugins/mysql_ mysql_sorts
ln -s /usr/share/munin/plugins/mysql_ mysql_table_locks
ln -s /usr/share/munin/plugins/mysql_ mysql_tmp_tables
comment:13 Changed 3 years ago by chris
- Add Hours to Ticket changed from 0.0 to 0.25
- Total Hours changed from 2.0 to 2.25
Those munin plugins didn't work due to this bug: http://munin-monitoring.org/ticket/1302
So I have installed this one: https://github.com/kjellm/munin-mysql
comment:14 Changed 3 years ago by chris
- Add Hours to Ticket changed from 0.0 to 0.25
- Total Hours changed from 2.25 to 2.5
The install steps for the munin plugin which is generating graphs here, https://penguin.transitionnetwork.org/munin/transitionnetwork.org/puffin.transitionnetwork.org/index.html#mysql
cd /usr/local/src
wget https://github.com/kjellm/munin-mysql/archive/master.zip
unzip master.zip
cd munin-mysql-master
I then needed to add this to /etc/munin/plugin-conf.d/munin-node as I could get it to work using the debian-sys-maint account:
[mysql]
env.mysqlconnection DBI:mysql:mysql;host=127.0.0.1;port=3306
env.mysqluser root
env.mysqlpassword XXX
comment:15 Changed 3 years ago by jim
- Add Hours to Ticket changed from 0.0 to 0.1
- Total Hours changed from 2.5 to 2.6
We could use a little more debugging too, so I've also set MySQL to log slow queries by uncommenting these lines in /etc/mysql/my.cnf @ line 57:
slow_query_log          = 1
long_query_time         = 5
slow_query_log_file     = /var/log/mysql/sql-slow-query.log
I also set long_query_time to 5 seconds from 10.
Chris, please restart MySQL at your leisure to enable this logging to /var/log/mysql/sql-slow-query.log. It'll be interesting to see if there's a pattern of table locks etc that cause this.
comment:16 Changed 3 years ago by jim
- Add Hours to Ticket changed from 0.0 to 0.05
- Total Hours changed from 2.6 to 2.65
FYI the only differences in my.cnf between Babylon and Puffin are puffin has higher values for innodb_buffer_pool_size and key_buffer_size, and Babylon has skip-name-resolve commented out, while Puffin does not.
comment:17 Changed 3 years ago by chris
- Add Hours to Ticket changed from 0.0 to 0.25
- Total Hours changed from 2.65 to 2.9
The old mysql munin plugins had stopped working after I fixed the new ones last night, I have now got them all working this config did the trick in /etc/munin/plugin-conf.d/munin-node:
[mysql*]
user root
env.mysqlopts --defaults-file=/etc/mysql/debian.cnf
env.mysqluser debian-sys-maint
env.mysqlconnection DBI:mysql:mysql;mysql_read_default_file=/etc/mysql/debian.cnf
comment:18 Changed 3 years ago by chris
Seems like I spoke too soon regarding the old munin mysql plugins, the work on the command line:
sudo -i
cd /etc/munin/plugins
munin-run mysql_bytes
 recv.value 33653453213
 sent.value 687336777447
munin-run mysql_queries
 delete.value 464002
 insert.value 451873
 replace.value 0
 select.value 11268953
 update.value 902061
 cache_hits.value 210825250
munin-run mysql_slowqueries
 queries.value 59
munin-run mysql_threads
 threads.value 1
But they are not producing graphs and I don't understand why.
comment:19 Changed 3 years ago by chris
- Add Hours to Ticket changed from 0.0 to 0.25
- Total Hours changed from 2.9 to 3.15
Munin stats are working now, it looks like all I forgot to do this morning was restart munin-node, we now have stats here again:
I have also restarted MariaDB as requested by Jim on ticket:555#comment:15
comment:20 follow-up: ↓ 21 Changed 3 years ago by jim
- Add Hours to Ticket changed from 0.0 to 0.1
- Total Hours changed from 3.15 to 3.25
FYI /var/log/mysql/sql-slow-query.log is rotated every few hours too... So I've logged in and done this:
screen
tail -F /var/log/mysql/sql-slow-query.log > ~/jk_screen_sql_slow.log
So this way we won't miss anything... please ignore the screen session, I'll log in and kill it in a few days. (there might well be a more efficient way?)
comment:21 in reply to: ↑ 20 ; follow-up: ↓ 25 Changed 3 years ago by chris
Replying to jim:
there might well be a more efficient way?
The clobbering of logs by BOA is, IMHO, horrible and for us totally unnecessary.
There are tools for log rotation and compression in debian and I'd much rather use these.
BOA should at least give user a option to switch their log clobbering off via a configuration variable.
I'd be happy to find all the BOA scripts that do the log clobbering and comment out these parts and document which scripts need amending on each BOA upgrade and also to raise a ticket with BOA to ask them to allow users to switch off the clobbering.
comment:22 Changed 3 years ago by chris
- Add Hours to Ticket changed from 0.0 to 0.67
- Total Hours changed from 3.25 to 3.92
These are all the logs in /var/log/ which have been clobbered:
mysql/sql-slow-query.log
nginx/speed_purge.log.1
php/error_log_53
php/error_log_52
php/php53-fpm-error.log
php/php53-fpm-error.log
php/php-fpm-slow.log
php/php-fpm-error.log
php/error_log_cli_52
php/php53-fpm-slow.log
php/error_log_cli_53
redis/redis-server.log
While looking at these I did notice these lines in php/php53-fpm-error.log (between the clobberings data is still written to the log files) which potentially need some action, these entries about the front page taking over 30 seconds to generate:
[06-Jun-2013 10:21:32] WARNING: [pool www] child 6037, script '/data/disk/tn/static/transition-network-d6-004/index.php' (request: "GET /index.php") executing too slow (35.152610 sec), logging
[06-Jun-2013 10:23:04] WARNING: [pool www] child 15643, script '/data/disk/tn/static/transition-network-d6-004/index.php' (request: "GET /index.php") executing too slow (33.938562 sec), logging
[06-Jun-2013 11:00:33] WARNING: [pool www] child 62121, script '/data/disk/tn/static/transition-network-d6-004/index.php' (request: "POST /index.php") executing too slow (30.960707 sec), logging
And this indicating that we need more php-fpm processes:
[06-Jun-2013 11:00:39] WARNING: [pool www] server reached pm.max_children setting (10), consider raising it
The two scripts doing the clobbering are /var/xdrago/clear.sh and graceful.sh and these are the logs they are set to set to clobber:
clear.sh:echo rotate > /var/log/php/php-fpm-error.log
clear.sh:echo rotate > /var/log/php/php-fpm-slow.log
clear.sh:echo rotate > /var/log/php/php53-fpm-error.log
clear.sh:echo rotate > /var/log/php/php53-fpm-slow.log
clear.sh:echo rotate > /var/log/php/error_log_52
clear.sh:echo rotate > /var/log/php/error_log_53
clear.sh:echo rotate > /var/log/php/error_log_cli_52
clear.sh:echo rotate > /var/log/php/error_log_cli_53
clear.sh:echo rotate > /var/log/redis/redis-server.log
clear.sh:echo rotate > /var/log/mysql/sql-slow-query.log
clear.sh:  echo rotate > /var/log/nginx/access.log
graceful.sh:  echo rotate > /var/log/nginx/speed_purge.log
graceful.sh:    echo rotate > /var/log/newrelic/nrsysmond.log
graceful.sh:    echo rotate > /var/log/newrelic/php_agent.log
graceful.sh:    echo rotate > /var/log/newrelic/newrelic-daemon.log
I have edited them in vim:
vim /var/xdrago/graceful.sh /var/xdrago/clear.sh
And run this regular expression on them to comment out the lines doing the clobbering:
:1,$s/echo rotate/# echo rotate/gc
I have updated the BOA update notes to include this step, wiki:PuffinServer#UpgradingBOA.
I'm not sure where BOA is setting the max number of php-fpm processes to 10, in /etc/php5 it is set to 12:
grep -r "pm.max_children" /etc/php5/ | grep -v ";"
/etc/php5/fpm/pool.d/www.conf:pm.max_children = 12
I guess this is overridden somewhere so I'm doing some grepping to try to find out where.
comment:23 Changed 3 years ago by chris
- Add Hours to Ticket changed from 0.0 to 0.2
- Total Hours changed from 3.92 to 4.12
According to this BOA ticket, https://drupal.org/node/1711596 pm.max_children is set in /etc/php5
These are the key settings in /etc/php5/fpm/pool.d/www.conf:
pm.max_children = 12
pm.max_spare_servers = 3
pm.min_spare_servers = 2
pm.start_servers = 3
Perhaps min_spare_servers is deducted from max_children to get the number 10?
Each php-fpm process uses around 100MB of RAM, see:
So I think it's probably safe to increase this to 16, or more, as it only spikes above 7 a few times a day, see:
I have changed it to 16 and restarted php53-fpm.
The grep processes are still running, I expect they won't return anything, I'll keep an eye on /var/log/php/php53-fpm-error.log to see what is reported.
comment:24 Changed 3 years ago by chris
- Add Hours to Ticket changed from 0.0 to 0.1
- Total Hours changed from 4.12 to 4.22
Interesting comment here on php-fpm settings:
The number of fpm children should be the number of children that you need. As a starting point
you want generally at least as many as CPUs as you have, so maybe 1 or 2 or 4 depending on
your computer, plus 2 or 3 more for when a child is waiting on something like a database
backend. But that is only a general rule. If your child processes are blocking for long
periods of time for something, like your php script is retrieving something offsite, you might
want more. With just Drupal accessing a database, you don't need that many extra.
We have 14 CPUs so setting it to 16 seems reasonable.
The grepping has finished and it's clear that the pm.max_children variable is set in /etc/php5/fpm/pool.d/www.conf
comment:25 in reply to: ↑ 21 ; follow-up: ↓ 26 Changed 3 years ago by jim
Replying to chris:
The clobbering of logs by BOA is, IMHO, horrible and for us totally unnecessary. There are tools for log rotation and compression in debian and I'd much rather use these.
BOA should at least give user a option to switch their log clobbering off via a configuration variable.
I completely agree.
You should consider raising a ticket on the Barracuda issue queue, since we're all part of the OS project now... The log rotation is only really useful for servers getting dozens+ hits per second. And as you say, there are better ways.
---
Regarding PHP-FPM workers etc, this landed a few days ago: http://drupalcode.org/project/barracuda.git/commit/65da24cf162f588932a8b9ee140a028a2a7ea869
Also FYI NginX 1.5.1 is included now, so the next up-stable system should grab this.
comment:26 in reply to: ↑ 25 ; follow-up: ↓ 35 Changed 3 years ago by chris
- Add Hours to Ticket changed from 0.0 to 0.8
- Total Hours changed from 4.22 to 5.02
Replying to jim:
Replying to chris:
BOA should at least give user a option to switch their log clobbering off via a configuration variable.
I completely agree.
You should consider raising a ticket on the Barracuda issue queue
Thanks, I have posted the following at https://drupal.org/node/2013631
BOA Log Clobbering
By default BOA clobbers several log files, this cron job:
11 * * * * bash /var/xdrago/clear.sh >/dev/null 2>&1
Clobbers these logs:
grep "echo rotate" /var/xdrago/clear.sh
  echo rotate > /var/log/php/php-fpm-error.log
  echo rotate > /var/log/php/php-fpm-slow.log
  echo rotate > /var/log/php/php53-fpm-error.log
  echo rotate > /var/log/php/php53-fpm-slow.log
  echo rotate > /var/log/php/error_log_52
  echo rotate > /var/log/php/error_log_53
  echo rotate > /var/log/php/error_log_cli_52
  echo rotate > /var/log/php/error_log_cli_53
  echo rotate > /var/log/redis/redis-server.log
  echo rotate > /var/log/mysql/sql-slow-query.log
  echo rotate > /var/log/nginx/access.log
And this cron job:
18 0 * * * bash /var/xdrago/graceful.sh >/dev/null 2>&1
Clobbers these logs:
grep "echo rotate" /var/xdrago/graceful.sh
  echo rotate > /var/log/nginx/speed_purge.log
  echo rotate > /var/log/newrelic/nrsysmond.log
  echo rotate > /var/log/newrelic/php_agent.log
  echo rotate > /var/log/newrelic/newrelic-daemon.log
On servers where there isn't a problem with disk space it would be nice if there was an option to disable this clobbering and rely on the distribution log rotation scripts as there is potentially useful information that is lost when the logs are clobbered.
---
Regarding PHP-FPM workers etc, this landed a few days ago: http://drupalcode.org/project/barracuda.git/commit/65da24cf162f588932a8b9ee140a028a2a7ea869
Thanks for that, I have now found the config file with 10 in it:
grep -r "pm.max_children" /opt
  /opt/local/etc/php53-fpm.conf:;   static  - a fixed number (pm.max_children) of child processes;
  /opt/local/etc/php53-fpm.conf:;             pm.max_children      - the maximum number of children that can
  /opt/local/etc/php53-fpm.conf:;             pm.max_children           - the maximum number of children that
  /opt/local/etc/php53-fpm.conf:pm.max_children = 10
That file contains:
process.max = 12
pm.max_children = 10
pm.start_servers = 6
pm.min_spare_servers = 1
pm.max_spare_servers = 6
I changed these values:
process.max = 20
pm.max_children = 16
And restarted php-fpm53 and soon after got this in the error logs:
[06-Jun-2013 14:00:28] WARNING: [pool www] seems busy (you may need to increase pm.start_servers, or pm.min/max_spare_servers), spawning 8 children, there are 0 idle, and 13 total children
So I have also changed this:
pm.min_spare_servers = 4
And I have updated the BOA update notes to mention these edits, wiki:PuffinServer#UpgradingBOA and we should keep an eye on these graphs to see what the result is:
- https://penguin.transitionnetwork.org/munin/transitionnetwork.org/puffin.transitionnetwork.org/phpfpm_processes.html
- https://penguin.transitionnetwork.org/munin/transitionnetwork.org/puffin.transitionnetwork.org/phpfpm_memory.html
Also FYI NginX 1.5.1 is included now, so the next up-stable system should grab this.
Interesting, I wonder where BOA gets Nginx from these days, dotdeb only has 1.4 and I though we were getting it from there:
But we can't be:
nginx -v
nginx version: nginx/1.5.0
In fact it doesn't appear to be installed using aptitude at all:
aptitude search nginx
  p   nginx                                                       - small, powerful, scalable web/proxy server
  c   nginx-common                                                - small, powerful, scalable web/proxy server - common files
  p   nginx-dbg                                                   - Debugging symbols for nginx
  p   nginx-doc                                                   - small, powerful, scalable web/proxy server - documentation
  p   nginx-extras                                                - nginx web/proxy server (extended version)
  p   nginx-extras-dbg                                            - nginx web/proxy server (extended version) - debugging symbols
  p   nginx-full                                                  - nginx web/proxy server (standard version)
  p   nginx-full-dbg                                              - nginx web/proxy server (standard version) - debugging symbols
  p   nginx-light                                                 - nginx web/proxy server (basic version)
  p   nginx-light-dbg                                             - nginx web/proxy server (basic version) - debugging symbols
  p   nginx-naxsi                                                 - nginx web/proxy server (version with naxsi)
  p   nginx-naxsi-dbg                                             - nginx web/proxy server (version with naxsi) - debugging symbols
  p   nginx-naxsi-ui                                              - nginx web/proxy server - naxsi configuration front-end
  p   nginx-passenger                                             - nginx web/proxy server (Passenger version)
  p   nginx-passenger-dbg                                         - nginx web/proxy server (Passenger version) - debugging symbols
comment:27 Changed 3 years ago by chris
- Add Hours to Ticket changed from 0.0 to 0.25
- Total Hours changed from 5.02 to 5.27
Still getting some errors in /var/log/php/php53-fpm-error.log:
[06-Jun-2013 16:32:18] WARNING: [pool www] seems busy (you may need to increase pm.start_servers, or pm.min/max_spare_servers), spawning 8 children, there are 3 idle, and 13 total children
[06-Jun-2013 19:00:06] WARNING: [pool www] seems busy (you may need to increase pm.start_servers, or pm.min/max_spare_servers), spawning 8 children, there are 2 idle, and 10 total children
[06-Jun-2013 19:40:09] WARNING: [pool www] seems busy (you may need to increase pm.start_servers, or pm.min/max_spare_servers), spawning 8 children, there are 3 idle, and 11 total children
[06-Jun-2013 20:00:32] WARNING: [pool www] server reached pm.max_children setting (16), consider raising it
And looking at the graphs here:
- https://penguin.transitionnetwork.org/munin/transitionnetwork.org/puffin.transitionnetwork.org/phpfpm_average.html
- https://penguin.transitionnetwork.org/munin/transitionnetwork.org/puffin.transitionnetwork.org/phpfpm_memory.html
The average memory usage is now less even though the peaks are higher, so I have edited /opt/local/etc/php53-fpm.conf and changed:
process.max = 30
pm.max_children = 24
pm.start_servers = 8
pm.min_spare_servers = 6
pm.max_spare_servers = 12
Not sure if these are optimal, will check the log again tomorrow.
comment:28 Changed 3 years ago by chris
- Add Hours to Ticket changed from 0.0 to 0.25
- Total Hours changed from 5.27 to 5.52
We hit the php-fpm limit again this morning, perhaps related to the fact that the newsletter went out this morning as well, the Nginx requests per second are higher than average (at 2.42/sec compared with 1.38/sec) at the moment:
[07-Jun-2013 08:00:50] WARNING: [pool www] server reached pm.max_children setting (24), consider raising it
I have edited /opt/local/etc/php53-fpm.conf with the view to reduce the general php-pfm memory usage but to allow it to spike higher:
process.max = 40
pm.max_children = 36
pm.start_servers = 6
pm.min_spare_servers = 4
pm.max_spare_servers = 10
Since we only have one pool process.max doesn't need to be greater than pm.max_children.
I'm not convinced that this needs to be set so low as we don't have any evidence for memory leaks, we should perhaps try increasing it by a factor of 10 to reduce the number of times php-fpm processed have to be killed and restarted:
; The number of requests each child process should execute before respawning.
; This can be useful to work around memory leaks in 3rd party libraries. For
; endless request processing specify '0'. Equivalent to PHP_FCGI_MAX_REQUESTS.
; Default Value: 0
pm.max_requests = 500
comment:29 Changed 3 years ago by chris
- Add Hours to Ticket changed from 0.0 to 0.25
- Total Hours changed from 5.52 to 5.77
The max php-fpm limit was hit again:
[09-Jun-2013 08:05:24] WARNING: [pool www] server reached pm.max_children setting (36), consider raising it
The context for this limit being hit:
[09-Jun-2013 08:05:06] WARNING: [pool www] seems busy (you may need to increase pm.start_servers, or pm.min/max_spare_servers), spawning 8 children, there are 0 idle, and 20 total children
[09-Jun-2013 08:05:07] WARNING: [pool www] seems busy (you may need to increase pm.start_servers, or pm.min/max_spare_servers), spawning 16 children, there are 0 idle, and 24 total children
[09-Jun-2013 08:05:08] WARNING: [pool www] seems busy (you may need to increase pm.start_servers, or pm.min/max_spare_servers), spawning 32 children, there are 0 idle, and 28 total children
[09-Jun-2013 08:05:09] WARNING: [pool www] seems busy (you may need to increase pm.start_servers, or pm.min/max_spare_servers), spawning 32 children, there are 3 idle, and 32 total children
[09-Jun-2013 08:05:24] WARNING: [pool www] server reached pm.max_children setting (36), consider raising it
[09-Jun-2013 08:05:33] WARNING: [pool www] child 26743, script '/data/disk/tn/static/transition-network-d6-004/index.php' (request: "GET /index.php") executing too slow (32.894680 sec), logging
[09-Jun-2013 08:05:33] WARNING: [pool www] child 26330, script '/data/disk/tn/static/transition-network-d6-004/index.php' (request: "GET /index.php") executing too slow (32.119437 sec), logging
[09-Jun-2013 08:05:33] WARNING: [pool www] child 26329, script '/data/disk/tn/static/transition-network-d6-004/index.php' (request: "GET /index.php") executing too slow (31.277767 sec), logging
[09-Jun-2013 08:05:33] WARNING: [pool www] child 26328, script '/data/disk/tn/static/transition-network-d6-004/index.php' (request: "GET /index.php") executing too slow (32.266466 sec), logging
[09-Jun-2013 08:05:33] WARNING: [pool www] child 26082, script '/data/disk/tn/static/transition-network-d6-004/index.php' (request: "GET /index.php") executing too slow (30.955183 sec), logging
[09-Jun-2013 08:05:33] WARNING: [pool www] child 26066, script '/data/disk/tn/static/transition-network-d6-004/index.php' (request: "GET /index.php") executing too slow (30.320056 sec), logging
[09-Jun-2013 08:05:33] WARNING: [pool www] child 11592, script '/data/disk/tn/static/transition-network-d6-004/index.php' (request: "GET /index.php") executing too slow (30.421503 sec), logging
[09-Jun-2013 08:05:33] WARNING: [pool www] child 11590, script '/data/disk/tn/static/transition-network-d6-004/index.php' (request: "GET /index.php") executing too slow (32.509934 sec), logging
[09-Jun-2013 08:05:33] WARNING: [pool www] child 11589, script '/data/disk/tn/static/transition-network-d6-004/index.php' (request: "GET /index.php") executing too slow (30.739996 sec), logging
[09-Jun-2013 08:05:33] WARNING: [pool www] child 11586, script '/data/disk/tn/static/transition-network-d6-004/index.php' (request: "GET /index.php") executing too slow (32.881669 sec), logging
[09-Jun-2013 08:05:33] WARNING: [pool www] child 10656, script '/data/disk/tn/static/transition-network-d6-004/index.php' (request: "GET /index.php") executing too slow (32.704514 sec), logging
Looking at this graph it looks like we might have also hit the max number of mysql connections:
So these values have been edited in /etc/mysql/my.cnf, they were set at 30:
max_connections         = 40
max_user_connections    = 40
And mysql was restarted.
And /opt/local/etc/php53-fpm.conf was edited:
process.max = 50
pm.max_children = 42
pm.max_spare_servers = 8
And php53-fpm restarted.
comment:30 Changed 3 years ago by ed
My understanding of the BOA rig was that it could withstand a slashdotting. This ticket is making me increasingy nervous - particularly as we are about to have articles in Guardian and Daily Mail, and there is about to be a sustained online PR campaign aroudn Rob's book from now all across July.
comment:31 follow-up: ↓ 32 Changed 3 years ago by jim
- Add Hours to Ticket changed from 0.0 to 0.25
- Total Hours changed from 5.77 to 6.02
Hi Ed, this is not a question of a 'slashdotting' -- the server can handle that, that workload is proven to be ok.
This is about a busy site on a server, which - due to either a misconfiguration, a database issue or something wrong with our current versions of the web stack packages (PHP, MySQL etc) - has less capacity than is expected.
It's clear from Chris and my examinations that the PHP-FPM processes are being used up because something is making them hang for 30s+. I have some suspicions but nothing more, as has Chris.
My current theory is this: something is holding/blocking some requests, and they stack up behind this. I see this on my machine ONLY at 4.20 in the morning when some scripts backup/daily tasks are running. Puffin is getting this more and at other times, so it's either not the same issue, or not the same trigger.
My hunch is either:
- our versions of PHP, MySQL, NGINX or other related stuff has a bug that's blocking/locking things
- Our tn.org Drupal database as some issue around the mixed MyISAM/INNODB setup that is causing locks (this is true on my sites, which could explain my 4.20am load warning)
- Puffin has some other issue not present on Babylon.
The danger is that if we have DB locking, and therefore lots of PHP processes queued up/blocking on that IO, that simply adding more workers over and above the BOA standard quantities risks eating all the memory and knocking the server over.
Anyway, I will continue to look into this on both Puffin and Babylon. It's telling that there are no issues raise on the Barracuda issue list like this, and it's used by thousands. So for now I think it could be a system- or Drupal-level issue.
More as it happens...
comment:32 in reply to: ↑ 31 Changed 3 years ago by chris
Replying to jim:
The danger is that if we have DB locking, and therefore lots of PHP processes queued up/blocking on that IO, that simply adding more workers over and above the BOA standard quantities risks eating all the memory and knocking the server over.
Yes, I have also been very concerned about this and have been keeping a very close eye on the memory usage and swap:
- https://penguin.transitionnetwork.org/munin/transitionnetwork.org/puffin.transitionnetwork.org/multips_memory.html
- https://penguin.transitionnetwork.org/munin/transitionnetwork.org/puffin.transitionnetwork.org/memory.html
- https://penguin.transitionnetwork.org/munin/transitionnetwork.org/puffin.transitionnetwork.org/swap.html
The php-fpm and mysql process limits have been increased slowly and with this concern very much in mind.
There is also an emergency plan if the shit really does hit the fan in a massive way, there is 48GB of RAM sitting on my desk which can be added to the server ;-) In other words Ed -- don't worry too much, the site isn't going to go down if we can help it :-)
comment:33 Changed 3 years ago by ed
nice, ta
comment:34 Changed 3 years ago by chris
- Add Hours to Ticket changed from 0.0 to 0.5
- Total Hours changed from 6.02 to 6.52
Jim, have you taken a look at the /var/log/php/php53-fpm-slow.log -- now it is no longer being clobbered there is quite a lot of info here, which perhaps might help, every time a request takes more than 30 seconds and is logged in /var/log/php/php53-fpm-error.log:, eg this is the last one:
[10-Jun-2013 10:39:30] WARNING: [pool www] child 47463, script '/data/disk/tn/static/transition-network-d6-004/index.php' (request: "GET /index.php") executing too slow (38.153063 sec), logging
[10-Jun-2013 10:39:30] NOTICE: child 47463 stopped for tracing
[10-Jun-2013 10:39:30] NOTICE: about to trace 47463
[10-Jun-2013 10:39:30] NOTICE: finished trace of 47463
There is a corresponding entry in the slowlog:
[10-Jun-2013 10:39:30]  [pool www] pid 47463
script_filename = /data/disk/tn/static/transition-network-d6-004/index.php
[0x0000000002686fb8] fsockopen() /data/disk/tn/static/transition-network-d6-004/includes/common.inc:475
[0x0000000002684190] drupal_http_request() /data/disk/tn/static/transition-network-d6-004/sites/all/modules/contrib/image_resize_filter/image_resize_filter.module:366
[0x0000000002683c38] image_resize_filter_get_images() /data/disk/tn/static/transition-network-d6-004/sites/all/modules/contrib/image_resize_filter/image_resize_filter.module:59
[0x00007fff91780a00] image_resize_filter_filter() unknown:0
[0x0000000002683910] call_user_func_array() /data/disk/tn/static/transition-network-d6-004/includes/module.inc:532
[0x0000000002683178] module_invoke() /data/disk/tn/static/transition-network-d6-004/modules/filter/filter.module:455
[0x0000000002682d80] check_markup() /data/disk/tn/static/transition-network-d6-004/modules/node/node.module:1058
[0x0000000002682a48] node_prepare() /data/disk/tn/static/transition-network-d6-004/modules/node/node.module:1102
[0x0000000002682698] node_build_content() /data/disk/tn/static/transition-network-d6-004/modules/node/node.module:1023
[0x0000000002682348] node_view() /data/disk/tn/static/transition-network-d6-004/modules/node/node.module:1118
[0x00000000026821d8] node_show() /data/disk/tn/static/transition-network-d6-004/modules/node/node.module:1814
[0x0000000002681c00] node_page_view() /data/disk/tn/static/transition-network-d6-004/sites/all/modules/contrib/ctools/page_manager/plugins/tasks/node_view.inc:107
[0x00007fff91781510] page_manager_node_view() unknown:0
[0x0000000002681828] call_user_func_array() /data/disk/tn/static/transition-network-d6-004/includes/menu.inc:360
[0x00000000026814d8] menu_execute_active_handler() /data/disk/tn/static/transition-network-d6-004/index.php:17
However, reading through this log I can't see any really obvious patterns... but we might be getting fewer than we were, but Sunday is always a slow day for the site (there were 17 yesterday, Sunday, and 84 the day before and 52 the day before that, the first full day we have logs for):
grep "stopped for tracing" /var/log/php/php53-fpm-error.log | grep 09-Jun-2013 | wc -l
17
grep "stopped for tracing" /var/log/php/php53-fpm-error.log | grep 08-Jun-2013 | wc -l
84
grep "stopped for tracing" /var/log/php/php53-fpm-error.log | grep 07-Jun-2013 | wc -l
52
There have been 6 so far today.
comment:35 in reply to: ↑ 26 Changed 3 years ago by chris
- Add Hours to Ticket changed from 0.0 to 0.71
- Total Hours changed from 6.52 to 7.23
Replying to chris:
Replying to jim:
Replying to chris:
BOA should at least give user a option to switch their log clobbering off via a configuration variable.
I completely agree.
You should consider raising a ticket on the Barracuda issue queue
Thanks, I have posted the following at https://drupal.org/node/2013631
The ticket has been closed (won't fix):
These logs have no configured logrotate scripts, so we just wipe them out. We
do this also because on fast enough system with SSD it is possible to quickly
fill the disk with logs if there is something which keeps generating errors. We
have seen servers crashed because of this, hence this aggressive procedure.
I don't consider it worth adding extra logrotate scripts since any really
useful errors you can find in the syslog anyway, but feel free to disagree and
submit patch for review and re-open.
Also, you seems to use really old BOA version, because we don't purge Nginx
access log, unless there is /root/.high_traffic.cnf control file.
So, it doesn't appear to be worth following this up further with the BOA people.
These are the logs were are not rotated and which are of a size that makes them worth rotating:
80K  /var/log/mysql/sql-slow-query.log
120K /var/log/php/php53-fpm-error.log
218K /var/log/php/php53-fpm-slow.log
113M /var/log/php/www.access.log
I have edited /etc/logrotate.d/mysql-server and commented out the rotation of logs that MariaDB doesn't create and replacing it with the slow query log and also increased the number of days to keep logs from 7 to 30:
#/var/log/mysql.log /var/log/mysql/mysql.log /var/log/mysql/mysql-slow.log {
/var/log/mysql/sql-slow-query.log {

rotate 30
I have copied the nginx logrotate script to /etc/logrotate.d/php-fpm and edited it to:
/var/log/php/*.log {
        daily
        missingok
        rotate 30
        compress
        delaycompress
        notifempty
        create 0640 www-data adm
        sharedscripts
        postrotate
                [ ! -f /var/run/php53-fpm.pid ] || kill -USR1 `cat /var/run/php53-fpm.pid`
        endscript
}
The scripts were then manually run to test them:
logrotate -vf /etc/logrotate.d/mysql-server
logrotate -vf /etc/logrotate.d/php-fpm
comment:36 Changed 3 years ago by chris
- Add Hours to Ticket changed from 0.0 to 0.7
- Total Hours changed from 7.23 to 7.93
There was another period of downtime last night at around 10 pm for 8 mins , with a load peak of over 80, I can't see any indication in the logs for what caused this, there is a corresponding gap in some of the munin stats but no clues there either. Some detail follows, but it's not very illuminating.
There were around 180 hits recorded from the Guardian article yesterday and around 80 from the Alternet article -- usually Sunday isn't very busy, perhaps this is related, but this wasn't a massive spike in traffic so it shouldn't have caused this effect.
Email Alerts
These are the email alerts I got:
Date: Sun, 16 Jun 2013 22:03:50 +0100 (BST)
Subject: lfd on puffin.webarch.net: High 5 minute load average alert - 39.16

Time:                    Sun Jun 16 22:03:49 2013 +0100
1 Min Load Avg:          86.33
5 Min Load Avg:          39.16
15 Min Load Avg:         15.39
Running/Total Processes: 88/417
Date: Sun, 16 Jun 2013 22:05:15 +0100
Subject: puffin.transitionnetwork.org Munin Alert

transitionnetwork.org :: puffin.transitionnetwork.org :: Load average
        CRITICALs: load is 30.48 (outside range [:8]).
Date: Sun, 16 Jun 2013 22:07:07 +0100
Subject: ** PROBLEM Service Alert: puffin/HTTP is CRITICAL **

***** Nagios *****

Notification Type: PROBLEM

Service: HTTP
Host: puffin
Address: puffin.webarch.net
State: CRITICAL

Date/Time: Sun Jun 16 22:07:07 BST 2013

Additional Info:

Connection refused
Date: Sun, 16 Jun 2013 22:08:04 +0100
Subject: DOWN alert: www.transitionnetwork.org (www.transitionnetwork.org) is DOWN

PingdomAlert DOWN:
 www.transitionnetwork.org (www.transitionnetwork.org) is down since 16/06/2013  22:03:57.
Date: Sun, 16 Jun 2013 22:10:15 +0100
Subject: puffin.transitionnetwork.org Munin Alert

transitionnetwork.org :: puffin.transitionnetwork.org :: Load average
        CRITICALs: load is 11.31 (outside range [:8]).
And then it came back up:
Date: Sun, 16 Jun 2013 22:12:01 +0100
Subject: UP alert: www.transitionnetwork.org (www.transitionnetwork.org) is UP


PingdomAlert UP:
 www.transitionnetwork.org (www.transitionnetwork.org) is UP again at 16/06/2013  22:11:57, after 8m of downtime.
Date: Sun, 16 Jun 2013 22:12:07 +0100
Subject: ** RECOVERY Service Alert: puffin/HTTP is OK **

***** Nagios *****

Notification Type: RECOVERY

Service: HTTP
Host: puffin
Address: puffin.webarch.net
State: OK

Date/Time: Sun Jun 16 22:12:07 BST 2013

Additional Info:

HTTP OK: HTTP/1.1 200 OK - 692 bytes in 0.006 second response time
Date: Sun, 16 Jun 2013 22:15:14 +0100
Subject: puffin.transitionnetwork.org Munin Alert

transitionnetwork.org :: puffin.transitionnetwork.org :: Load average
        WARNINGs: load is 4.44 (outside range [:4]).
Date: Sun, 16 Jun 2013 22:20:17 +0100
Subject: puffin.transitionnetwork.org Munin Alert

transitionnetwork.org :: puffin.transitionnetwork.org :: Load average
        OKs: load is 1.91.
Log Entries
There are these in the the php log:
php53-fpm-error.log.1:[16-Jun-2013 17:22:32] WARNING: [pool www] server reached pm.max_children setting (42), consider raising it
php53-fpm-error.log.1:[16-Jun-2013 22:02:55] WARNING: [pool www] server reached pm.max_children setting (42), consider raising it
But I can't find anything much else to indicate what happened.
Settings Changed
I realise that this isn't the answer but have further tweaked these values in /etc/mysql/my.cnf, they were set at 40:
max_connections         = 50
max_user_connections    = 50
And mysql was restarted.
And /opt/local/etc/php53-fpm.conf was edited:
process.max = 60
pm.max_children = 50
And php53-fpm restarted.
comment:37 Changed 3 years ago by chris
- Add Hours to Ticket changed from 0.0 to 0.3
- Total Hours changed from 7.93 to 8.23
The site want down again yesterday for about 8 mins mins at 3:30pm. The load peaked at 44.
Email Alerts
These are the emails I got as it went down:
Date: Mon, 17 Jun 2013 15:00:50 +0100
Subject: puffin.transitionnetwork.org Munin Alert

transitionnetwork.org :: puffin.transitionnetwork.org :: Load average
        WARNINGs: load is 4.44 (outside range [:4]).
Date: Mon, 17 Jun 2013 15:05:15 +0100
Subject: puffin.transitionnetwork.org Munin Alert

transitionnetwork.org :: puffin.transitionnetwork.org :: Load average
        OKs: load is 2.20.
Date: Mon, 17 Jun 2013 15:28:30 +0100 (BST)
Subject: lfd on puffin.webarch.net: High 5 minute load average alert - 8.00

Time:                    Mon Jun 17 15:26:55 2013 +0100
1 Min Load Avg:          25.40
5 Min Load Avg:          8.00
15 Min Load Avg:         3.40
Running/Total Processes: 47/331
Date: Mon, 17 Jun 2013 15:30:41 +0100
Subject: puffin.transitionnetwork.org Munin Alert

transitionnetwork.org :: puffin.transitionnetwork.org :: Load average
        CRITICALs: load is 44.16 (outside range [:8]).
Date: Mon, 17 Jun 2013 15:31:07 +0100
Subject: ** PROBLEM Service Alert: puffin/HTTP is CRITICAL **

***** Nagios *****

Notification Type: PROBLEM

Service: HTTP
Host: puffin
Address: puffin.webarch.net
State: CRITICAL

Date/Time: Mon Jun 17 15:31:07 BST 2013

Additional Info:

Connection refused
Date: Mon, 17 Jun 2013 15:34:07 +0100
Subject: DOWN alert: www.transitionnetwork.org (www.transitionnetwork.org) is DOWN

PingdomAlert DOWN:
 www.transitionnetwork.org (www.transitionnetwork.org) is down since 17/06/2013  15:29:57.
Date: Mon, 17 Jun 2013 15:35:13 +0100
Subject: puffin.transitionnetwork.org Munin Alert

transitionnetwork.org :: puffin.transitionnetwork.org :: Load average
        CRITICALs: load is 17.69 (outside range [:8]).
And then it recovered:
Date: Mon, 17 Jun 2013 15:39:05 +0100
Subject: UP alert: www.transitionnetwork.org (www.transitionnetwork.org) is UP

PingdomAlert UP:
 www.transitionnetwork.org (www.transitionnetwork.org) is UP again at 17/06/2013  15:38:57, after 9m of downtime.
Date: Mon, 17 Jun 2013 15:40:18 +0100
Subject: puffin.transitionnetwork.org Munin Alert

transitionnetwork.org :: puffin.transitionnetwork.org :: Load average
        WARNINGs: load is 6.71 (outside range [:4]).
Date: Mon, 17 Jun 2013 15:41:07 +0100
Subject: ** RECOVERY Service Alert: puffin/HTTP is OK **

***** Nagios *****

Notification Type: RECOVERY

Service: HTTP
Host: puffin
Address: puffin.webarch.net
State: OK

Date/Time: Mon Jun 17 15:41:07 BST 2013

Additional Info:

HTTP OK: HTTP/1.1 200 OK - 692 bytes in 0.004 second response time
Date: Mon, 17 Jun 2013 15:45:15 +0100
Subject: puffin.transitionnetwork.org Munin Alert

transitionnetwork.org :: puffin.transitionnetwork.org :: Load average
        OKs: load is 2.80.
Log Entries
There are a lot of these in the php-fpm error log just before the server went down:
[17-Jun-2013 15:25:40] WARNING: [pool www] child 43600, script '/data/disk/tn/static/transition-network-d6-p005/index.php' (request: "GET /index.php") executing too slow (30.757526 sec), logging
[17-Jun-2013 15:25:40] WARNING: [pool www] child 35447, script '/data/disk/tn/static/transition-network-d6-p005/index.php' (request: "GET /index.php") executing too slow (37.827107 sec), logging
[17-Jun-2013 15:25:40] WARNING: [pool www] child 29997, script '/data/disk/tn/static/transition-network-d6-p005/index.php' (request: "GET /index.php") executing too slow (39.862649 sec), logging
[17-Jun-2013 15:25:40] WARNING: [pool www] child 29468, script '/data/disk/tn/static/transition-network-d6-p005/index.php' (request: "GET /index.php") executing too slow (35.815989 sec), logging
[17-Jun-2013 15:25:40] WARNING: [pool www] child 29153, script '/data/disk/tn/static/transition-network-d6-p005/index.php' (request: "GET /index.php") executing too slow (31.050583 sec), logging
[17-Jun-2013 15:25:50] WARNING: [pool www] child 45198, script '/data/disk/tn/static/transition-network-d6-p005/index.php' (request: "GET /index.php") executing too slow (30.144049 sec), logging
[17-Jun-2013 15:25:50] WARNING: [pool www] child 35536, script '/data/disk/tn/static/transition-network-d6-p005/index.php' (request: "GET /index.php") executing too slow (35.534339 sec), logging
[17-Jun-2013 15:25:50] WARNING: [pool www] child 35173, script '/data/disk/tn/static/transition-network-d6-p005/index.php' (request: "GET /index.php") executing too slow (36.196559 sec), logging
[17-Jun-2013 15:25:50] WARNING: [pool www] child 29155, script '/data/disk/tn/static/transition-network-d6-p005/index.php' (request: "GET /index.php") executing too slow (34.026623 sec), logging
[17-Jun-2013 15:26:10] WARNING: [pool www] child 45210, script '/data/disk/tn/static/transition-network-d6-p005/index.php' (request: "GET /index.php") executing too slow (30.262363 sec), logging
[17-Jun-2013 15:26:10] WARNING: [pool www] child 45208, script '/data/disk/tn/static/transition-network-d6-p005/index.php' (request: "GET /index.php") executing too slow (40.206509 sec), logging
[17-Jun-2013 15:26:20] WARNING: [pool www] child 45241, script '/data/disk/tn/static/transition-network-d6-p005/index.php' (request: "GET /index.php") executing too slow (36.576699 sec), logging
[17-Jun-2013 15:26:20] WARNING: [pool www] child 45240, script '/data/disk/tn/static/transition-network-d6-p005/index.php' (request: "GET /index.php") executing too slow (36.708073 sec), logging
[17-Jun-2013 15:26:20] WARNING: [pool www] child 45238, script '/data/disk/tn/static/transition-network-d6-p005/index.php' (request: "GET /index.php") executing too slow (37.866814 sec), logging
[17-Jun-2013 15:26:20] WARNING: [pool www] child 45228, script '/data/disk/tn/static/transition-network-d6-p005/index.php' (request: "GET /index.php") executing too slow (38.811486 sec), logging
[17-Jun-2013 15:26:20] WARNING: [pool www] child 45217, script '/data/disk/tn/static/transition-network-d6-p005/index.php' (request: "GET /index.php") executing too slow (39.173565 sec), logging
[17-Jun-2013 15:26:20] WARNING: [pool www] child 45212, script '/data/disk/tn/static/transition-network-d6-p005/index.php' (request: "GET /index.php") executing too slow (39.873535 sec), logging
[17-Jun-2013 15:26:20] WARNING: [pool www] child 29468, script '/data/disk/tn/static/transition-network-d6-p005/index.php' (request: "GET /index.php") executing too slow (38.069448 sec), logging
[17-Jun-2013 15:26:30] WARNING: [pool www] child 45259, script '/data/disk/tn/static/transition-network-d6-p005/index.php' (request: "GET /index.php") executing too slow (31.301978 sec), logging
[17-Jun-2013 15:26:30] WARNING: [pool www] child 45257, script '/data/disk/tn/static/transition-network-d6-p005/index.php' (request: "GET /index.php") executing too slow (31.574328 sec), logging
[17-Jun-2013 15:26:30] WARNING: [pool www] child 45253, script '/data/disk/tn/static/transition-network-d6-p005/index.php' (request: "GET /index.php") executing too slow (32.682662 sec), logging
[17-Jun-2013 15:26:30] WARNING: [pool www] child 45250, script '/data/disk/tn/static/transition-network-d6-p005/index.php' (request: "GET /index.php") executing too slow (33.273894 sec), logging
[17-Jun-2013 15:26:30] WARNING: [pool www] child 45248, script '/data/disk/tn/static/transition-network-d6-p005/index.php' (request: "GET /index.php") executing too slow (34.214245 sec), logging
[17-Jun-2013 15:26:30] WARNING: [pool www] child 45246, script '/data/disk/tn/static/transition-network-d6-p005/index.php' (request: "GET /index.php") executing too slow (36.041068 sec), logging
[17-Jun-2013 15:26:30] WARNING: [pool www] child 45245, script '/data/disk/tn/static/transition-network-d6-p005/index.php' (request: "GET /index.php") executing too slow (34.248792 sec), logging
[17-Jun-2013 15:27:00] WARNING: [pool www] child 45283, script '/data/disk/tn/static/transition-network-d6-p005/index.php' (request: "GET /index.php") executing too slow (35.404809 sec), logging
[17-Jun-2013 15:27:00] WARNING: [pool www] child 45279, script '/data/disk/tn/static/transition-network-d6-p005/index.php' (request: "GET /index.php") executing too slow (36.632685 sec), logging
[17-Jun-2013 15:27:00] WARNING: [pool www] child 45258, script '/data/disk/tn/static/transition-network-d6-p005/index.php' (request: "GET /index.php") executing too slow (38.613425 sec), logging
[17-Jun-2013 15:27:00] WARNING: [pool www] child 45244, script '/data/disk/tn/static/transition-network-d6-p005/index.php' (request: "GET /index.php") executing too slow (35.865239 sec), logging
[17-Jun-2013 15:27:11] WARNING: [pool www] child 45243, script '/data/disk/tn/static/transition-network-d6-p005/index.php' (request: "GET /index.php") executing too slow (32.187872 sec), logging
[17-Jun-2013 15:27:21] WARNING: [pool www] child 45313, script '/data/disk/tn/static/transition-network-d6-p005/index.php' (request: "GET /index.php") executing too slow (30.217324 sec), logging
[17-Jun-2013 15:27:21] WARNING: [pool www] child 45292, script '/data/disk/tn/static/transition-network-d6-p005/index.php' (request: "GET /index.php") executing too slow (37.632868 sec), logging
[17-Jun-2013 15:27:21] WARNING: [pool www] child 45289, script '/data/disk/tn/static/transition-network-d6-p005/index.php' (request: "GET /index.php") executing too slow (39.336141 sec), logging
[17-Jun-2013 15:27:21] WARNING: [pool www] child 45263, script '/data/disk/tn/static/transition-network-d6-p005/index.php' (request: "GET /index.php") executing too slow (30.367704 sec), logging
[17-Jun-2013 15:27:51] WARNING: [pool www] child 45324, script '/data/disk/tn/static/transition-network-d6-p005/index.php' (request: "GET /index.php") executing too slow (31.800232 sec), logging
[17-Jun-2013 15:27:51] WARNING: [pool www] child 45317, script '/data/disk/tn/static/transition-network-d6-p005/index.php' (request: "HEAD /index.php") executing too slow (32.487625 sec), logging
[17-Jun-2013 15:27:51] WARNING: [pool www] child 45277, script '/data/disk/tn/static/transition-network-d6-p005/index.php' (request: "GET /index.php") executing too slow (34.859741 sec), logging
[17-Jun-2013 15:28:11] WARNING: [pool www] child 45337, script '/data/disk/tn/static/transition-network-d6-p005/index.php' (request: "GET /index.php") executing too slow (31.740100 sec), logging
[17-Jun-2013 15:28:11] WARNING: [pool www] child 45336, script '/data/disk/tn/static/transition-network-d6-p005/index.php' (request: "GET /index.php") executing too slow (35.493527 sec), logging
[17-Jun-2013 15:28:11] WARNING: [pool www] child 45321, script '/data/disk/tn/static/transition-network-d6-p005/index.php' (request: "GET /index.php") executing too slow (39.162045 sec), logging
[17-Jun-2013 15:28:21] WARNING: [pool www] child 45342, script '/data/disk/tn/static/transition-network-d6-p005/index.php' (request: "GET /index.php") executing too slow (39.866735 sec), logging
[17-Jun-2013 15:28:31] WARNING: [pool www] child 45353, script '/data/disk/tn/static/transition-network-d6-p005/index.php' (request: "GET /index.php") executing too slow (39.079867 sec), logging
And a lot of these in the daemon.log:
Jun 17 15:29:54 puffin mysqld: 130617 15:29:54 [Warning] Aborted connection 18018 to db: 'masterpuffinwe_0' user: 'masterpuffinwe_0' host: 'localhost' (Unknown error)
Jun 17 15:29:55 puffin mysqld: 130617 15:29:55 [Warning] Aborted connection 18055 to db: 'transitionnetw_0' user: 'transitionnetw_0' host: 'localhost' (Unknown error)
Jun 17 15:29:55 puffin mysqld: 130617 15:29:55 [Warning] Aborted connection 18024 to db: 'transitionnetw_0' user: 'transitionnetw_0' host: 'localhost' (Unknown error)
Jun 17 15:29:55 puffin mysqld: 130617 15:29:55 [Warning] Aborted connection 18028 to db: 'transitionnetw_0' user: 'transitionnetw_0' host: 'localhost' (Unknown error)
Jun 17 15:29:55 puffin mysqld: 130617 15:29:55 [Warning] Aborted connection 18025 to db: 'transitionnetw_0' user: 'transitionnetw_0' host: 'localhost' (Unknown error)
Jun 17 15:29:55 puffin mysqld: 130617 15:29:55 [Warning] Aborted connection 18057 to db: 'transitionnetw_0' user: 'transitionnetw_0' host: 'localhost' (Unknown error)
Jun 17 15:29:55 puffin mysqld: 130617 15:29:55 [Warning] Aborted connection 18039 to db: 'transitionnetw_0' user: 'transitionnetw_0' host: 'localhost' (Unknown error)
Jun 17 15:29:55 puffin mysqld: 130617 15:29:55 [Warning] Aborted connection 18026 to db: 'transitionnetw_0' user: 'transitionnetw_0' host: 'localhost' (Unknown error)
Jun 17 15:29:55 puffin mysqld: 130617 15:29:55 [Warning] Aborted connection 18019 to db: 'transitionnetw_0' user: 'transitionnetw_0' host: 'localhost' (Unknown error)
Jun 17 15:29:55 puffin mysqld: 130617 15:29:55 [Warning] Aborted connection 18022 to db: 'transitionnetw_0' user: 'transitionnetw_0' host: 'localhost' (Unknown error)
Jun 17 15:29:55 puffin mysqld: 130617 15:29:55 [Warning] Aborted connection 18062 to db: 'transitionnetw_0' user: 'transitionnetw_0' host: 'localhost' (Unknown error)
Jun 17 15:29:55 puffin mysqld: 130617 15:29:55 [Warning] Aborted connection 18043 to db: 'transitionnetw_0' user: 'transitionnetw_0' host: 'localhost' (Unknown error)
Jun 17 15:29:55 puffin mysqld: 130617 15:29:55 [Warning] Aborted connection 18011 to db: 'transitionnetw_0' user: 'transitionnetw_0' host: 'localhost' (Unknown error)
Jun 17 15:29:55 puffin mysqld: 130617 15:29:55 [Warning] Aborted connection 18040 to db: 'transitionnetw_0' user: 'transitionnetw_0' host: 'localhost' (Unknown error)
Jun 17 15:29:55 puffin mysqld: 130617 15:29:55 [Warning] Aborted connection 18036 to db: 'transitionnetw_0' user: 'transitionnetw_0' host: 'localhost' (Unknown error)
Jun 17 15:29:55 puffin mysqld: 130617 15:29:55 [Warning] Aborted connection 18021 to db: 'transitionnetw_0' user: 'transitionnetw_0' host: 'localhost' (Unknown error)
Jun 17 15:29:55 puffin mysqld: 130617 15:29:55 [Warning] Aborted connection 18030 to db: 'transitionnetw_0' user: 'transitionnetw_0' host: 'localhost' (Unknown error)
Jun 17 15:29:55 puffin mysqld: 130617 15:29:55 [Warning] Aborted connection 18044 to db: 'transitionnetw_0' user: 'transitionnetw_0' host: 'localhost' (Unknown error)
Jun 17 15:29:55 puffin mysqld: 130617 15:29:55 [Warning] Aborted connection 18045 to db: 'transitionnetw_0' user: 'transitionnetw_0' host: 'localhost' (Unknown error)
Jun 17 15:29:55 puffin mysqld: 130617 15:29:55 [Warning] Aborted connection 18047 to db: 'transitionnetw_0' user: 'transitionnetw_0' host: 'localhost' (Unknown error)
Jun 17 15:29:55 puffin mysqld: 130617 15:29:55 [Warning] Aborted connection 18046 to db: 'transitionnetw_0' user: 'transitionnetw_0' host: 'localhost' (Unknown error)
Jun 17 15:29:55 puffin mysqld: 130617 15:29:55 [Warning] Aborted connection 18033 to db: 'transitionnetw_0' user: 'transitionnetw_0' host: 'localhost' (Unknown error)
Jun 17 15:29:55 puffin mysqld: 130617 15:29:55 [Warning] Aborted connection 18069 to db: 'transitionnetw_0' user: 'transitionnetw_0' host: 'localhost' (Unknown error)
Jun 17 15:29:58 puffin mysqld: 130617 15:29:58 [Warning] Aborted connection 18010 to db: 'transitionnetw_0' user: 'transitionnetw_0' host: 'localhost' (Unknown error)
Jun 17 15:30:14 puffin mysqld: 130617 15:30:13 [Warning] Aborted connection 18075 to db: 'transitionnetw_0' user: 'transitionnetw_0' host: 'localhost' (Unknown error)
Jun 17 15:30:14 puffin mysqld: 130617 15:30:14 [Warning] Aborted connection 18058 to db: 'transitionnetw_0' user: 'transitionnetw_0' host: 'localhost' (Unknown error)
Jun 17 15:30:17 puffin mysqld: 130617 15:30:17 [Warning] Aborted connection 18023 to db: 'transitionnetw_0' user: 'transitionnetw_0' host: 'localhost' (Unknown error)
Jun 17 15:30:22 puffin mysqld: 130617 15:30:22 [Warning] Aborted connection 18067 to db: 'transitionnetw_0' user: 'transitionnetw_0' host: 'localhost' (Unknown error)
Jun 17 15:30:22 puffin mysqld: 130617 15:30:22 [Warning] Aborted connection 18037 to db: 'transitionnetw_0' user: 'transitionnetw_0' host: 'localhost' (Unknown error)
Jun 17 15:30:22 puffin mysqld: 130617 15:30:22 [Warning] Aborted connection 18029 to db: 'transitionnetw_0' user: 'transitionnetw_0' host: 'localhost' (Unknown error)
Jun 17 15:30:22 puffin mysqld: 130617 15:30:22 [Warning] Aborted connection 18035 to db: 'transitionnetw_0' user: 'transitionnetw_0' host: 'localhost' (Unknown error)
Jun 17 15:30:22 puffin mysqld: 130617 15:30:22 [Warning] Aborted connection 18038 to db: 'transitionnetw_0' user: 'transitionnetw_0' host: 'localhost' (Unknown error)
Jun 17 15:30:22 puffin mysqld: 130617 15:30:22 [Warning] Aborted connection 18054 to db: 'transitionnetw_0' user: 'transitionnetw_0' host: 'localhost' (Unknown error)
Jun 17 15:30:22 puffin mysqld: 130617 15:30:22 [Warning] Aborted connection 18032 to db: 'transitionnetw_0' user: 'transitionnetw_0' host: 'localhost' (Unknown error)
Jun 17 15:30:22 puffin mysqld: 130617 15:30:22 [Warning] Aborted connection 18017 to db: 'transitionnetw_0' user: 'transitionnetw_0' host: 'localhost' (Unknown error)
Jun 17 15:30:22 puffin mysqld: 130617 15:30:22 [Warning] Aborted connection 18064 to db: 'transitionnetw_0' user: 'transitionnetw_0' host: 'localhost' (Unknown error)
Jun 17 15:30:22 puffin mysqld: 130617 15:30:22 [Warning] Aborted connection 18034 to db: 'transitionnetw_0' user: 'transitionnetw_0' host: 'localhost' (Unknown error)
Jun 17 15:30:22 puffin mysqld: 130617 15:30:22 [Warning] Aborted connection 18060 to db: 'transitionnetw_0' user: 'transitionnetw_0' host: 'localhost' (Unknown error)
Jun 17 15:30:22 puffin mysqld: 130617 15:30:22 [Warning] Aborted connection 18063 to db: 'transitionnetw_0' user: 'transitionnetw_0' host: 'localhost' (Unknown error)
Jun 17 15:30:22 puffin mysqld: 130617 15:30:22 [Warning] Aborted connection 18065 to db: 'transitionnetw_0' user: 'transitionnetw_0' host: 'localhost' (Unknown error)
Jun 17 15:30:22 puffin mysqld: 130617 15:30:22 [Warning] Aborted connection 18050 to db: 'transitionnetw_0' user: 'transitionnetw_0' host: 'localhost' (Unknown error)
Jun 17 15:30:22 puffin mysqld: 130617 15:30:22 [Warning] Aborted connection 18013 to db: 'transitionnetw_0' user: 'transitionnetw_0' host: 'localhost' (Unknown error)
Jun 17 15:30:22 puffin mysqld: 130617 15:30:22 [Warning] Aborted connection 18016 to db: 'transitionnetw_0' user: 'transitionnetw_0' host: 'localhost' (Unknown error)
Jun 17 15:30:22 puffin mysqld: 130617 15:30:22 [Warning] Aborted connection 18041 to db: 'transitionnetw_0' user: 'transitionnetw_0' host: 'localhost' (Unknown error)
Jun 17 15:30:22 puffin mysqld: 130617 15:30:22 [Warning] Aborted connection 18027 to db: 'transitionnetw_0' user: 'transitionnetw_0' host: 'localhost' (Unknown error)
Jun 17 15:30:22 puffin mysqld: 130617 15:30:22 [Warning] Aborted connection 18009 to db: 'transitionnetw_0' user: 'transitionnetw_0' host: 'localhost' (Unknown error)
Jun 17 15:30:22 puffin mysqld: 130617 15:30:22 [Warning] Aborted connection 18008 to db: 'transitionnetw_0' user: 'transitionnetw_0' host: 'localhost' (Unknown error)
Jun 17 15:30:22 puffin mysqld: 130617 15:30:22 [Warning] Aborted connection 18020 to db: 'transitionnetw_0' user: 'transitionnetw_0' host: 'localhost' (Unknown error)
But there are also other times with lots of the above mysql errors which haven't resulted in the server going down -- between June 16 at 5pm and June 18th at 9am there are 328:
grep "Aborted connection " daemon.log | wc -l
328
I'm afraid I still don't know what is causing these outages.
comment:38 Changed 3 years ago by chris
- Add Hours to Ticket changed from 0.0 to 0.3
- Total Hours changed from 8.23 to 8.53
It just happened again, at 10am, the load peaked at around 30 and the site went down for around 5 mins.
Email Alerts
Date: Tue, 18 Jun 2013 10:01:11 +0100 (BST)
Subject: lfd on puffin.webarch.net: High 5 minute load average alert - 8.93

Time:                    Tue Jun 18 10:01:11 2013 +0100
1 Min Load Avg:          30.61
5 Min Load Avg:          8.93
15 Min Load Avg:         3.45
Running/Total Processes: 45/371
Date: Tue, 18 Jun 2013 10:05:07 +0100
Subject: ** PROBLEM Service Alert: puffin/HTTP is CRITICAL **

***** Nagios *****

Notification Type: PROBLEM

Service: HTTP
Host: puffin
Address: puffin.webarch.net
State: CRITICAL

Date/Time: Tue Jun 18 10:05:07 BST 2013

Additional Info:

Connection refused
Date: Tue, 18 Jun 2013 10:05:18 +0100
Subject: puffin.transitionnetwork.org Munin Alert

transitionnetwork.org :: puffin.transitionnetwork.org :: Load average
        CRITICALs: load is 14.37 (outside range [:8]).
Date: Tue, 18 Jun 2013 10:06:04 +0100
Subject: DOWN alert: www.transitionnetwork.org (www.transitionnetwork.org) is DOWN

PingdomAlert DOWN:
 www.transitionnetwork.org (www.transitionnetwork.org) is down since 18/06/2013  10:01:57.
And Pingdom reported it back up after 6 mins down:
Date: Tue, 18 Jun 2013 10:08:03 +0100
Subject: UP alert: www.transitionnetwork.org (www.transitionnetwork.org) is UP

PingdomAlert UP:
 www.transitionnetwork.org (www.transitionnetwork.org) is UP again at 18/06/2013  10:07:59, after 6m of downtime.
Date: Tue, 18 Jun 2013 10:10:07 +0100
Subject: ** RECOVERY Service Alert: puffin/HTTP is OK **

***** Nagios *****

Notification Type: RECOVERY

Service: HTTP
Host: puffin
Address: puffin.webarch.net
State: OK

Date/Time: Tue Jun 18 10:10:07 BST 2013

Additional Info:

HTTP OK: HTTP/1.1 200 OK - 692 bytes in 0.004 second response time
Date: Tue, 18 Jun 2013 10:10:32 +0100
Subject: puffin.transitionnetwork.org Munin Alert

transitionnetwork.org :: puffin.transitionnetwork.org :: Load average
        WARNINGs: load is 5.98 (outside range [:4]).
Log Entries
daemon.log:
Jun 18 10:01:11 puffin mysqld: 130618 10:01:11 [Warning] Aborted connection 137674 to db: 'masterpuffinwe_0' user: 'masterpuffinwe_0' host: 'localhost' (Unknown error)
Jun 18 10:02:57 puffin mysqld: 130618 10:02:57 [Warning] Aborted connection 137691 to db: 'transitionnetw_0' user: 'transitionnetw_0' host: 'localhost' (Unknown error)
Jun 18 10:02:57 puffin mysqld: 130618 10:02:57 [Warning] Aborted connection 137680 to db: 'transitionnetw_0' user: 'transitionnetw_0' host: 'localhost' (Unknown error)
Jun 18 10:02:57 puffin mysqld: 130618 10:02:57 [Warning] Aborted connection 137695 to db: 'transitionnetw_0' user: 'transitionnetw_0' host: 'localhost' (Unknown error)
Jun 18 10:02:57 puffin mysqld: 130618 10:02:57 [Warning] Aborted connection 137681 to db: 'transitionnetw_0' user: 'transitionnetw_0' host: 'localhost' (Unknown error)
Jun 18 10:02:57 puffin mysqld: 130618 10:02:57 [Warning] Aborted connection 137692 to db: 'transitionnetw_0' user: 'transitionnetw_0' host: 'localhost' (Unknown error)
Jun 18 10:02:57 puffin mysqld: 130618 10:02:57 [Warning] Aborted connection 137688 to db: 'transitionnetw_0' user: 'transitionnetw_0' host: 'localhost' (Unknown error)
Jun 18 10:02:57 puffin mysqld: 130618 10:02:57 [Warning] Aborted connection 137678 to db: 'transitionnetw_0' user: 'transitionnetw_0' host: 'localhost' (Unknown error)
Jun 18 10:02:57 puffin mysqld: 130618 10:02:57 [Warning] Aborted connection 137696 to db: 'transitionnetw_0' user: 'transitionnetw_0' host: 'localhost' (Unknown error)
Jun 18 10:02:57 puffin mysqld: 130618 10:02:57 [Warning] Aborted connection 137666 to db: 'transitionnetw_0' user: 'transitionnetw_0' host: 'localhost' (Unknown error)
Jun 18 10:02:57 puffin mysqld: 130618 10:02:57 [Warning] Aborted connection 137686 to db: 'transitionnetw_0' user: 'transitionnetw_0' host: 'localhost' (Unknown error)
Jun 18 10:02:57 puffin mysqld: 130618 10:02:57 [Warning] Aborted connection 137704 to db: 'transitionnetw_0' user: 'transitionnetw_0' host: 'localhost' (Unknown error)
Jun 18 10:02:57 puffin mysqld: 130618 10:02:57 [Warning] Aborted connection 137693 to db: 'transitionnetw_0' user: 'transitionnetw_0' host: 'localhost' (Unknown error)
Jun 18 10:02:57 puffin mysqld: 130618 10:02:57 [Warning] Aborted connection 137684 to db: 'transitionnetw_0' user: 'transitionnetw_0' host: 'localhost' (Unknown error)
Jun 18 10:02:57 puffin mysqld: 130618 10:02:57 [Warning] Aborted connection 137677 to db: 'transitionnetw_0' user: 'transitionnetw_0' host: 'localhost' (Unknown error)
Jun 18 10:02:57 puffin mysqld: 130618 10:02:57 [Warning] Aborted connection 137668 to db: 'transitionnetw_0' user: 'transitionnetw_0' host: 'localhost' (Unknown error)
Jun 18 10:02:57 puffin mysqld: 130618 10:02:57 [Warning] Aborted connection 137683 to db: 'transitionnetw_0' user: 'transitionnetw_0' host: 'localhost' (Unknown error)
Jun 18 10:02:57 puffin mysqld: 130618 10:02:57 [Warning] Aborted connection 137689 to db: 'transitionnetw_0' user: 'transitionnetw_0' host: 'localhost' (Unknown error)
Jun 18 10:02:57 puffin mysqld: 130618 10:02:57 [Warning] Aborted connection 137670 to db: 'transitionnetw_0' user: 'transitionnetw_0' host: 'localhost' (Unknown error)
Jun 18 10:02:57 puffin mysqld: 130618 10:02:57 [Warning] Aborted connection 137685 to db: 'transitionnetw_0' user: 'transitionnetw_0' host: 'localhost' (Unknown error)
Jun 18 10:02:57 puffin mysqld: 130618 10:02:57 [Warning] Aborted connection 137669 to db: 'transitionnetw_0' user: 'transitionnetw_0' host: 'localhost' (Unknown error)
Jun 18 10:02:57 puffin mysqld: 130618 10:02:57 [Warning] Aborted connection 137671 to db: 'transitionnetw_0' user: 'transitionnetw_0' host: 'localhost' (Unknown error)
Jun 18 10:02:57 puffin mysqld: 130618 10:02:57 [Warning] Aborted connection 137682 to db: 'transitionnetw_0' user: 'transitionnetw_0' host: 'localhost' (Unknown error)
The php-fpm error log has nothing in it -- it's been clobbered again, but I'm not sure what did this -- the clobbering on the scripts in /var/xdrago is still commented out.
Munin Graphs
The max number of MySQL connections seems to be reach soon after each increase, I don't know if it should be increased further, see the connections by month graph:
Again I can't see any indication to the cause of the downtime in the Munin graphs.
comment:39 Changed 3 years ago by chris
- Add Hours to Ticket changed from 0.0 to 0.25
- Total Hours changed from 8.53 to 8.78
Yesterday did have the highest number of visits in a day for the whole of the last year:
- 1742 visits, 1491 unique visitors
- 3 min 4s average visit duration
- 55% visits have bounced (left the website after one page)
- 3.5 actions (page views, downloads, outlinks and internal site searches) per visit
- 1.46s average generation time
- 5698 pageviews, 4380 unique pageviews
- 33 total searches on your website, 33 unique keywords
- 81 downloads, 77 unique downloads
- 202 outlinks, 192 unique outlinks
- 184 max actions in one visit
These are the results from the mysqltuner.pl script:
 perl mysqltuner.pl

 >>  MySQLTuner 1.2.0 - Major Hayden <major@mhtx.net>
 >>  Bug reports, feature requests, and downloads at http://mysqltuner.com/
 >>  Run with '--help' for additional options and output filtering
[OK] Logged in using credentials from debian maintenance account.

-------- General Statistics --------------------------------------------------
[--] Skipped version check for MySQLTuner script
[OK] Currently running supported MySQL version 5.5.31-MariaDB-1~squeeze-log
[OK] Operating on 64-bit architecture

-------- Storage Engine Statistics -------------------------------------------
[--] Status: +Archive -BDB +Federated +InnoDB -ISAM -NDBCluster
[--] Data in MyISAM tables: 104M (Tables: 2)
[--] Data in InnoDB tables: 437M (Tables: 782)
[--] Data in PERFORMANCE_SCHEMA tables: 0B (Tables: 17)
[!!] Total fragmented tables: 94

-------- Security Recommendations  -------------------------------------------
[OK] All database users have passwords assigned

-------- Performance Metrics -------------------------------------------------
[--] Up for: 22h 54m 12s (6M q [73.364 qps], 148K conn, TX: 11B, RX: 937M)
[--] Reads / Writes: 91% / 9%
[--] Total buffers: 1.1G global + 13.4M per thread (50 max threads)
[OK] Maximum possible memory usage: 1.8G (44% of installed RAM)
[OK] Slow queries: 0% (23/6M)
[!!] Highest connection usage: 100%  (51/50)
[OK] Key buffer size / total MyISAM indexes: 509.0M/91.1M
[OK] Key buffer hit rate: 98.6% (9M cached / 138K reads)
[OK] Query cache efficiency: 74.2% (4M cached / 5M selects)
[!!] Query cache prunes per day: 1104157
[OK] Sorts requiring temporary tables: 1% (2K temp sorts / 174K sorts)
[!!] Joins performed without indexes: 7006
[!!] Temporary tables created on disk: 30% (64K on disk / 211K total)
[OK] Thread cache hit rate: 99% (51 created / 148K connections)
[!!] Table cache hit rate: 0% (128 open / 28K opened)
[OK] Open file limit used: 0% (4/196K)
[OK] Table locks acquired immediately: 99% (2M immediate / 2M locks)
[OK] InnoDB data size / buffer pool: 437.1M/509.0M

-------- Recommendations -----------------------------------------------------
General recommendations:
    Run OPTIMIZE TABLE to defragment tables for better performance
    MySQL started within last 24 hours - recommendations may be inaccurate
    Reduce or eliminate persistent connections to reduce connection usage
    Adjust your join queries to always utilize indexes
    When making adjustments, make tmp_table_size/max_heap_table_size equal
    Reduce your SELECT DISTINCT queries without LIMIT clauses
    Increase table_cache gradually to avoid file descriptor limits
Variables to adjust:
    max_connections (> 50)
    wait_timeout (< 3600)
    interactive_timeout (< 28800)
    query_cache_size (> 64M)
    join_buffer_size (> 1.0M, or always use indexes with joins)
    tmp_table_size (> 64M)
    max_heap_table_size (> 128M)
    table_cache (> 128)
I have increased these from 50:
max_connections         = 75
max_user_connections    = 75
And restarted MySQL -- there is enough RAM for this:
[--] Total buffers: 1.1G global + 13.4M per thread (75 max threads)
[OK] Maximum possible memory usage: 2.1G (52% of installed RAM)
See:
I realise Jim isn't keen on BOA settings being tweaked but I don't know what else to do?
comment:40 Changed 3 years ago by chris
- Add Hours to Ticket changed from 0.0 to 1.0
- Total Hours changed from 8.78 to 9.78
The site went down again this morning for 5 mins.
Email Alerts
Date: Wed, 19 Jun 2013 06:27:46 +0100 (BST)
Subject: lfd on puffin.webarch.net: High 5 minute load average alert - 8.48

Time:                    Wed Jun 19 06:27:11 2013 +0100
1 Min Load Avg:          25.74
5 Min Load Avg:          8.48
15 Min Load Avg:         3.22
Running/Total Processes: 36/381
Date: Wed, 19 Jun 2013 06:30:14 +0100
Subject: puffin.transitionnetwork.org Munin Alert

transitionnetwork.org :: puffin.transitionnetwork.org :: Load average
        CRITICALs: load is 20.06 (outside range [:8]).
Date: Wed, 19 Jun 2013 06:32:07 +0100
Subject: ** PROBLEM Service Alert: puffin/HTTP is CRITICAL **

***** Nagios *****

Notification Type: PROBLEM

Service: HTTP
Host: puffin
Address: puffin.webarch.net
State: CRITICAL

Date/Time: Wed Jun 19 06:32:07 BST 2013

Additional Info:

Connection refused
Date: Wed, 19 Jun 2013 06:33:07 +0100
Subject: DOWN alert: www.transitionnetwork.org (www.transitionnetwork.org) is DOWN

PingdomAlert DOWN:
 www.transitionnetwork.org (www.transitionnetwork.org) is down since 19/06/2013  06:28:57.
Date: Wed, 19 Jun 2013 06:34:35 +0100
Subject: UP alert: www.transitionnetwork.org (www.transitionnetwork.org) is UP

PingdomAlert UP:
 www.transitionnetwork.org (www.transitionnetwork.org) is UP again at 19/06/2013  06:33:57, after 5m of downtime.
Date: Wed, 19 Jun 2013 06:35:13 +0100
Subject: puffin.transitionnetwork.org Munin Alert

transitionnetwork.org :: puffin.transitionnetwork.org :: Load average
        WARNINGs: load is 7.41 (outside range [:4]).
Logs
Again there are a lot of database connection refused messages in the daemon.log but these appear to come after the site went down -- they seem to be a symptom not a cause?
Jun 19 06:28:55 puffin mysqld: 130619  6:28:55 [Warning] Aborted connection 116403 to db: 'tnpuffinwebarchn' user: 'tnpuffinwebarchn' host: 'localhost' (Unknown error)
Jun 19 06:28:55 puffin mysqld: 130619  6:28:55 [Warning] Aborted connection 116391 to db: 'masterpuffinwe_0' user: 'masterpuffinwe_0' host: 'localhost' (Unknown error)
Jun 19 06:28:56 puffin mysqld: 130619  6:28:56 [Warning] Aborted connection 116355 to db: 'masterpuffinwe_0' user: 'masterpuffinwe_0' host: 'localhost' (Unknown error)
Jun 19 06:28:57 puffin mysqld: 130619  6:28:57 [Warning] Aborted connection 116370 to db: 'transitionnetw_0' user: 'transitionnetw_0' host: 'localhost' (Unknown error)
Jun 19 06:28:57 puffin mysqld: 130619  6:28:57 [Warning] Aborted connection 116377 to db: 'transitionnetw_0' user: 'transitionnetw_0' host: 'localhost' (Unknown error)
Jun 19 06:28:57 puffin mysqld: 130619  6:28:57 [Warning] Aborted connection 116394 to db: 'transitionnetw_0' user: 'transitionnetw_0' host: 'localhost' (Unknown error)
Jun 19 06:28:57 puffin mysqld: 130619  6:28:57 [Warning] Aborted connection 116392 to db: 'transitionnetw_0' user: 'transitionnetw_0' host: 'localhost' (Unknown error)
Jun 19 06:28:57 puffin mysqld: 130619  6:28:57 [Warning] Aborted connection 116395 to db: 'transitionnetw_0' user: 'transitionnetw_0' host: 'localhost' (Unknown error)
Jun 19 06:28:57 puffin mysqld: 130619  6:28:57 [Warning] Aborted connection 116374 to db: 'transitionnetw_0' user: 'transitionnetw_0' host: 'localhost' (Unknown error)
Jun 19 06:28:57 puffin mysqld: 130619  6:28:57 [Warning] Aborted connection 116378 to db: 'transitionnetw_0' user: 'transitionnetw_0' host: 'localhost' (Unknown error)
Jun 19 06:28:57 puffin mysqld: 130619  6:28:57 [Warning] Aborted connection 116406 to db: 'transitionnetw_0' user: 'transitionnetw_0' host: 'localhost' (Unknown error)
Jun 19 06:28:57 puffin mysqld: 130619  6:28:57 [Warning] Aborted connection 116373 to db: 'transitionnetw_0' user: 'transitionnetw_0' host: 'localhost' (Unknown error)
Jun 19 06:28:57 puffin mysqld: 130619  6:28:57 [Warning] Aborted connection 116375 to db: 'transitionnetw_0' user: 'transitionnetw_0' host: 'localhost' (Unknown error)
Jun 19 06:28:57 puffin mysqld: 130619  6:28:57 [Warning] Aborted connection 116369 to db: 'transitionnetw_0' user: 'transitionnetw_0' host: 'localhost' (Unknown error)
Jun 19 06:28:57 puffin mysqld: 130619  6:28:57 [Warning] Aborted connection 116386 to db: 'transitionnetw_0' user: 'transitionnetw_0' host: 'localhost' (Unknown error)
Jun 19 06:28:57 puffin mysqld: 130619  6:28:57 [Warning] Aborted connection 116367 to db: 'transitionnetw_0' user: 'transitionnetw_0' host: 'localhost' (Unknown error)
Jun 19 06:28:57 puffin mysqld: 130619  6:28:57 [Warning] Aborted connection 116413 to db: 'transitionnetw_0' user: 'transitionnetw_0' host: 'localhost' (Unknown error)
Jun 19 06:28:57 puffin mysqld: 130619  6:28:57 [Warning] Aborted connection 116407 to db: 'transitionnetw_0' user: 'transitionnetw_0' host: 'localhost' (Unknown error)
Jun 19 06:28:59 puffin mysqld: 130619  6:28:59 [Warning] Aborted connection 116371 to db: 'transitionnetw_0' user: 'transitionnetw_0' host: 'localhost' (Unknown error)
Jun 19 06:28:59 puffin mysqld: 130619  6:28:59 [Warning] Aborted connection 116356 to db: 'transitionnetw_0' user: 'transitionnetw_0' host: 'localhost' (Unknown error)
Jun 19 06:28:59 puffin mysqld: 130619  6:28:59 [Warning] Aborted connection 116405 to db: 'transitionnetw_0' user: 'transitionnetw_0' host: 'localhost' (Unknown error)
Jun 19 06:29:00 puffin mysqld: 130619  6:29:00 [Warning] Aborted connection 116372 to db: 'transitionnetw_0' user: 'transitionnetw_0' host: 'localhost' (Unknown error)
Jun 19 06:29:00 puffin mysqld: 130619  6:29:00 [Warning] Aborted connection 116411 to db: 'transitionnetw_0' user: 'transitionnetw_0' host: 'localhost' (Unknown error)
Jun 19 06:29:00 puffin mysqld: 130619  6:29:00 [Warning] Aborted connection 116363 to db: 'transitionnetw_0' user: 'transitionnetw_0' host: 'localhost' (Unknown error)
Jun 19 06:29:00 puffin mysqld: 130619  6:29:00 [Warning] Aborted connection 116360 to db: 'transitionnetw_0' user: 'transitionnetw_0' host: 'localhost' (Unknown error)
Jun 19 06:29:00 puffin mysqld: 130619  6:29:00 [Warning] Aborted connection 116357 to db: 'transitionnetw_0' user: 'transitionnetw_0' host: 'localhost' (Unknown error)
Jun 19 06:29:00 puffin mysqld: 130619  6:29:00 [Warning] Aborted connection 116361 to db: 'transitionnetw_0' user: 'transitionnetw_0' host: 'localhost' (Unknown error)
Jun 19 06:29:00 puffin mysqld: 130619  6:29:00 [Warning] Aborted connection 116362 to db: 'transitionnetw_0' user: 'transitionnetw_0' host: 'localhost' (Unknown error)
Following are all the entries in the php-fpm error starting from just befor the site went down:
[19-Jun-2013 06:25:31] WARNING: [pool www] child 15382, script '/data/disk/tn/static/transition-network-d6-p005/index.php' (request: "GET /index.php") executing too slow (31.833145 sec), logging
[19-Jun-2013 06:25:32] NOTICE: child 15382 stopped for tracing
[19-Jun-2013 06:25:32] NOTICE: about to trace 15382
[19-Jun-2013 06:25:32] NOTICE: finished trace of 15382
[19-Jun-2013 06:25:42] WARNING: [pool www] child 65342, script '/data/disk/tn/static/transition-network-d6-p005/index.php' (request: "GET /index.php") executing too slow (37.993295 sec), logging
[19-Jun-2013 06:25:42] WARNING: [pool www] child 58525, script '/data/disk/tn/static/transition-network-d6-p005/index.php' (request: "GET /index.php") executing too slow (33.797258 sec), logging
[19-Jun-2013 06:25:42] NOTICE: child 58525 stopped for tracing
[19-Jun-2013 06:25:42] NOTICE: about to trace 58525
[19-Jun-2013 06:25:42] ERROR: failed to ptrace(PEEKDATA) pid 58525: Input/output error (5)
[19-Jun-2013 06:25:42] NOTICE: finished trace of 58525
[19-Jun-2013 06:25:42] NOTICE: child 65342 stopped for tracing
[19-Jun-2013 06:25:42] NOTICE: about to trace 65342
[19-Jun-2013 06:25:42] NOTICE: finished trace of 65342
[19-Jun-2013 06:25:52] WARNING: [pool www] child 65341, script '/data/disk/tn/static/transition-network-d6-p005/index.php' (request: "GET /index.php") executing too slow (35.574860 sec), logging
[19-Jun-2013 06:25:52] WARNING: [pool www] child 60136, script '/data/disk/tn/static/transition-network-d6-p005/index.php' (request: "GET /index.php") executing too slow (30.518012 sec), logging
[19-Jun-2013 06:25:52] WARNING: [pool www] child 60039, script '/data/disk/tn/static/transition-network-d6-p005/index.php' (request: "GET /index.php") executing too slow (34.343026 sec), logging
[19-Jun-2013 06:25:52] WARNING: [pool www] child 58526, script '/data/disk/tn/static/transition-network-d6-p005/index.php' (request: "GET /index.php") executing too slow (30.164298 sec), logging
[19-Jun-2013 06:25:52] NOTICE: child 60136 stopped for tracing
[19-Jun-2013 06:25:52] NOTICE: about to trace 60136
[19-Jun-2013 06:25:52] NOTICE: finished trace of 60136
[19-Jun-2013 06:25:52] NOTICE: child 58526 stopped for tracing
[19-Jun-2013 06:25:52] NOTICE: about to trace 58526
[19-Jun-2013 06:25:52] NOTICE: finished trace of 58526
[19-Jun-2013 06:25:52] NOTICE: child 60039 stopped for tracing
[19-Jun-2013 06:25:52] NOTICE: about to trace 60039
[19-Jun-2013 06:25:53] NOTICE: finished trace of 60039
[19-Jun-2013 06:25:53] NOTICE: child 65341 stopped for tracing
[19-Jun-2013 06:25:53] NOTICE: about to trace 65341
[19-Jun-2013 06:25:53] NOTICE: finished trace of 65341
[19-Jun-2013 06:25:57] WARNING: [pool www] seems busy (you may need to increase pm.start_servers, or pm.min/max_spare_servers), spawning 8 children, there are 2 idle, and 19 total children
[19-Jun-2013 06:25:58] WARNING: [pool www] seems busy (you may need to increase pm.start_servers, or pm.min/max_spare_servers), spawning 16 children, there are 3 idle, and 21 total children
[19-Jun-2013 06:26:22] WARNING: [pool www] child 23986, script '/data/disk/tn/static/transition-network-d6-p005/index.php' (request: "GET /index.php") executing too slow (34.334257 sec), logging
[19-Jun-2013 06:26:22] NOTICE: child 23986 stopped for tracing
[19-Jun-2013 06:26:22] NOTICE: about to trace 23986
[19-Jun-2013 06:26:22] NOTICE: finished trace of 23986
[19-Jun-2013 06:26:32] WARNING: [pool www] child 24074, script '/data/disk/tn/static/transition-network-d6-p005/index.php' (request: "GET /index.php") executing too slow (34.565718 sec), logging
[19-Jun-2013 06:26:32] WARNING: [pool www] child 24072, script '/data/disk/tn/static/transition-network-d6-p005/index.php' (request: "GET /index.php") executing too slow (30.141893 sec), logging
[19-Jun-2013 06:26:32] WARNING: [pool www] child 24071, script '/data/disk/tn/static/transition-network-d6-p005/index.php' (request: "GET /index.php") executing too slow (35.893850 sec), logging
[19-Jun-2013 06:26:32] WARNING: [pool www] child 24070, script '/data/disk/tn/static/transition-network-d6-p005/index.php' (request: "GET /index.php") executing too slow (35.088002 sec), logging
[19-Jun-2013 06:26:32] WARNING: [pool www] child 24069, script '/data/disk/tn/static/transition-network-d6-p005/index.php' (request: "GET /index.php") executing too slow (36.859334 sec), logging
[19-Jun-2013 06:26:32] WARNING: [pool www] child 23991, script '/data/disk/tn/static/transition-network-d6-p005/index.php' (request: "GET /index.php") executing too slow (38.090436 sec), logging
[19-Jun-2013 06:26:32] WARNING: [pool www] child 23989, script '/data/disk/tn/static/transition-network-d6-p005/index.php' (request: "GET /index.php") executing too slow (38.128572 sec), logging
[19-Jun-2013 06:26:32] WARNING: [pool www] child 23988, script '/data/disk/tn/static/transition-network-d6-p005/index.php' (request: "GET /index.php") executing too slow (38.120426 sec), logging
[19-Jun-2013 06:26:32] WARNING: [pool www] child 58524, script '/data/disk/tn/static/transition-network-d6-p005/index.php' (request: "GET /index.php") executing too slow (38.118462 sec), logging
[19-Jun-2013 06:26:32] NOTICE: child 58524 stopped for tracing
[19-Jun-2013 06:26:32] NOTICE: about to trace 58524
[19-Jun-2013 06:26:32] NOTICE: finished trace of 58524
[19-Jun-2013 06:26:32] NOTICE: child 23988 stopped for tracing
[19-Jun-2013 06:26:32] NOTICE: about to trace 23988
[19-Jun-2013 06:26:32] NOTICE: finished trace of 23988
[19-Jun-2013 06:26:32] NOTICE: child 23989 stopped for tracing
[19-Jun-2013 06:26:32] NOTICE: about to trace 23989
[19-Jun-2013 06:26:32] NOTICE: finished trace of 23989
[19-Jun-2013 06:26:32] NOTICE: child 23991 stopped for tracing
[19-Jun-2013 06:26:32] NOTICE: about to trace 23991
[19-Jun-2013 06:26:32] NOTICE: finished trace of 23991
[19-Jun-2013 06:26:32] NOTICE: child 24069 stopped for tracing
[19-Jun-2013 06:26:32] NOTICE: about to trace 24069
[19-Jun-2013 06:26:33] NOTICE: finished trace of 24069
[19-Jun-2013 06:26:33] NOTICE: child 24070 stopped for tracing
[19-Jun-2013 06:26:33] NOTICE: about to trace 24070
[19-Jun-2013 06:26:33] NOTICE: finished trace of 24070
[19-Jun-2013 06:26:33] NOTICE: child 24071 stopped for tracing
[19-Jun-2013 06:26:33] NOTICE: about to trace 24071
[19-Jun-2013 06:26:33] NOTICE: finished trace of 24071
[19-Jun-2013 06:26:33] NOTICE: child 24072 stopped for tracing
[19-Jun-2013 06:26:33] NOTICE: about to trace 24072
[19-Jun-2013 06:26:33] NOTICE: finished trace of 24072
[19-Jun-2013 06:26:33] NOTICE: child 24074 stopped for tracing
[19-Jun-2013 06:26:33] NOTICE: about to trace 24074
[19-Jun-2013 06:26:33] NOTICE: finished trace of 24074
[19-Jun-2013 06:27:02] WARNING: [pool www] child 24075, script '/data/disk/tn/static/transition-network-d6-p005/index.php' (request: "GET /index.php") executing too slow (35.738509 sec), logging
[19-Jun-2013 06:27:02] NOTICE: child 24075 stopped for tracing
[19-Jun-2013 06:27:02] NOTICE: about to trace 24075
[19-Jun-2013 06:27:02] NOTICE: finished trace of 24075
[19-Jun-2013 06:27:12] WARNING: [pool www] child 24078, script '/data/disk/tn/static/transition-network-d6-p005/index.php' (request: "GET /index.php") executing too slow (30.576278 sec), logging
[19-Jun-2013 06:27:12] WARNING: [pool www] child 24073, script '/data/disk/tn/static/transition-network-d6-p005/index.php' (request: "GET /index.php") executing too slow (32.021376 sec), logging
[19-Jun-2013 06:27:12] NOTICE: child 24073 stopped for tracing
[19-Jun-2013 06:27:12] NOTICE: about to trace 24073
[19-Jun-2013 06:27:12] ERROR: failed to ptrace(PEEKDATA) pid 24073: Input/output error (5)
[19-Jun-2013 06:27:12] NOTICE: finished trace of 24073
[19-Jun-2013 06:27:12] NOTICE: child 24078 stopped for tracing
[19-Jun-2013 06:27:12] NOTICE: about to trace 24078
[19-Jun-2013 06:27:12] NOTICE: finished trace of 24078
[19-Jun-2013 06:27:22] WARNING: [pool www] child 24080, script '/data/disk/tn/static/transition-network-d6-p005/index.php' (request: "GET /index.php") executing too slow (37.363864 sec), logging
[19-Jun-2013 06:27:22] WARNING: [pool www] child 24079, script '/data/disk/tn/static/transition-network-d6-p005/index.php' (request: "GET /index.php") executing too slow (39.426180 sec), logging
[19-Jun-2013 06:27:22] NOTICE: child 24080 stopped for tracing
[19-Jun-2013 06:27:22] NOTICE: about to trace 24080
[19-Jun-2013 06:27:23] NOTICE: finished trace of 24080
[19-Jun-2013 06:27:23] NOTICE: child 24079 stopped for tracing
[19-Jun-2013 06:27:23] NOTICE: about to trace 24079
[19-Jun-2013 06:27:23] ERROR: failed to ptrace(PEEKDATA) pid 24079: Input/output error (5)
[19-Jun-2013 06:27:23] NOTICE: finished trace of 24079
[19-Jun-2013 06:27:42] WARNING: [pool www] child 24209, script '/data/disk/tn/static/transition-network-d6-p005/index.php' (request: "GET /index.php") executing too slow (37.571959 sec), logging
[19-Jun-2013 06:27:42] WARNING: [pool www] child 24207, script '/data/disk/tn/static/transition-network-d6-p005/index.php' (request: "GET /index.php") executing too slow (39.672834 sec), logging
[19-Jun-2013 06:27:42] NOTICE: child 24209 stopped for tracing
[19-Jun-2013 06:27:42] NOTICE: about to trace 24209
[19-Jun-2013 06:27:42] NOTICE: finished trace of 24209
[19-Jun-2013 06:27:42] NOTICE: child 24207 stopped for tracing
[19-Jun-2013 06:27:42] NOTICE: about to trace 24207
[19-Jun-2013 06:27:43] NOTICE: finished trace of 24207
[19-Jun-2013 06:28:32] WARNING: [pool www] child 24216, script '/data/disk/tn/static/transition-network-d6-p005/index.php' (request: "GET /index.php") executing too slow (36.870764 sec), logging
[19-Jun-2013 06:28:32] WARNING: [pool www] child 24212, script '/data/disk/tn/static/transition-network-d6-p005/index.php' (request: "GET /index.php") executing too slow (38.754472 sec), logging
[19-Jun-2013 06:28:32] NOTICE: child 24212 stopped for tracing
[19-Jun-2013 06:28:33] NOTICE: about to trace 24212
[19-Jun-2013 06:28:33] ERROR: failed to ptrace(PEEKDATA) pid 24212: Input/output error (5)
[19-Jun-2013 06:28:33] NOTICE: finished trace of 24212
[19-Jun-2013 06:28:33] NOTICE: child 24216 stopped for tracing
[19-Jun-2013 06:28:33] NOTICE: about to trace 24216
[19-Jun-2013 06:28:33] ERROR: failed to ptrace(PEEKDATA) pid 24216: Input/output error (5)
[19-Jun-2013 06:28:33] NOTICE: finished trace of 24216
[19-Jun-2013 06:28:52] WARNING: [pool www] child 24256, script '/data/disk/tn/static/transition-network-d6-p005/index.php' (request: "GET /index.php") executing too slow (37.653180 sec), logging
[19-Jun-2013 06:28:53] NOTICE: child 24256 stopped for tracing
[19-Jun-2013 06:28:53] NOTICE: about to trace 24256
[19-Jun-2013 06:28:53] ERROR: failed to ptrace(PEEKDATA) pid 24256: Input/output error (5)
[19-Jun-2013 06:28:53] NOTICE: finished trace of 24256
[19-Jun-2013 06:28:57] NOTICE: Finishing ...
[19-Jun-2013 06:28:58] NOTICE: Finishing ...
[19-Jun-2013 06:28:59] NOTICE: Finishing ...
[19-Jun-2013 06:29:00] NOTICE: exiting, bye-bye!
The logs were rotated at this point and the first couple of line in the next log file:
[19-Jun-2013 06:34:24] NOTICE: fpm is running, pid 29480
[19-Jun-2013 06:34:24] NOTICE: ready to handle connections
I have found lots of 503 errors in the nginx logs, I'll follow that up on another ticket.
comment:41 Changed 3 years ago by jim
- Add Hours to Ticket changed from 0.0 to 0.75
- Total Hours changed from 9.78 to 10.53
Adding hours of investigation.
Also noting I don't think the PHP-FPM logs are telling us much other than 'something stopped responding'.
And I've enabled syslog on all main Drupal sites, and commented out the bit of /var/xdrago/daily.sh that disables syslog for performance reasons.
I'm also now convinced this is nothing to do with Drupal, since no Drupal errors happen before or after theses events
comment:43 Changed 3 years ago by chris
- Add Hours to Ticket changed from 0.0 to 0.5
- Total Hours changed from 10.53 to 11.03
On ticket:563#comment:3 it has been noted that second.sh restarts nginx when the load hits 3.8 and if the load reaches 14.4 then nginx is killed and php-fpm stopped.
These values seem totally off for a 14 CPU server and the suspicion is that this is the cause of the downtime when there is a load spike.
So these values in /var/xdrago/second.sh:
CTL_ONEX_SPIDER_LOAD=388
CTL_FIVX_SPIDER_LOAD=388
CTL_ONEX_LOAD=1444
CTL_FIVX_LOAD=888
CTL_ONEX_LOAD_CRIT=1888
CTL_FIVX_LOAD_CRIT=1555
Have been multiplied by 4:
CTL_ONEX_SPIDER_LOAD=1552
CTL_FIVX_SPIDER_LOAD=1552
CTL_ONEX_LOAD=5776
CTL_FIVX_LOAD=3552
CTL_ONEX_LOAD_CRIT=7552
CTL_FIVX_LOAD_CRIT=6220
And the crontab has been re-enabled:
* * * * * bash /var/xdrago/second.sh >/dev/null 2>&1
comment:44 Changed 3 years ago by chris
- Add Hours to Ticket changed from 0.0 to 1.7
- Priority changed from major to critical
- Total Hours changed from 11.03 to 12.73
- Summary changed from 12 mins of downtime on 29th May 2013 to Load spikes, ksoftirqd using all the CPU and services stopping for 15 min at a time
I have changed the Munin server on Penguin to update every 3 mins rather than every 5 mins to get a better resolution on the stats, this is the script that needed editing to do this, /etc/cron.d/munin
#*/5 * * * *     munin if [ -x /usr/bin/munin-cron ]; then /usr/bin/munin-cron; fi
*/3 * * * *     munin if [ -x /usr/bin/munin-cron ]; then /usr/bin/munin-cron; fi
When the last spike happened it appears that ksoftirqd was using almost all the CPU, it looked like this in top:
top - 10:20:24 up 47 min,  2 users,  load average: 8.27, 3.22, 1.69
Tasks: 248 total,  25 running, 223 sleeping,   0 stopped,   0 zombie
Cpu(s):  0.6%us,  1.5%sy,  0.0%ni, 18.5%id,  0.0%wa,  0.0%hi,  4.4%si, 74.9%st
Mem:   8372060k total,  4995628k used,  3376432k free,  2847284k buffers
Swap:  1048568k total,        0k used,  1048568k free,   576780k cached

  PID USER      PR  NI  VIRT  RES  SHR S %CPU %MEM    TIME+  COMMAND
   13 root      20   0     0    0    0 R  103  0.0   0:59.73 ksoftirqd/3
   19 root      20   0     0    0    0 R  103  0.0   1:03.89 ksoftirqd/5
   10 root      20   0     0    0    0 R  102  0.0   1:18.58 ksoftirqd/2
   16 root      20   0     0    0    0 R  102  0.0   0:59.98 ksoftirqd/4
   40 root      20   0     0    0    0 R  101  0.0   1:09.77 ksoftirqd/12
   22 root      20   0     0    0    0 R  100  0.0   1:06.77 ksoftirqd/6
   25 root      20   0     0    0    0 R   99  0.0   1:10.52 ksoftirqd/7
   34 root      20   0     0    0    0 R   99  0.0   0:52.93 ksoftirqd/10
    4 root      20   0     0    0    0 R   98  0.0   0:41.95 ksoftirqd/0
    7 root      20   0     0    0    0 R   98  0.0   0:50.85 ksoftirqd/1
   28 root      20   0     0    0    0 R   98  0.0   1:13.32 ksoftirqd/8
   31 root      20   0     0    0    0 R   70  0.0   0:58.65 ksoftirqd/9
   37 root      20   0     0    0    0 R   62  0.0   0:47.97 ksoftirqd/11
   30 root      RT   0     0    0    0 S   27  0.0   0:03.66 migration/9
29492 www-data  20   0  771m  92m  50m R    2  1.1   0:03.26 php-fpm
29493 www-data  20   0  762m  66m  33m S    1  0.8   0:00.88 php-fpm
 3356 mysql     20   0 1647m 414m 9.9m S    1  5.1   1:24.31 mysqld
Other people have had problems like this, for example:
- https://bugzilla.redhat.com/show_bug.cgi?id=870573
- http://askubuntu.com/questions/7858/why-is-ksoftirqd-0-process-using-all-my-cpu
More investigation is needed, but I think we have finally found a cause or perhaps a symptom that might lead us to a cause...
I have updated the puffin documentation, adding section on php-fpm, wiki:PuffinServer#php-fpm and also documenting the my.cnf and php53-fpm.conf and second.sh tweaks from the default BOA settings.
I have also spent a fair amount of time watching top and the munin stats.
comment:45 Changed 3 years ago by chris
- Add Hours to Ticket changed from 0.0 to 2.0
- Total Hours changed from 12.73 to 14.73
Investigating the ksoftirqd issue...
If ksoftirqd is taking more than a tiny percentage of CPU time,
this indicates the machine is under heavy soft interrupt load.
For reference following is the result of cat /proc/interrupts, we could do with the output form this when there is next a load spike.
CPU0 CPU1 CPU2 CPU3 CPU4 CPU5 CPU6 CPU7 CPU8 CPU9 CPU10 CPU11 CPU12 CPU13 565: 402997 0 0 0 0 0 0 0 0 0 0 0 0 0 xen-dyn-event eth0 566: 60 0 0 0 0 0 0 0 0 0 0 0 0 0 xen-dyn-event blkif 567: 484313 0 0 0 0 0 0 0 0 0 0 0 0 0 xen-dyn-event blkif 568: 1765 0 0 0 0 0 0 0 0 0 0 0 0 0 xen-dyn-event hvc_console 569: 434 0 0 0 0 0 0 0 0 0 0 0 0 0 xen-dyn-event xenbus 570: 0 0 0 0 0 0 0 0 0 0 0 0 0 6043 xen-percpu-ipi callfuncsingle13 571: 0 0 0 0 0 0 0 0 0 0 0 0 0 0 xen-percpu-virq debug13 572: 0 0 0 0 0 0 0 0 0 0 0 0 0 1568 xen-percpu-ipi callfunc13 573: 0 0 0 0 0 0 0 0 0 0 0 0 0 49895 xen-percpu-ipi resched13 574: 0 0 0 0 0 0 0 0 0 0 0 0 0 302441 xen-percpu-virq timer13 575: 0 0 0 0 0 0 0 0 0 0 0 0 5890 0 xen-percpu-ipi callfuncsingle12 576: 0 0 0 0 0 0 0 0 0 0 0 0 0 0 xen-percpu-virq debug12 577: 0 0 0 0 0 0 0 0 0 0 0 0 1546 0 xen-percpu-ipi callfunc12 578: 0 0 0 0 0 0 0 0 0 0 0 0 46341 0 xen-percpu-ipi resched12 579: 0 0 0 0 0 0 0 0 0 0 0 0 236553 0 xen-percpu-virq timer12 580: 0 0 0 0 0 0 0 0 0 0 0 6018 0 0 xen-percpu-ipi callfuncsingle11 581: 0 0 0 0 0 0 0 0 0 0 0 0 0 0 xen-percpu-virq debug11 582: 0 0 0 0 0 0 0 0 0 0 0 1672 0 0 xen-percpu-ipi callfunc11 583: 0 0 0 0 0 0 0 0 0 0 0 41650 0 0 xen-percpu-ipi resched11 584: 0 0 0 0 0 0 0 0 0 0 0 218108 0 0 xen-percpu-virq timer11 585: 0 0 0 0 0 0 0 0 0 0 5640 0 0 0 xen-percpu-ipi callfuncsingle10 586: 0 0 0 0 0 0 0 0 0 0 0 0 0 0 xen-percpu-virq debug10 587: 0 0 0 0 0 0 0 0 0 0 1683 0 0 0 xen-percpu-ipi callfunc10 588: 0 0 0 0 0 0 0 0 0 0 47145 0 0 0 xen-percpu-ipi resched10 589: 0 0 0 0 0 0 0 0 0 0 242891 0 0 0 xen-percpu-virq timer10 590: 0 0 0 0 0 0 0 0 0 6235 0 0 0 0 xen-percpu-ipi callfuncsingle9 591: 0 0 0 0 0 0 0 0 0 0 0 0 0 0 xen-percpu-virq debug9 592: 0 0 0 0 0 0 0 0 0 1689 0 0 0 0 xen-percpu-ipi callfunc9 593: 0 0 0 0 0 0 0 0 0 46975 0 0 0 0 xen-percpu-ipi resched9 594: 0 0 0 0 0 0 0 0 0 249278 0 0 0 0 xen-percpu-virq timer9 595: 0 0 0 0 0 0 0 0 5937 0 0 0 0 0 xen-percpu-ipi callfuncsingle8 596: 0 0 0 0 0 0 0 0 0 0 0 0 0 0 xen-percpu-virq debug8 597: 0 0 0 0 0 0 0 0 1807 0 0 0 0 0 xen-percpu-ipi callfunc8 598: 0 0 0 0 0 0 0 0 53368 0 0 0 0 0 xen-percpu-ipi resched8 599: 0 0 0 0 0 0 0 0 267242 0 0 0 0 0 xen-percpu-virq timer8 600: 0 0 0 0 0 0 0 5972 0 0 0 0 0 0 xen-percpu-ipi callfuncsingle7 601: 0 0 0 0 0 0 0 0 0 0 0 0 0 0 xen-percpu-virq debug7 602: 0 0 0 0 0 0 0 1985 0 0 0 0 0 0 xen-percpu-ipi callfunc7 603: 0 0 0 0 0 0 0 51311 0 0 0 0 0 0 xen-percpu-ipi resched7 604: 0 0 0 0 0 0 0 291006 0 0 0 0 0 0 xen-percpu-virq timer7 605: 0 0 0 0 0 0 6333 0 0 0 0 0 0 0 xen-percpu-ipi callfuncsingle6 606: 0 0 0 0 0 0 0 0 0 0 0 0 0 0 xen-percpu-virq debug6 607: 0 0 0 0 0 0 2057 0 0 0 0 0 0 0 xen-percpu-ipi callfunc6 608: 0 0 0 0 0 0 56102 0 0 0 0 0 0 0 xen-percpu-ipi resched6 609: 0 0 0 0 0 0 283555 0 0 0 0 0 0 0 xen-percpu-virq timer6 610: 0 0 0 0 0 6743 0 0 0 0 0 0 0 0 xen-percpu-ipi callfuncsingle5 611: 0 0 0 0 0 0 0 0 0 0 0 0 0 0 xen-percpu-virq debug5 612: 0 0 0 0 0 2335 0 0 0 0 0 0 0 0 xen-percpu-ipi callfunc5 613: 0 0 0 0 0 60353 0 0 0 0 0 0 0 0 xen-percpu-ipi resched5 614: 0 0 0 0 0 323767 0 0 0 0 0 0 0 0 xen-percpu-virq timer5 615: 0 0 0 0 7381 0 0 0 0 0 0 0 0 0 xen-percpu-ipi callfuncsingle4 616: 0 0 0 0 0 0 0 0 0 0 0 0 0 0 xen-percpu-virq debug4 617: 0 0 0 0 4111 0 0 0 0 0 0 0 0 0 xen-percpu-ipi callfunc4 618: 0 0 0 0 75912 0 0 0 0 0 0 0 0 0 xen-percpu-ipi resched4 619: 0 0 0 0 398036 0 0 0 0 0 0 0 0 0 xen-percpu-virq timer4 620: 0 0 0 8603 0 0 0 0 0 0 0 0 0 0 xen-percpu-ipi callfuncsingle3 621: 0 0 0 0 0 0 0 0 0 0 0 0 0 0 xen-percpu-virq debug3 622: 0 0 0 3801 0 0 0 0 0 0 0 0 0 0 xen-percpu-ipi callfunc3 623: 0 0 0 82767 0 0 0 0 0 0 0 0 0 0 xen-percpu-ipi resched3 624: 0 0 0 451333 0 0 0 0 0 0 0 0 0 0 xen-percpu-virq timer3 625: 0 0 6532 0 0 0 0 0 0 0 0 0 0 0 xen-percpu-ipi callfuncsingle2 626: 0 0 0 0 0 0 0 0 0 0 0 0 0 0 xen-percpu-virq debug2 627: 0 0 1550 0 0 0 0 0 0 0 0 0 0 0 xen-percpu-ipi callfunc2 628: 0 0 108076 0 0 0 0 0 0 0 0 0 0 0 xen-percpu-ipi resched2 629: 0 0 641910 0 0 0 0 0 0 0 0 0 0 0 xen-percpu-virq timer2 630: 0 10103 0 0 0 0 0 0 0 0 0 0 0 0 xen-percpu-ipi callfuncsingle1 631: 0 0 0 0 0 0 0 0 0 0 0 0 0 0 xen-percpu-virq debug1 632: 0 1259 0 0 0 0 0 0 0 0 0 0 0 0 xen-percpu-ipi callfunc1 633: 0 127537 0 0 0 0 0 0 0 0 0 0 0 0 xen-percpu-ipi resched1 634: 0 914718 0 0 0 0 0 0 0 0 0 0 0 0 xen-percpu-virq timer1 635: 5077 0 0 0 0 0 0 0 0 0 0 0 0 0 xen-percpu-ipi callfuncsingle0 636: 0 0 0 0 0 0 0 0 0 0 0 0 0 0 xen-percpu-virq debug0 637: 1120 0 0 0 0 0 0 0 0 0 0 0 0 0 xen-percpu-ipi callfunc0 638: 161171 0 0 0 0 0 0 0 0 0 0 0 0 0 xen-percpu-ipi resched0 639: 1055621 0 0 0 0 0 0 0 0 0 0 0 0 0 xen-percpu-virq timer0 NMI: 0 0 0 0 0 0 0 0 0 0 0 0 0 0 Non-maskable interrupts LOC: 0 0 0 0 0 0 0 0 0 0 0 0 0 0 Local timer interrupts SPU: 0 0 0 0 0 0 0 0 0 0 0 0 0 0 Spurious interrupts PMI: 0 0 0 0 0 0 0 0 0 0 0 0 0 0 Performance monitoring interrupts PND: 0 0 0 0 0 0 0 0 0 0 0 0 0 0 Performance pending work RES: 161171 127537 108076 82767 75912 60353 56102 51311 53368 46975 47145 41650 46341 49895 Rescheduling interrupts CAL: 6197 11362 8082 12404 11492 9078 8390 7957 7744 7924 7323 7690 7436 7611 Function call interrupts TLB: 0 0 0 0 0 0 0 0 0 0 0 0 0 0 TLB shootdowns TRM: 0 0 0 0 0 0 0 0 0 0 0 0 0 0 Thermal event interrupts THR: 0 0 0 0 0 0 0 0 0 0 0 0 0 0 Threshold APIC interrupts MCE: 0 0 0 0 0 0 0 0 0 0 0 0 0 0 Machine check exceptions MCP: 0 0 0 0 0 0 0 0 0 0 0 0 0 0 Machine check polls ERR: 0 MIS: 0
We could assign different CPUs to different things, there is a report here of the 100% CPU usage by ksoftirqd happening to a CPU assigned to a ethernet interface:
- http://www.spinics.net/lists/netfilter/msg52505.html
- http://www.spinics.net/lists/netfilter/msg52550.html
I have installed:
libelf1{a} linux-tools-2.6 linux-tools-2.6.32{a}
So we can run perf top to see what it reports when there is another load spike. More on this tool here:
Here is a thread relating the ksoftirqd issue to iptables:
Which leads here:
Which says:
setting "/proc/sys/net/ipv4/xfrm4_gc_thresh" to a relatively
small (0-100 instead of 3276) solves the issue.
We have:
cat /proc/sys/net/ipv4/xfrm4_gc_thresh
2097152
Perhaps there is something in Jim's huntch that this is a firewall issue...
This post:
Suggests:
the /ksoftirqd/ issue could actually be a kernel versioning issue.
And it was introduced in 2.6.28 and looks like it was only fixed in
2.6.37.rc1. We run Debian Squeeze, which is on 2.6.32+29.
For you own viewing:
Start by reading all 'Kernel 2.6.35 and 100% S.I. CPU Time' in
http://lists.graemef.net/pipermail/lvs-users/2010-September/subject.html#start
Then move on to
http://lists.graemef.net/pipermail/lvs-users/2010-October/subject.html#start
Our kernel version:
uname -a
  Linux puffin.webarch.net 2.6.32-5-xen-amd64 #1 SMP Fri May 10 11:48:05 UTC 2013 x86_64 GNU/Linux
We could consider updating debian to Wheezy, to get a more recent kernel, see ticket:535
For now the doubling of the RAM from 4GB to 8GB and the tweaks to second.sh might have resolved the issue... (the load just went up to just over 4 and the task killing wasn't triggered...) but it is probably too soon to tell...
comment:46 Changed 3 years ago by chris
- Add Hours to Ticket changed from 0.0 to 0.4
- Total Hours changed from 14.73 to 15.13
There was just another load spike, which the server recovered from, I didn't get to a console in time to do a cat /proc/interrupts. I don't think the server stopped responding to regular users, but bots were served 503s, this is an improvement! Looking at this graph it appears that php53-fpm might have been restarted:
I think we could do with adding some debugging stuff to second.sh so we know when the "high load" things are triggered and what the values of variables when they are. I'll look at adding some things to the script later tonight or tomorrow.
Info from the latest load spike:
Email Alerts
Date: Thu, 20 Jun 2013 16:01:48 +0100 (BST)
Subject: lfd on puffin.webarch.net: High 5 minute load average alert - 9.33

Time:                    Thu Jun 20 16:01:48 2013 +0100
1 Min Load Avg:          32.35
5 Min Load Avg:          9.33
15 Min Load Avg:         3.39
Running/Total Processes: 31/309
Date: Thu, 20 Jun 2013 16:03:14 +0100
Subject: puffin.transitionnetwork.org Munin Alert

transitionnetwork.org :: puffin.transitionnetwork.org :: Load average
        CRITICALs: load is 17.35 (outside range [:8]).
Date: Thu, 20 Jun 2013 16:06:14 +0100
Subject: puffin.transitionnetwork.org Munin Alert

transitionnetwork.org :: puffin.transitionnetwork.org :: Load average
        CRITICALs: load is 9.74 (outside range [:8]).
Date: Thu, 20 Jun 2013 16:09:14 +0100
Subject: puffin.transitionnetwork.org Munin Alert

transitionnetwork.org :: puffin.transitionnetwork.org :: Load average
        WARNINGs: load is 5.66 (outside range [:4]).
Date: Thu, 20 Jun 2013 16:12:14 +0100
Subject: puffin.transitionnetwork.org Munin Alert

transitionnetwork.org :: puffin.transitionnetwork.org :: Load average
        OKs: load is 3.37.
Logs
Entries in the /var/log/php/php53-fpm-error.log:
[20-Jun-2013 16:00:40] WARNING: [pool www] child 54783, script '/data/disk/tn/static/transition-network-d6-p005/index.php' (request: "GET /index.php") executing too slow (36.367681 sec), logging
[20-Jun-2013 16:00:40] WARNING: [pool www] child 33601, script '/data/disk/tn/static/transition-network-d6-p005/index.php' (request: "POST /index.php") executing too slow (31.116963 sec), logging
[20-Jun-2013 16:00:40] WARNING: [pool www] child 33589, script '/data/disk/tn/static/transition-network-d6-p005/index.php' (request: "GET /index.php") executing too slow (34.251771 sec), logging
[20-Jun-2013 16:00:40] WARNING: [pool www] child 33588, script '/data/disk/tn/static/transition-network-d6-p005/index.php' (request: "GET /index.php") executing too slow (34.443108 sec), logging
[20-Jun-2013 16:00:40] WARNING: [pool www] child 33587, script '/data/disk/tn/static/transition-network-d6-p005/index.php' (request: "GET /index.php") executing too slow (37.739212 sec), logging
[20-Jun-2013 16:00:40] WARNING: [pool www] child 33579, script '/data/disk/tn/static/transition-network-d6-p005/index.php' (request: "POST /index.php") executing too slow (35.045901 sec), logging
[20-Jun-2013 16:00:40] NOTICE: child 33579 stopped for tracing
[20-Jun-2013 16:00:40] NOTICE: about to trace 33579
[20-Jun-2013 16:00:40] NOTICE: finished trace of 33579
[20-Jun-2013 16:00:40] NOTICE: child 33587 stopped for tracing
[20-Jun-2013 16:00:40] NOTICE: about to trace 33587
[20-Jun-2013 16:00:40] ERROR: failed to ptrace(PEEKDATA) pid 33587: Input/output error (5)
[20-Jun-2013 16:00:45] NOTICE: finished trace of 33587
[20-Jun-2013 16:00:45] NOTICE: child 33589 stopped for tracing
[20-Jun-2013 16:00:45] NOTICE: about to trace 33589
[20-Jun-2013 16:00:45] NOTICE: finished trace of 33589
[20-Jun-2013 16:00:45] NOTICE: child 33601 stopped for tracing
[20-Jun-2013 16:00:45] NOTICE: about to trace 33601
[20-Jun-2013 16:00:45] ERROR: failed to ptrace(PEEKDATA) pid 33601: Input/output error (5)
[20-Jun-2013 16:00:46] NOTICE: finished trace of 33601
[20-Jun-2013 16:00:46] NOTICE: child 33588 stopped for tracing
[20-Jun-2013 16:00:46] NOTICE: about to trace 33588
[20-Jun-2013 16:00:46] NOTICE: finished trace of 33588
[20-Jun-2013 16:00:46] NOTICE: child 54783 stopped for tracing
[20-Jun-2013 16:00:46] NOTICE: about to trace 54783
[20-Jun-2013 16:00:47] NOTICE: finished trace of 54783
[20-Jun-2013 16:00:51] WARNING: [pool www] child 54787, script '/data/disk/tn/static/transition-network-d6-p005/index.php' (request: "GET /index.php") executing too slow (34.603425 sec), logging
[20-Jun-2013 16:00:51] WARNING: [pool www] child 33596, script '/data/disk/tn/static/transition-network-d6-p005/index.php' (request: "GET /index.php") executing too slow (38.672290 sec), logging
[20-Jun-2013 16:00:51] WARNING: [pool www] child 33593, script '/data/disk/tn/static/transition-network-d6-p005/index.php' (request: "GET /index.php") executing too slow (35.293697 sec), logging
[20-Jun-2013 16:00:51] WARNING: [pool www] child 33580, script '/data/disk/tn/static/transition-network-d6-p005/index.php' (request: "GET /index.php") executing too slow (37.488432 sec), logging
[20-Jun-2013 16:00:51] NOTICE: child 33580 stopped for tracing
[20-Jun-2013 16:00:51] NOTICE: about to trace 33580
[20-Jun-2013 16:00:51] ERROR: failed to ptrace(PEEKDATA) pid 33580: Input/output error (5)
[20-Jun-2013 16:00:52] NOTICE: finished trace of 33580
[20-Jun-2013 16:00:52] NOTICE: child 33593 stopped for tracing
[20-Jun-2013 16:00:52] NOTICE: about to trace 33593
[20-Jun-2013 16:00:52] ERROR: failed to ptrace(PEEKDATA) pid 33593: Input/output error (5)
[20-Jun-2013 16:00:53] NOTICE: finished trace of 33593
[20-Jun-2013 16:00:53] NOTICE: child 33596 stopped for tracing
[20-Jun-2013 16:00:53] NOTICE: about to trace 33596
[20-Jun-2013 16:00:54] NOTICE: finished trace of 33596
[20-Jun-2013 16:00:54] NOTICE: child 54787 stopped for tracing
[20-Jun-2013 16:00:54] NOTICE: about to trace 54787
[20-Jun-2013 16:00:54] ERROR: failed to ptrace(PEEKDATA) pid 54787: Input/output error (5)
[20-Jun-2013 16:00:54] NOTICE: finished trace of 54787
[20-Jun-2013 16:01:11] WARNING: [pool www] child 33592, script '/data/disk/tn/static/transition-network-d6-p005/index.php' (request: "GET /index.php") executing too slow (31.579042 sec), logging
[20-Jun-2013 16:01:12] NOTICE: child 33592 stopped for tracing
[20-Jun-2013 16:01:12] NOTICE: about to trace 33592
[20-Jun-2013 16:01:12] ERROR: failed to ptrace(PEEKDATA) pid 33592: Input/output error (5)
[20-Jun-2013 16:01:12] NOTICE: finished trace of 33592
[20-Jun-2013 16:01:21] WARNING: [pool www] child 33594, script '/data/disk/tn/static/transition-network-d6-p005/index.php' (request: "GET /index.php") executing too slow (37.143000 sec), logging
[20-Jun-2013 16:01:21] NOTICE: child 33594 stopped for tracing
[20-Jun-2013 16:01:21] NOTICE: about to trace 33594
[20-Jun-2013 16:01:21] ERROR: failed to ptrace(PEEKDATA) pid 33594: Input/output error (5)
[20-Jun-2013 16:01:22] NOTICE: finished trace of 33594
[20-Jun-2013 16:01:52] WARNING: [pool www] child 33605, script '/data/disk/tn/static/transition-network-d6-p005/index.php' (request: "GET /index.php") executing too slow (30.814794 sec), logging
[20-Jun-2013 16:01:52] NOTICE: child 33605 stopped for tracing
[20-Jun-2013 16:01:52] NOTICE: about to trace 33605
[20-Jun-2013 16:01:52] NOTICE: finished trace of 33605
[20-Jun-2013 16:02:12] WARNING: [pool www] child 6915, script '/data/disk/tn/static/transition-network-d6-p005/index.php' (request: "GET /index.php") executing too slow (36.627892 sec), logging
[20-Jun-2013 16:02:12] WARNING: [pool www] child 6907, script '/data/disk/tn/static/transition-network-d6-p005/index.php' (request: "GET /index.php") executing too slow (39.777419 sec), logging
[20-Jun-2013 16:02:12] NOTICE: child 6915 stopped for tracing
[20-Jun-2013 16:02:12] NOTICE: about to trace 6915
[20-Jun-2013 16:02:13] NOTICE: finished trace of 6915
[20-Jun-2013 16:02:13] NOTICE: child 6907 stopped for tracing
[20-Jun-2013 16:02:13] NOTICE: about to trace 6907
[20-Jun-2013 16:02:13] NOTICE: finished trace of 6907
[20-Jun-2013 16:02:22] WARNING: [pool www] child 6946, script '/data/disk/tn/static/transition-network-d6-p005/index.php' (request: "GET /index.php") executing too slow (33.695327 sec), logging
[20-Jun-2013 16:02:22] WARNING: [pool www] child 6945, script '/data/disk/tn/static/transition-network-d6-p005/index.php' (request: "GET /index.php") executing too slow (33.695105 sec), logging
[20-Jun-2013 16:02:22] WARNING: [pool www] child 6944, script '/data/disk/tn/static/transition-network-d6-p005/index.php' (request: "GET /index.php") executing too slow (33.730524 sec), logging
[20-Jun-2013 16:02:22] WARNING: [pool www] child 33615, script '/data/disk/tn/static/transition-network-d6-p005/index.php' (request: "GET /index.php") executing too slow (37.763802 sec), logging
[20-Jun-2013 16:02:22] WARNING: [pool www] child 33613, script '/data/disk/tn/static/transition-network-d6-p005/index.php' (request: "GET /index.php") executing too slow (33.695476 sec), logging
[20-Jun-2013 16:02:22] WARNING: [pool www] child 33610, script '/data/disk/tn/static/transition-network-d6-p005/index.php' (request: "GET /index.php") executing too slow (33.671556 sec), logging
[20-Jun-2013 16:02:22] WARNING: [pool www] child 33608, script '/data/disk/tn/static/transition-network-d6-p005/index.php' (request: "GET /index.php") executing too slow (34.599949 sec), logging
[20-Jun-2013 16:02:22] WARNING: [pool www] child 33607, script '/data/disk/tn/static/transition-network-d6-p005/index.php' (request: "GET /index.php") executing too slow (32.528014 sec), logging
[20-Jun-2013 16:02:22] WARNING: [pool www] child 33604, script '/data/disk/tn/static/transition-network-d6-p005/index.php' (request: "GET /index.php") executing too slow (33.114966 sec), logging
[20-Jun-2013 16:02:22] NOTICE: child 33608 stopped for tracing
[20-Jun-2013 16:02:22] NOTICE: about to trace 33608
[20-Jun-2013 16:02:22] NOTICE: finished trace of 33608
[20-Jun-2013 16:02:22] NOTICE: child 33615 stopped for tracing
[20-Jun-2013 16:02:22] NOTICE: about to trace 33615
[20-Jun-2013 16:02:22] ERROR: failed to ptrace(PEEKDATA) pid 33615: Input/output error (5)
[20-Jun-2013 16:02:23] NOTICE: finished trace of 33615
[20-Jun-2013 16:02:23] NOTICE: child 33604 stopped for tracing
[20-Jun-2013 16:02:23] NOTICE: about to trace 33604
[20-Jun-2013 16:02:23] NOTICE: finished trace of 33604
[20-Jun-2013 16:02:23] NOTICE: child 33607 stopped for tracing
[20-Jun-2013 16:02:23] NOTICE: about to trace 33607
[20-Jun-2013 16:02:24] NOTICE: finished trace of 33607
[20-Jun-2013 16:02:24] NOTICE: child 33610 stopped for tracing
[20-Jun-2013 16:02:24] NOTICE: about to trace 33610
[20-Jun-2013 16:02:25] NOTICE: finished trace of 33610
[20-Jun-2013 16:02:25] NOTICE: child 33613 stopped for tracing
[20-Jun-2013 16:02:25] NOTICE: about to trace 33613
[20-Jun-2013 16:02:25] NOTICE: finished trace of 33613
[20-Jun-2013 16:02:25] NOTICE: child 6944 stopped for tracing
[20-Jun-2013 16:02:25] NOTICE: about to trace 6944
[20-Jun-2013 16:02:25] NOTICE: finished trace of 6944
[20-Jun-2013 16:02:25] NOTICE: child 6945 stopped for tracing
[20-Jun-2013 16:02:25] NOTICE: about to trace 6945
[20-Jun-2013 16:02:25] NOTICE: finished trace of 6945
[20-Jun-2013 16:02:25] NOTICE: child 6946 stopped for tracing
[20-Jun-2013 16:02:25] NOTICE: about to trace 6946
[20-Jun-2013 16:02:25] NOTICE: finished trace of 6946
[20-Jun-2013 16:02:32] WARNING: [pool www] child 6938, script '/data/disk/tn/static/transition-network-d6-p005/index.php' (request: "GET /index.php") executing too slow (36.932866 sec), logging
[20-Jun-2013 16:02:32] WARNING: [pool www] child 6937, script '/data/disk/tn/static/transition-network-d6-p005/index.php' (request: "GET /index.php") executing too slow (38.457173 sec), logging
[20-Jun-2013 16:02:32] NOTICE: child 6938 stopped for tracing
[20-Jun-2013 16:02:32] NOTICE: about to trace 6938
[20-Jun-2013 16:02:32] NOTICE: finished trace of 6938
[20-Jun-2013 16:02:32] NOTICE: child 6937 stopped for tracing
[20-Jun-2013 16:02:32] NOTICE: about to trace 6937
[20-Jun-2013 16:02:32] NOTICE: finished trace of 6937
There is nothing in the daemon.log and nothing of note in the syslog.
comment:47 Changed 3 years ago by chris
- Add Hours to Ticket changed from 0.0 to 0.25
- Total Hours changed from 15.13 to 15.38
There was another load spike, again I didn't get a chance to dump /proc/interrupts:
Email Alerts
Date: Thu, 20 Jun 2013 19:01:46 +0100 (BST)
Subject: lfd on puffin.webarch.net: High 5 minute load average alert - 10.05

Time:                    Thu Jun 20 19:01:46 2013 +0100
1 Min Load Avg:          33.55
5 Min Load Avg:          10.05
15 Min Load Avg:         3.69
Running/Total Processes: 62/368
Date: Thu, 20 Jun 2013 19:02:10 +0100
Subject: puffin.transitionnetwork.org Munin Alert

transitionnetwork.org :: puffin.transitionnetwork.org :: Load average
        CRITICALs: load is 13.22 (outside range [:8]).
Date: Thu, 20 Jun 2013 19:03:14 +0100
Subject: puffin.transitionnetwork.org Munin Alert

transitionnetwork.org :: puffin.transitionnetwork.org :: Load average
        CRITICALs: load is 11.15 (outside range [:8]).
Date: Thu, 20 Jun 2013 19:06:14 +0100
Subject: puffin.transitionnetwork.org Munin Alert

transitionnetwork.org :: puffin.transitionnetwork.org :: Load average
        WARNINGs: load is 6.11 (outside range [:4]).
Date: Thu, 20 Jun 2013 19:09:14 +0100
Subject: puffin.transitionnetwork.org Munin Alert

transitionnetwork.org :: puffin.transitionnetwork.org :: Load average
        OKs: load is 3.54.
Logs
php-fpm error log:
[20-Jun-2013 19:00:31] WARNING: [pool www] seems busy (you may need to increase pm.start_servers, or pm.min/max_spare_servers), spawning 8 children, there are 7 idle, and 26 total children
[20-Jun-2013 19:00:32] WARNING: [pool www] seems busy (you may need to increase pm.start_servers, or pm.min/max_spare_servers), spawning 16 children, there are 9 idle, and 29 total children
[20-Jun-2013 19:00:39] WARNING: [pool www] child 7304, script '/data/disk/tn/static/transition-network-d6-p005/index.php' (request: "GET /index.php") executing too slow (37.312525 sec), logging
[20-Jun-2013 19:00:39] WARNING: [pool www] child 33087, script '/data/disk/tn/static/transition-network-d6-p005/index.php' (request: "GET /index.php") executing too slow (32.971690 sec), logging
[20-Jun-2013 19:00:39] WARNING: [pool www] child 8066, script '/data/disk/tn/static/transition-network-d6-p005/index.php' (request: "GET /index.php") executing too slow (30.179033 sec), logging
[20-Jun-2013 19:00:39] WARNING: [pool www] child 7543, script '/data/disk/tn/static/transition-network-d6-p005/index.php' (request: "GET /index.php") executing too slow (33.357803 sec), logging
[20-Jun-2013 19:00:39] NOTICE: child 8066 stopped for tracing
[20-Jun-2013 19:00:39] NOTICE: about to trace 8066
[20-Jun-2013 19:00:40] NOTICE: finished trace of 8066
[20-Jun-2013 19:00:40] NOTICE: child 7543 stopped for tracing
[20-Jun-2013 19:00:40] NOTICE: about to trace 7543
[20-Jun-2013 19:00:42] NOTICE: finished trace of 7543
[20-Jun-2013 19:00:42] NOTICE: child 33087 stopped for tracing
[20-Jun-2013 19:00:42] NOTICE: about to trace 33087
[20-Jun-2013 19:00:43] NOTICE: finished trace of 33087
[20-Jun-2013 19:00:43] NOTICE: child 7304 stopped for tracing
[20-Jun-2013 19:00:43] NOTICE: about to trace 7304
[20-Jun-2013 19:00:43] NOTICE: finished trace of 7304
[20-Jun-2013 19:00:49] WARNING: [pool www] child 8074, script '/data/disk/tn/static/transition-network-d6-p005/index.php' (request: "GET /index.php") executing too slow (35.430897 sec), logging
[20-Jun-2013 19:00:49] WARNING: [pool www] child 7259, script '/data/disk/tn/static/transition-network-d6-p005/index.php' (request: "GET /index.php") executing too slow (30.990784 sec), logging
[20-Jun-2013 19:00:49] WARNING: [pool www] child 6946, script '/data/disk/tn/static/transition-network-d6-p005/index.php' (request: "GET /index.php") executing too slow (35.829723 sec), logging
[20-Jun-2013 19:00:49] WARNING: [pool www] child 6944, script '/data/disk/tn/static/transition-network-d6-p005/index.php' (request: "GET /index.php") executing too slow (36.942049 sec), logging
[20-Jun-2013 19:00:49] NOTICE: child 8074 stopped for tracing
[20-Jun-2013 19:00:49] NOTICE: about to trace 8074
[20-Jun-2013 19:00:50] ERROR: failed to ptrace(PEEKDATA) pid 8074: Input/output error (5)
[20-Jun-2013 19:00:51] NOTICE: finished trace of 8074
[20-Jun-2013 19:00:51] NOTICE: child 6944 stopped for tracing
[20-Jun-2013 19:00:51] NOTICE: about to trace 6944
[20-Jun-2013 19:00:52] NOTICE: finished trace of 6944
[20-Jun-2013 19:00:52] NOTICE: child 6946 stopped for tracing
[20-Jun-2013 19:00:52] NOTICE: about to trace 6946
[20-Jun-2013 19:00:52] NOTICE: finished trace of 6946
[20-Jun-2013 19:00:52] NOTICE: child 7259 stopped for tracing
[20-Jun-2013 19:00:52] NOTICE: about to trace 7259
[20-Jun-2013 19:00:53] ERROR: failed to ptrace(PEEKDATA) pid 7259: Input/output error (5)
[20-Jun-2013 19:00:54] NOTICE: finished trace of 7259
[20-Jun-2013 19:01:00] WARNING: [pool www] child 4053, script '/data/disk/tn/static/transition-network-d6-p005/index.php' (request: "GET /index.php") executing too slow (30.609099 sec), logging
[20-Jun-2013 19:01:00] WARNING: [pool www] child 33098, script '/data/disk/tn/static/transition-network-d6-p005/index.php' (request: "GET /index.php") executing too slow (35.525960 sec), logging
[20-Jun-2013 19:01:00] WARNING: [pool www] child 8073, script '/data/disk/tn/static/transition-network-d6-p005/index.php' (request: "GET /index.php") executing too slow (30.638407 sec), logging
[20-Jun-2013 19:01:00] WARNING: [pool www] child 7158, script '/data/disk/tn/static/transition-network-d6-p005/index.php' (request: "GET /index.php") executing too slow (36.034242 sec), logging
[20-Jun-2013 19:01:00] WARNING: [pool www] child 6961, script '/data/disk/tn/static/transition-network-d6-p005/index.php' (request: "GET /index.php") executing too slow (31.711724 sec), logging
[20-Jun-2013 19:01:00] WARNING: [pool www] child 6945, script '/data/disk/tn/static/transition-network-d6-p005/index.php' (request: "GET /index.php") executing too slow (32.942187 sec), logging
[20-Jun-2013 19:01:00] NOTICE: child 6945 stopped for tracing
[20-Jun-2013 19:01:00] NOTICE: about to trace 6945
[20-Jun-2013 19:01:01] NOTICE: finished trace of 6945
[20-Jun-2013 19:01:01] NOTICE: child 6961 stopped for tracing
[20-Jun-2013 19:01:01] NOTICE: about to trace 6961
[20-Jun-2013 19:01:03] NOTICE: child 7158 stopped for tracing
[20-Jun-2013 19:01:03] NOTICE: about to trace 7158
[20-Jun-2013 19:01:04] NOTICE: finished trace of 7158
[20-Jun-2013 19:01:04] NOTICE: child 8073 stopped for tracing
[20-Jun-2013 19:01:04] NOTICE: about to trace 8073
[20-Jun-2013 19:01:06] NOTICE: finished trace of 8073
[20-Jun-2013 19:01:06] NOTICE: child 33098 stopped for tracing
[20-Jun-2013 19:01:06] NOTICE: about to trace 33098
[20-Jun-2013 19:01:07] NOTICE: finished trace of 33098
[20-Jun-2013 19:01:07] NOTICE: child 4053 stopped for tracing
[20-Jun-2013 19:01:07] NOTICE: about to trace 4053
[20-Jun-2013 19:01:08] NOTICE: finished trace of 4053
[20-Jun-2013 19:01:10] WARNING: [pool www] child 6962, script '/data/disk/tn/static/transition-network-d6-p005/index.php' (request: "GET /index.php") executing too slow (38.560128 sec), logging
[20-Jun-2013 19:01:10] NOTICE: child 6962 stopped for tracing
[20-Jun-2013 19:01:10] NOTICE: about to trace 6962
[20-Jun-2013 19:01:12] NOTICE: finished trace of 6962
[20-Jun-2013 19:01:13] WARNING: [pool www] seems busy (you may need to increase pm.start_servers, or pm.min/max_spare_servers), spawning 8 children, there are 8 idle, and 36 total children
[20-Jun-2013 19:01:14] WARNING: [pool www] seems busy (you may need to increase pm.start_servers, or pm.min/max_spare_servers), spawning 16 children, there are 9 idle, and 38 total children
[20-Jun-2013 19:01:20] WARNING: [pool www] child 33086, script '/data/disk/tn/static/transition-network-d6-p005/index.php' (request: "GET /index.php") executing too slow (31.627510 sec), logging
[20-Jun-2013 19:01:20] WARNING: [pool www] child 33083, script '/data/disk/tn/static/transition-network-d6-p005/index.php' (request: "GET /index.php") executing too slow (35.743111 sec), logging
[20-Jun-2013 19:01:20] WARNING: [pool www] child 7307, script '/data/disk/tn/static/transition-network-d6-p005/index.php' (request: "GET /index.php") executing too slow (32.171790 sec), logging
[20-Jun-2013 19:01:20] NOTICE: child 33083 stopped for tracing
[20-Jun-2013 19:01:20] NOTICE: about to trace 33083
[20-Jun-2013 19:01:22] NOTICE: finished trace of 33083
[20-Jun-2013 19:01:22] NOTICE: child 7307 stopped for tracing
[20-Jun-2013 19:01:22] NOTICE: about to trace 7307
[20-Jun-2013 19:01:24] NOTICE: finished trace of 7307
[20-Jun-2013 19:01:24] NOTICE: child 33086 stopped for tracing
[20-Jun-2013 19:01:24] NOTICE: about to trace 33086
[20-Jun-2013 19:01:26] NOTICE: finished trace of 33086
[20-Jun-2013 19:01:30] WARNING: [pool www] child 33100, script '/data/disk/tn/static/transition-network-d6-p005/index.php' (request: "GET /index.php") executing too slow (39.927719 sec), logging
[20-Jun-2013 19:01:30] WARNING: [pool www] child 33085, script '/data/disk/tn/static/transition-network-d6-p005/index.php' (request: "GET /index.php") executing too slow (37.855957 sec), logging
[20-Jun-2013 19:01:30] NOTICE: child 33085 stopped for tracing
[20-Jun-2013 19:01:30] NOTICE: about to trace 33085
[20-Jun-2013 19:01:31] NOTICE: finished trace of 33085
[20-Jun-2013 19:01:31] NOTICE: child 33100 stopped for tracing
[20-Jun-2013 19:01:31] NOTICE: about to trace 33100
[20-Jun-2013 19:01:32] ERROR: failed to ptrace(PEEKDATA) pid 33100: Input/output error (5)
[20-Jun-2013 19:01:33] NOTICE: finished trace of 33100
[20-Jun-2013 19:01:40] WARNING: [pool www] child 4059, script '/data/disk/tn/static/transition-network-d6-p005/index.php' (request: "GET /index.php") executing too slow (31.344221 sec), logging
[20-Jun-2013 19:01:40] WARNING: [pool www] child 4055, script '/data/disk/tn/static/transition-network-d6-p005/index.php' (request: "GET /index.php") executing too slow (34.783235 sec), logging
[20-Jun-2013 19:01:40] WARNING: [pool www] child 4054, script '/data/disk/tn/static/transition-network-d6-p005/index.php' (request: "GET /index.php") executing too slow (32.046578 sec), logging
[20-Jun-2013 19:01:40] WARNING: [pool www] child 7260, script '/data/disk/tn/static/transition-network-d6-p005/index.php' (request: "GET /index.php") executing too slow (36.125317 sec), logging
[20-Jun-2013 19:01:40] NOTICE: child 4059 stopped for tracing
[20-Jun-2013 19:01:40] NOTICE: about to trace 4059
[20-Jun-2013 19:01:42] NOTICE: finished trace of 4059
[20-Jun-2013 19:01:42] NOTICE: child 7260 stopped for tracing
[20-Jun-2013 19:01:42] NOTICE: about to trace 7260
[20-Jun-2013 19:01:44] NOTICE: finished trace of 7260
[20-Jun-2013 19:01:44] NOTICE: child 4054 stopped for tracing
[20-Jun-2013 19:01:44] NOTICE: about to trace 4054
[20-Jun-2013 19:01:45] NOTICE: finished trace of 4054
[20-Jun-2013 19:01:45] NOTICE: child 4055 stopped for tracing
[20-Jun-2013 19:01:45] NOTICE: about to trace 4055
[20-Jun-2013 19:01:45] ERROR: failed to ptrace(PEEKDATA) pid 4055: Input/output error (5)
[20-Jun-2013 19:01:46] NOTICE: finished trace of 4055
[20-Jun-2013 19:01:50] WARNING: [pool www] child 4110, script '/data/disk/tn/static/transition-network-d6-p005/index.php' (request: "GET /index.php") executing too slow (35.004370 sec), logging
[20-Jun-2013 19:01:50] WARNING: [pool www] child 4063, script '/data/disk/tn/static/transition-network-d6-p005/index.php' (request: "GET /index.php") executing too slow (32.482875 sec), logging
[20-Jun-2013 19:01:50] WARNING: [pool www] child 4060, script '/data/disk/tn/static/transition-network-d6-p005/index.php' (request: "GET /index.php") executing too slow (30.355311 sec), logging
[20-Jun-2013 19:01:50] NOTICE: child 4063 stopped for tracing
[20-Jun-2013 19:01:50] NOTICE: about to trace 4063
[20-Jun-2013 19:01:50] ERROR: failed to ptrace(PEEKDATA) pid 4063: Input/output error (5)
[20-Jun-2013 19:01:51] NOTICE: finished trace of 4063
[20-Jun-2013 19:01:51] NOTICE: child 4060 stopped for tracing
[20-Jun-2013 19:01:51] NOTICE: about to trace 4060
[20-Jun-2013 19:01:51] NOTICE: finished trace of 4060
[20-Jun-2013 19:01:51] NOTICE: child 4110 stopped for tracing
[20-Jun-2013 19:01:51] NOTICE: about to trace 4110
[20-Jun-2013 19:01:51] NOTICE: finished trace of 4110
[20-Jun-2013 19:02:00] WARNING: [pool www] child 4065, script '/data/disk/tn/static/transition-network-d6-p005/index.php' (request: "GET /index.php") executing too slow (32.068884 sec), logging
[20-Jun-2013 19:02:00] NOTICE: child 4065 stopped for tracing
[20-Jun-2013 19:02:00] NOTICE: about to trace 4065
[20-Jun-2013 19:02:00] ERROR: failed to ptrace(PEEKDATA) pid 4065: Input/output error (5)
[20-Jun-2013 19:02:00] NOTICE: finished trace of 4065
I'm now going to look at adding some extra things to second.sh to give up some more data about the load spikes.
comment:48 Changed 3 years ago by chris
- Add Hours to Ticket changed from 0.0 to 0.25
- Total Hours changed from 15.38 to 15.63
That last comment should have been submitted 15 mins ago.
I have made some additions to second.sh to dump some extra info to /var/log/high-load.log, specifically the bits between # start additions and # end additions:
#!/bin/bash

SHELL=/bin/bash
PATH=/usr/local/sbin:/usr/local/bin:/opt/local/bin:/usr/sbin:/usr/bin:/sbin:/bin

hold()
{
  # start additions
  echo "====================" >> /var/log/high-load.log
  echo "php-fpm and nginx about to be killed" >> /var/log/high-load.log
  echo "ONEX_LOAD = $ONEX_LOAD" >> /var/log/high-load.log
  echo "FIVX_LOAD = $FIVX_LOAD" >> /var/log/high-load.log
  echo "uptime : " >> /var/log/high-load.log
  uptime >> /var/log/high-load.log
  echo "cat /proc/interrupts : " >> /var/log/high-load.log
  cat /proc/interrupts >> /var/log/high-load.log
  echo "====================" >> /var/log/high-load.log
  # end additions
  /etc/init.d/nginx stop
  killall -9 nginx
  sleep 1
  killall -9 nginx
  /etc/init.d/php-fpm stop
  /etc/init.d/php53-fpm stop
  killall -9 php-fpm php-cgi
  echo load is $ONEX_LOAD:$FIVX_LOAD while maxload is $CTL_ONEX_LOAD:$CTL_FIVX_LOAD

}

terminate()
{
  if test -f /var/run/boa_run.pid ; then
    sleep 1
  else
    killall -9 php drush.php wget
  fi
}

nginx_high_load_on()
{
  # start additions
  echo "====================" >> /var/log/high-load.log
  echo "nginx high load on" >> /var/log/high-load.log
  echo "ONEX_LOAD = $ONEX_LOAD" >> /var/log/high-load.log
  echo "FIVX_LOAD = $FIVX_LOAD" >> /var/log/high-load.log
  echo "uptime : " >> /var/log/high-load.log
  uptime >> /var/log/high-load.log
  echo "cat /proc/interrupts : " >> /var/log/high-load.log
  cat /proc/interrupts >> /var/log/high-load.log
  echo "====================" >> /var/log/high-load.log
  # end additions
  mv -f /data/conf/nginx_high_load_off.conf /data/conf/nginx_high_load.conf
  /etc/init.d/nginx reload
}

nginx_high_load_off()
{
  # start additions
  echo "====================" >> /var/log/high-load.log
  echo "nginx high load off" >> /var/log/high-load.log
  echo "ONEX_LOAD = $ONEX_LOAD" >> /var/log/high-load.log
  echo "FIVX_LOAD = $FIVX_LOAD" >> /var/log/high-load.log
  echo "uptime : " >> /var/log/high-load.log
  uptime >> /var/log/high-load.log
  echo "====================" >> /var/log/high-load.log
  # end additions
  mv -f /data/conf/nginx_high_load.conf /data/conf/nginx_high_load_off.conf
  /etc/init.d/nginx reload
  echo "nginx_high_load_off" >> /var/log/high-load.log
}

control()
{
ONEX_LOAD=`awk '{print $1*100}' /proc/loadavg`
FIVX_LOAD=`awk '{print $2*100}' /proc/loadavg`
#CTL_ONEX_SPIDER_LOAD=388
#CTL_FIVX_SPIDER_LOAD=388
#CTL_ONEX_LOAD=1444
#CTL_FIVX_LOAD=888
#CTL_ONEX_LOAD_CRIT=1888
#CTL_FIVX_LOAD_CRIT=1555
CTL_ONEX_SPIDER_LOAD=1552
CTL_FIVX_SPIDER_LOAD=1552
CTL_ONEX_LOAD=5776
CTL_FIVX_LOAD=3552
CTL_ONEX_LOAD_CRIT=7552
CTL_FIVX_LOAD_CRIT=6220
if [ $ONEX_LOAD -ge $CTL_ONEX_SPIDER_LOAD ] && [ $ONEX_LOAD -lt $CTL_ONEX_LOAD ] && [ -e "/data/conf/nginx_high_load_off.conf" ] ; then
  nginx_high_load_on
elif [ $FIVX_LOAD -ge $CTL_FIVX_SPIDER_LOAD ] && [ $FIVX_LOAD -lt $CTL_FIVX_LOAD ] && [ -e "/data/conf/nginx_high_load_off.conf" ] ; then
  nginx_high_load_on
elif [ $ONEX_LOAD -lt $CTL_ONEX_SPIDER_LOAD ] && [ $FIVX_LOAD -lt $CTL_FIVX_SPIDER_LOAD ] && [ -e "/data/conf/nginx_high_load.conf" ] ; then
  nginx_high_load_off
fi
if [ $ONEX_LOAD -ge $CTL_ONEX_LOAD_CRIT ] ; then
  terminate
elif [ $FIVX_LOAD -ge $CTL_FIVX_LOAD_CRIT ] ; then
  terminate
fi
if [ $ONEX_LOAD -ge $CTL_ONEX_LOAD ] ; then
  hold
elif [ $FIVX_LOAD -ge $CTL_FIVX_LOAD ] ; then
  hold
else
  echo load is $ONEX_LOAD:$FIVX_LOAD while maxload is $CTL_ONEX_LOAD:$CTL_FIVX_LOAD
  echo ...OK now doing CTL...
  perl /var/xdrago/proc_num_ctrl.cgi
  touch /var/xdrago/log/proc_num_ctrl.done
  echo CTL done
fi
}

control
sleep 10
control
sleep 10
control
sleep 10
control
sleep 10
control
sleep 10
control
echo Done !
###EOF2013###
Next time there is a load spike we should get a better idea what happened.
comment:49 Changed 3 years ago by chris
- Add Hours to Ticket changed from 0.0 to 1.25
- Total Hours changed from 15.63 to 16.88
There were several times over night when the load was such that /var/xdrago/second.sh switched the nginx high load configuration on, the good news is that these load spikes didn't result in second.sh killing php-fpm and nginx and the site going down for 10 to 15 mins:
23:07:25 up 13:34,  2 users,  load average: 18.60, 4.61, 1.72

01:24:22 up 15:51,  0 users,  load average: 15.55, 8.88, 4.12

02:00:39 up 16:27,  0 users,  load average: 25.90, 6.44, 3.43

02:01:23 up 16:28,  0 users,  load average: 17.93, 6.78, 3.67

05:09:48 up 19:36,  0 users,  load average: 16.50, 4.67, 1.81
At these points the site will have started serving 503 errors to bots -- based on past experience it probably is bots causing the load spikes so this is reasonable and also it seems that the thresholds in second.sh (the original ones were all multiplied by 4 see ticket:555#comment:43) are perhaps on the low side, I expect the server could cope with somewhat higher loads, so I have considered re-multiplied the variables by 6 rather than 4 so we would have:
CTL_ONEX_SPIDER_LOAD=2328
CTL_FIVX_SPIDER_LOAD=2328
CTL_ONEX_LOAD=8664
CTL_FIVX_LOAD=5328
CTL_ONEX_LOAD_CRIT=11328
CTL_FIVX_LOAD_CRIT=9330
But I haven't made this change live since we are seeing, with the current values, significant numbers of php-fpm errors at most of the times when these thresholds are hit -- last night the php-fpm errors started at these times:
[20-Jun-2013 23:07:00] WARNING: [pool www] seems busy (you may need to increase pm.start_servers, or pm.min/max_spare_servers), spawning 8 children, there are 0 idle, and 27 total children
...

[21-Jun-2013 01:20:51] WARNING: [pool www] child 18789, script '/data/disk/tn/static/transition-network-d6-p005/index.php' (request: "GET /index.php") executing too slow (35.134680 sec), logging
...

[21-Jun-2013 05:09:12] WARNING: [pool www] seems busy (you may need to increase pm.start_servers, or pm.min/max_spare_servers), spawning 8 children, there are 0 idle, and 27 total children
...
There were no errors for the 2am load spikes -- this is why I think the thresholds could possibly go up somewhat.
Following is the raw data dumped into the high-load.log files that was created, I'm not sure how much use the dump of /proc/interrupts is -- I don't know how to interpret it. So I have added a dump of the output of top and ps -lA to the second.sh script like this:
  echo "top : " >> /var/log/high-load.log
  top -n 1 -b >> /var/log/high-load.log
  echo "processes : " >> /var/log/high-load.log
  ps -lA >> /var/log/high-load.log
Raw high-load.log file:
nginx_high_load_off
====================
nginx high load on
ONEX_LOAD = 1860
FIVX_LOAD = 461
uptime :
23:07:25 up 13:34, 2 users, load average: 18.60, 4.61, 1.72
cat /proc/interrupts :
CPU0 CPU1 CPU2 CPU3 CPU4 CPU5 CPU6 CPU7 CPU8 CPU9 CPU10 CPU11 CPU12 CPU13
565: 1784162 0 0 0 0 0 0 0 0 0 0 0 0 0 xen-dyn-event eth0
566: 60 0 0 0 0 0 0 0 0 0 0 0 0 0 xen-dyn-event blkif
567: 905180 0 0 0 0 0 0 0 0 0 0 0 0 0 xen-dyn-event blkif
568: 1854 0 0 0 0 0 0 0 0 0 0 0 0 0 xen-dyn-event hvc_console
569: 434 0 0 0 0 0 0 0 0 0 0 0 0 0 xen-dyn-event xenbus
570: 0 0 0 0 0 0 0 0 0 0 0 0 0 26005 xen-percpu-ipi callfuncsingle13
571: 0 0 0 0 0 0 0 0 0 0 0 0 0 0 xen-percpu-virq debug13
572: 0 0 0 0 0 0 0 0 0 0 0 0 0 6767 xen-percpu-ipi callfunc13
573: 0 0 0 0 0 0 0 0 0 0 0 0 0 227951 xen-percpu-ipi resched13
574: 0 0 0 0 0 0 0 0 0 0 0 0 0 1291581 xen-percpu-virq timer13
575: 0 0 0 0 0 0 0 0 0 0 0 0 26350 0 xen-percpu-ipi callfuncsingle12
576: 0 0 0 0 0 0 0 0 0 0 0 0 0 0 xen-percpu-virq debug12
577: 0 0 0 0 0 0 0 0 0 0 0 0 6948 0 xen-percpu-ipi callfunc12
578: 0 0 0 0 0 0 0 0 0 0 0 0 219634 0 xen-percpu-ipi resched12
579: 0 0 0 0 0 0 0 0 0 0 0 0 1174174 0 xen-percpu-virq timer12
580: 0 0 0 0 0 0 0 0 0 0 0 26401 0 0 xen-percpu-ipi callfuncsingle11
581: 0 0 0 0 0 0 0 0 0 0 0 0 0 0 xen-percpu-virq debug11
582: 0 0 0 0 0 0 0 0 0 0 0 7247 0 0 xen-percpu-ipi callfunc11
583: 0 0 0 0 0 0 0 0 0 0 0 219060 0 0 xen-percpu-ipi resched11
584: 0 0 0 0 0 0 0 0 0 0 0 1197614 0 0 xen-percpu-virq timer11
585: 0 0 0 0 0 0 0 0 0 0 26611 0 0 0 xen-percpu-ipi callfuncsingle10
586: 0 0 0 0 0 0 0 0 0 0 0 0 0 0 xen-percpu-virq debug10
587: 0 0 0 0 0 0 0 0 0 0 7423 0 0 0 xen-percpu-ipi callfunc10
588: 0 0 0 0 0 0 0 0 0 0 224488 0 0 0 xen-percpu-ipi resched10
589: 0 0 0 0 0 0 0 0 0 0 1183295 0 0 0 xen-percpu-virq timer10
590: 0 0 0 0 0 0 0 0 0 27486 0 0 0 0 xen-percpu-ipi callfuncsingle9
591: 0 0 0 0 0 0 0 0 0 0 0 0 0 0 xen-percpu-virq debug9
592: 0 0 0 0 0 0 0 0 0 7726 0 0 0 0 xen-percpu-ipi callfunc9
593: 0 0 0 0 0 0 0 0 0 230742 0 0 0 0 xen-percpu-ipi resched9
594: 0 0 0 0 0 0 0 0 0 1251364 0 0 0 0 xen-percpu-virq timer9
595: 0 0 0 0 0 0 0 0 28062 0 0 0 0 0 xen-percpu-ipi callfuncsingle8
596: 0 0 0 0 0 0 0 0 0 0 0 0 0 0 xen-percpu-virq debug8
597: 0 0 0 0 0 0 0 0 8165 0 0 0 0 0 xen-percpu-ipi callfunc8
598: 0 0 0 0 0 0 0 0 240833 0 0 0 0 0 xen-percpu-ipi resched8
599: 0 0 0 0 0 0 0 0 1293059 0 0 0 0 0 xen-percpu-virq timer8
600: 0 0 0 0 0 0 0 28893 0 0 0 0 0 0 xen-percpu-ipi callfuncsingle7
601: 0 0 0 0 0 0 0 0 0 0 0 0 0 0 xen-percpu-virq debug7
602: 0 0 0 0 0 0 0 9295 0 0 0 0 0 0 xen-percpu-ipi callfunc7
603: 0 0 0 0 0 0 0 248633 0 0 0 0 0 0 xen-percpu-ipi resched7
604: 0 0 0 0 0 0 0 1373937 0 0 0 0 0 0 xen-percpu-virq timer7
605: 0 0 0 0 0 0 30234 0 0 0 0 0 0 0 xen-percpu-ipi callfuncsingle6
606: 0 0 0 0 0 0 0 0 0 0 0 0 0 0 xen-percpu-virq debug6
607: 0 0 0 0 0 0 9368 0 0 0 0 0 0 0 xen-percpu-ipi callfunc6
608: 0 0 0 0 0 0 274551 0 0 0 0 0 0 0 xen-percpu-ipi resched6
609: 0 0 0 0 0 0 1462225 0 0 0 0 0 0 0 xen-percpu-virq timer6
610: 0 0 0 0 0 31654 0 0 0 0 0 0 0 0 xen-percpu-ipi callfuncsingle5
611: 0 0 0 0 0 0 0 0 0 0 0 0 0 0 xen-percpu-virq debug5
612: 0 0 0 0 0 10537 0 0 0 0 0 0 0 0 xen-percpu-ipi callfunc5
613: 0 0 0 0 0 283690 0 0 0 0 0 0 0 0 xen-percpu-ipi resched5
614: 0 0 0 0 0 1559405 0 0 0 0 0 0 0 0 xen-percpu-virq timer5
615: 0 0 0 0 34942 0 0 0 0 0 0 0 0 0 xen-percpu-ipi callfuncsingle4
616: 0 0 0 0 0 0 0 0 0 0 0 0 0 0 xen-percpu-virq debug4
617: 0 0 0 0 19428 0 0 0 0 0 0 0 0 0 xen-percpu-ipi callfunc4
618: 0 0 0 0 345960 0 0 0 0 0 0 0 0 0 xen-percpu-ipi resched4
619: 0 0 0 0 1848094 0 0 0 0 0 0 0 0 0 xen-percpu-virq timer4
620: 0 0 0 39952 0 0 0 0 0 0 0 0 0 0 xen-percpu-ipi callfuncsingle3
621: 0 0 0 0 0 0 0 0 0 0 0 0 0 0 xen-percpu-virq debug3
622: 0 0 0 18020 0 0 0 0 0 0 0 0 0 0 xen-percpu-ipi callfunc3
623: 0 0 0 400301 0 0 0 0 0 0 0 0 0 0 xen-percpu-ipi resched3
624: 0 0 0 2227256 0 0 0 0 0 0 0 0 0 0 xen-percpu-virq timer3
625: 0 0 28683 0 0 0 0 0 0 0 0 0 0 0 xen-percpu-ipi callfuncsingle2
626: 0 0 0 0 0 0 0 0 0 0 0 0 0 0 xen-percpu-virq debug2
627: 0 0 6529 0 0 0 0 0 0 0 0 0 0 0 xen-percpu-ipi callfunc2
628: 0 0 495137 0 0 0 0 0 0 0 0 0 0 0 xen-percpu-ipi resched2
629: 0 0 3081831 0 0 0 0 0 0 0 0 0 0 0 xen-percpu-virq timer2
630: 0 44953 0 0 0 0 0 0 0 0 0 0 0 0 xen-percpu-ipi callfuncsingle1
631: 0 0 0 0 0 0 0 0 0 0 0 0 0 0 xen-percpu-virq debug1
632: 0 5252 0 0 0 0 0 0 0 0 0 0 0 0 xen-percpu-ipi callfunc1
633: 0 572621 0 0 0 0 0 0 0 0 0 0 0 0 xen-percpu-ipi resched1
634: 0 4354146 0 0 0 0 0 0 0 0 0 0 0 0 xen-percpu-virq timer1
635: 22470 0 0 0 0 0 0 0 0 0 0 0 0 0 xen-percpu-ipi callfuncsingle0
636: 0 0 0 0 0 0 0 0 0 0 0 0 0 0 xen-percpu-virq debug0
637: 4754 0 0 0 0 0 0 0 0 0 0 0 0 0 xen-percpu-ipi callfunc0
638: 685627 0 0 0 0 0 0 0 0 0 0 0 0 0 xen-percpu-ipi resched0
639: 4955618 0 0 0 0 0 0 0 0 0 0 0 0 0 xen-percpu-virq timer0
NMI: 0 0 0 0 0 0 0 0 0 0 0 0 0 0 Non-maskable interrupts
LOC: 0 0 0 0 0 0 0 0 0 0 0 0 0 0 Local timer interrupts
SPU: 0 0 0 0 0 0 0 0 0 0 0 0 0 0 Spurious interrupts
PMI: 0 0 0 0 0 0 0 0 0 0 0 0 0 0 Performance monitoring interrupts
PND: 0 0 0 0 0 0 0 0 0 0 0 0 0 0 Performance pending work
RES: 685627 572621 495137 400301 345960 283690 274551 248633 240833 230742 224488 219060 219634 227951 Rescheduling interrupts
CAL: 27224 50205 35212 57972 54370 42191 39602 38188 36227 35212 34034 33648 33298 32772 Function call interrupts
TLB: 0 0 0 0 0 0 0 0 0 0 0 0 0 0 TLB shootdowns
TRM: 0 0 0 0 0 0 0 0 0 0 0 0 0 0 Thermal event interrupts
THR: 0 0 0 0 0 0 0 0 0 0 0 0 0 0 Threshold APIC interrupts
MCE: 0 0 0 0 0 0 0 0 0 0 0 0 0 0 Machine check exceptions
MCP: 0 0 0 0 0 0 0 0 0 0 0 0 0 0 Machine check polls
ERR: 0
MIS: 0
====================
====================
nginx high load off
ONEX_LOAD = 1376
FIVX_LOAD = 680
uptime :
23:08:31 up 13:35, 2 users, load average: 13.76, 6.80, 2.72
====================
nginx_high_load_off
====================
nginx high load on
ONEX_LOAD = 1555
FIVX_LOAD = 888
uptime :
01:24:22 up 15:51, 0 users, load average: 15.55, 8.88, 4.12
cat /proc/interrupts :
CPU0 CPU1 CPU2 CPU3 CPU4 CPU5 CPU6 CPU7 CPU8 CPU9 CPU10 CPU11 CPU12 CPU13
565: 1995500 0 0 0 0 0 0 0 0 0 0 0 0 0 xen-dyn-event eth0
566: 63 0 0 0 0 0 0 0 0 0 0 0 0 0 xen-dyn-event blkif
567: 1069795 0 0 0 0 0 0 0 0 0 0 0 0 0 xen-dyn-event blkif
568: 2044 0 0 0 0 0 0 0 0 0 0 0 0 0 xen-dyn-event hvc_console
569: 434 0 0 0 0 0 0 0 0 0 0 0 0 0 xen-dyn-event xenbus
570: 0 0 0 0 0 0 0 0 0 0 0 0 0 30449 xen-percpu-ipi callfuncsingle13
571: 0 0 0 0 0 0 0 0 0 0 0 0 0 0 xen-percpu-virq debug13
572: 0 0 0 0 0 0 0 0 0 0 0 0 0 7869 xen-percpu-ipi callfunc13
573: 0 0 0 0 0 0 0 0 0 0 0 0 0 260721 xen-percpu-ipi resched13
574: 0 0 0 0 0 0 0 0 0 0 0 0 0 1478165 xen-percpu-virq timer13
575: 0 0 0 0 0 0 0 0 0 0 0 0 30774 0 xen-percpu-ipi callfuncsingle12
576: 0 0 0 0 0 0 0 0 0 0 0 0 0 0 xen-percpu-virq debug12
577: 0 0 0 0 0 0 0 0 0 0 0 0 8121 0 xen-percpu-ipi callfunc12
578: 0 0 0 0 0 0 0 0 0 0 0 0 254737 0 xen-percpu-ipi resched12
579: 0 0 0 0 0 0 0 0 0 0 0 0 1376728 0 xen-percpu-virq timer12
580: 0 0 0 0 0 0 0 0 0 0 0 30853 0 0 xen-percpu-ipi callfuncsingle11
581: 0 0 0 0 0 0 0 0 0 0 0 0 0 0 xen-percpu-virq debug11
582: 0 0 0 0 0 0 0 0 0 0 0 8436 0 0 xen-percpu-ipi callfunc11
583: 0 0 0 0 0 0 0 0 0 0 0 251721 0 0 xen-percpu-ipi resched11
584: 0 0 0 0 0 0 0 0 0 0 0 1394406 0 0 xen-percpu-virq timer11
585: 0 0 0 0 0 0 0 0 0 0 31173 0 0 0 xen-percpu-ipi callfuncsingle10
586: 0 0 0 0 0 0 0 0 0 0 0 0 0 0 xen-percpu-virq debug10
587: 0 0 0 0 0 0 0 0 0 0 8703 0 0 0 xen-percpu-ipi callfunc10
588: 0 0 0 0 0 0 0 0 0 0 256183 0 0 0 xen-percpu-ipi resched10
589: 0 0 0 0 0 0 0 0 0 0 1368331 0 0 0 xen-percpu-virq timer10
590: 0 0 0 0 0 0 0 0 0 32216 0 0 0 0 xen-percpu-ipi callfuncsingle9
591: 0 0 0 0 0 0 0 0 0 0 0 0 0 0 xen-percpu-virq debug9
592: 0 0 0 0 0 0 0 0 0 9006 0 0 0 0 xen-percpu-ipi callfunc9
593: 0 0 0 0 0 0 0 0 0 262299 0 0 0 0 xen-percpu-ipi resched9
594: 0 0 0 0 0 0 0 0 0 1446665 0 0 0 0 xen-percpu-virq timer9
595: 0 0 0 0 0 0 0 0 32687 0 0 0 0 0 xen-percpu-ipi callfuncsingle8
596: 0 0 0 0 0 0 0 0 0 0 0 0 0 0 xen-percpu-virq debug8
597: 0 0 0 0 0 0 0 0 9629 0 0 0 0 0 xen-percpu-ipi callfunc8
598: 0 0 0 0 0 0 0 0 276355 0 0 0 0 0 xen-percpu-ipi resched8
599: 0 0 0 0 0 0 0 0 1500997 0 0 0 0 0 xen-percpu-virq timer8
600: 0 0 0 0 0 0 0 33784 0 0 0 0 0 0 xen-percpu-ipi callfuncsingle7
601: 0 0 0 0 0 0 0 0 0 0 0 0 0 0 xen-percpu-virq debug7
602: 0 0 0 0 0 0 0 10826 0 0 0 0 0 0 xen-percpu-ipi callfunc7
603: 0 0 0 0 0 0 0 285922 0 0 0 0 0 0 xen-percpu-ipi resched7
604: 0 0 0 0 0 0 0 1594024 0 0 0 0 0 0 xen-percpu-virq timer7
605: 0 0 0 0 0 0 35401 0 0 0 0 0 0 0 xen-percpu-ipi callfuncsingle6
606: 0 0 0 0 0 0 0 0 0 0 0 0 0 0 xen-percpu-virq debug6
607: 0 0 0 0 0 0 11034 0 0 0 0 0 0 0 xen-percpu-ipi callfunc6
608: 0 0 0 0 0 0 310967 0 0 0 0 0 0 0 xen-percpu-ipi resched6
609: 0 0 0 0 0 0 1672939 0 0 0 0 0 0 0 xen-percpu-virq timer6
610: 0 0 0 0 0 37500 0 0 0 0 0 0 0 0 xen-percpu-ipi callfuncsingle5
611: 0 0 0 0 0 0 0 0 0 0 0 0 0 0 xen-percpu-virq debug5
612: 0 0 0 0 0 12318 0 0 0 0 0 0 0 0 xen-percpu-ipi callfunc5
613: 0 0 0 0 0 328004 0 0 0 0 0 0 0 0 xen-percpu-ipi resched5
614: 0 0 0 0 0 1805389 0 0 0 0 0 0 0 0 xen-percpu-virq timer5
615: 0 0 0 0 40776 0 0 0 0 0 0 0 0 0 xen-percpu-ipi callfuncsingle4
616: 0 0 0 0 0 0 0 0 0 0 0 0 0 0 xen-percpu-virq debug4
617: 0 0 0 0 22784 0 0 0 0 0 0 0 0 0 xen-percpu-ipi callfunc4
618: 0 0 0 0 392575 0 0 0 0 0 0 0 0 0 xen-percpu-ipi resched4
619: 0 0 0 0 2135207 0 0 0 0 0 0 0 0 0 xen-percpu-virq timer4
620: 0 0 0 47012 0 0 0 0 0 0 0 0 0 0 xen-percpu-ipi callfuncsingle3
621: 0 0 0 0 0 0 0 0 0 0 0 0 0 0 xen-percpu-virq debug3
622: 0 0 0 21038 0 0 0 0 0 0 0 0 0 0 xen-percpu-ipi callfunc3
623: 0 0 0 456108 0 0 0 0 0 0 0 0 0 0 xen-percpu-ipi resched3
624: 0 0 0 2577954 0 0 0 0 0 0 0 0 0 0 xen-percpu-virq timer3
625: 0 0 33514 0 0 0 0 0 0 0 0 0 0 0 xen-percpu-ipi callfuncsingle2
626: 0 0 0 0 0 0 0 0 0 0 0 0 0 0 xen-percpu-virq debug2
627: 0 0 7611 0 0 0 0 0 0 0 0 0 0 0 xen-percpu-ipi callfunc2
628: 0 0 566137 0 0 0 0 0 0 0 0 0 0 0 xen-percpu-ipi resched2
629: 0 0 3564833 0 0 0 0 0 0 0 0 0 0 0 xen-percpu-virq timer2
630: 0 52771 0 0 0 0 0 0 0 0 0 0 0 0 xen-percpu-ipi callfuncsingle1
631: 0 0 0 0 0 0 0 0 0 0 0 0 0 0 xen-percpu-virq debug1
632: 0 6126 0 0 0 0 0 0 0 0 0 0 0 0 xen-percpu-ipi callfunc1
633: 0 657234 0 0 0 0 0 0 0 0 0 0 0 0 xen-percpu-ipi resched1
634: 0 5016190 0 0 0 0 0 0 0 0 0 0 0 0 xen-percpu-virq timer1
635: 26484 0 0 0 0 0 0 0 0 0 0 0 0 0 xen-percpu-ipi callfuncsingle0
636: 0 0 0 0 0 0 0 0 0 0 0 0 0 0 xen-percpu-virq debug0
637: 5594 0 0 0 0 0 0 0 0 0 0 0 0 0 xen-percpu-ipi callfunc0
638: 780994 0 0 0 0 0 0 0 0 0 0 0 0 0 xen-percpu-ipi resched0
639: 5721689 0 0 0 0 0 0 0 0 0 0 0 0 0 xen-percpu-virq timer0
NMI: 0 0 0 0 0 0 0 0 0 0 0 0 0 0 Non-maskable interrupts
LOC: 0 0 0 0 0 0 0 0 0 0 0 0 0 0 Local timer interrupts
SPU: 0 0 0 0 0 0 0 0 0 0 0 0 0 0 Spurious interrupts
PMI: 0 0 0 0 0 0 0 0 0 0 0 0 0 0 Performance monitoring interrupts
PND: 0 0 0 0 0 0 0 0 0 0 0 0 0 0 Performance pending work
RES: 780994 657234 566137 456108 392575 328004 310967 285922 276355 262299 256183 251721 254737 260721 Rescheduling interrupts
CAL: 32078 58897 41125 68050 63560 49818 46435 44610 42316 41222 39876 39289 38895 38318 Function call interrupts
TLB: 0 0 0 0 0 0 0 0 0 0 0 0 0 0 TLB shootdowns
TRM: 0 0 0 0 0 0 0 0 0 0 0 0 0 0 Thermal event interrupts
THR: 0 0 0 0 0 0 0 0 0 0 0 0 0 0 Threshold APIC interrupts
MCE: 0 0 0 0 0 0 0 0 0 0 0 0 0 0 Machine check exceptions
MCP: 0 0 0 0 0 0 0 0 0 0 0 0 0 0 Machine check polls
ERR: 0
MIS: 0
====================
====================
nginx high load off
ONEX_LOAD = 1546
FIVX_LOAD = 1097
uptime :
01:26:01 up 15:52, 0 users, load average: 15.46, 10.97, 5.37
====================
nginx_high_load_off
====================
nginx high load on
ONEX_LOAD = 2590
FIVX_LOAD = 644
uptime :
02:00:39 up 16:27, 0 users, load average: 25.90, 6.44, 3.43
cat /proc/interrupts :
CPU0 CPU1 CPU2 CPU3 CPU4 CPU5 CPU6 CPU7 CPU8 CPU9 CPU10 CPU11 CPU12 CPU13
565: 2046192 0 0 0 0 0 0 0 0 0 0 0 0 0 xen-dyn-event eth0
566: 63 0 0 0 0 0 0 0 0 0 0 0 0 0 xen-dyn-event blkif
567: 1283062 0 0 0 0 0 0 0 0 0 0 0 0 0 xen-dyn-event blkif
568: 2048 0 0 0 0 0 0 0 0 0 0 0 0 0 xen-dyn-event hvc_console
569: 434 0 0 0 0 0 0 0 0 0 0 0 0 0 xen-dyn-event xenbus
570: 0 0 0 0 0 0 0 0 0 0 0 0 0 31586 xen-percpu-ipi callfuncsingle13
571: 0 0 0 0 0 0 0 0 0 0 0 0 0 0 xen-percpu-virq debug13
572: 0 0 0 0 0 0 0 0 0 0 0 0 0 8142 xen-percpu-ipi callfunc13
573: 0 0 0 0 0 0 0 0 0 0 0 0 0 269663 xen-percpu-ipi resched13
574: 0 0 0 0 0 0 0 0 0 0 0 0 0 1530188 xen-percpu-virq timer13
575: 0 0 0 0 0 0 0 0 0 0 0 0 31960 0 xen-percpu-ipi callfuncsingle12
576: 0 0 0 0 0 0 0 0 0 0 0 0 0 0 xen-percpu-virq debug12
577: 0 0 0 0 0 0 0 0 0 0 0 0 8442 0 xen-percpu-ipi callfunc12
578: 0 0 0 0 0 0 0 0 0 0 0 0 266405 0 xen-percpu-ipi resched12
579: 0 0 0 0 0 0 0 0 0 0 0 0 1430246 0 xen-percpu-virq timer12
580: 0 0 0 0 0 0 0 0 0 0 0 32015 0 0 xen-percpu-ipi callfuncsingle11
581: 0 0 0 0 0 0 0 0 0 0 0 0 0 0 xen-percpu-virq debug11
582: 0 0 0 0 0 0 0 0 0 0 0 8790 0 0 xen-percpu-ipi callfunc11
583: 0 0 0 0 0 0 0 0 0 0 0 261470 0 0 xen-percpu-ipi resched11
584: 0 0 0 0 0 0 0 0 0 0 0 1450235 0 0 xen-percpu-virq timer11
585: 0 0 0 0 0 0 0 0 0 0 32368 0 0 0 xen-percpu-ipi callfuncsingle10
586: 0 0 0 0 0 0 0 0 0 0 0 0 0 0 xen-percpu-virq debug10
587: 0 0 0 0 0 0 0 0 0 0 9095 0 0 0 xen-percpu-ipi callfunc10
588: 0 0 0 0 0 0 0 0 0 0 265116 0 0 0 xen-percpu-ipi resched10
589: 0 0 0 0 0 0 0 0 0 0 1413617 0 0 0 xen-percpu-virq timer10
590: 0 0 0 0 0 0 0 0 0 33418 0 0 0 0 xen-percpu-ipi callfuncsingle9
591: 0 0 0 0 0 0 0 0 0 0 0 0 0 0 xen-percpu-virq debug9
592: 0 0 0 0 0 0 0 0 0 9399 0 0 0 0 xen-percpu-ipi callfunc9
593: 0 0 0 0 0 0 0 0 0 272425 0 0 0 0 xen-percpu-ipi resched9
594: 0 0 0 0 0 0 0 0 0 1491680 0 0 0 0 xen-percpu-virq timer9
595: 0 0 0 0 0 0 0 0 33999 0 0 0 0 0 xen-percpu-ipi callfuncsingle8
596: 0 0 0 0 0 0 0 0 0 0 0 0 0 0 xen-percpu-virq debug8
597: 0 0 0 0 0 0 0 0 9977 0 0 0 0 0 xen-percpu-ipi callfunc8
598: 0 0 0 0 0 0 0 0 287828 0 0 0 0 0 xen-percpu-ipi resched8
599: 0 0 0 0 0 0 0 0 1560125 0 0 0 0 0 xen-percpu-virq timer8
600: 0 0 0 0 0 0 0 35195 0 0 0 0 0 0 xen-percpu-ipi callfuncsingle7
601: 0 0 0 0 0 0 0 0 0 0 0 0 0 0 xen-percpu-virq debug7
602: 0 0 0 0 0 0 0 11249 0 0 0 0 0 0 xen-percpu-ipi callfunc7
603: 0 0 0 0 0 0 0 297309 0 0 0 0 0 0 xen-percpu-ipi resched7
604: 0 0 0 0 0 0 0 1652758 0 0 0 0 0 0 xen-percpu-virq timer7
605: 0 0 0 0 0 0 36831 0 0 0 0 0 0 0 xen-percpu-ipi callfuncsingle6
606: 0 0 0 0 0 0 0 0 0 0 0 0 0 0 xen-percpu-virq debug6
607: 0 0 0 0 0 0 11503 0 0 0 0 0 0 0 xen-percpu-ipi callfunc6
608: 0 0 0 0 0 0 323277 0 0 0 0 0 0 0 xen-percpu-ipi resched6
609: 0 0 0 0 0 0 1735526 0 0 0 0 0 0 0 xen-percpu-virq timer6
610: 0 0 0 0 0 38914 0 0 0 0 0 0 0 0 xen-percpu-ipi callfuncsingle5
611: 0 0 0 0 0 0 0 0 0 0 0 0 0 0 xen-percpu-virq debug5
612: 0 0 0 0 0 12793 0 0 0 0 0 0 0 0 xen-percpu-ipi callfunc5
613: 0 0 0 0 0 341022 0 0 0 0 0 0 0 0 xen-percpu-ipi resched5
614: 0 0 0 0 0 1874834 0 0 0 0 0 0 0 0 xen-percpu-virq timer5
615: 0 0 0 0 42273 0 0 0 0 0 0 0 0 0 xen-percpu-ipi callfuncsingle4
616: 0 0 0 0 0 0 0 0 0 0 0 0 0 0 xen-percpu-virq debug4
617: 0 0 0 0 23587 0 0 0 0 0 0 0 0 0 xen-percpu-ipi callfunc4
618: 0 0 0 0 408052 0 0 0 0 0 0 0 0 0 xen-percpu-ipi resched4
619: 0 0 0 0 2210084 0 0 0 0 0 0 0 0 0 xen-percpu-virq timer4
620: 0 0 0 48748 0 0 0 0 0 0 0 0 0 0 xen-percpu-ipi callfuncsingle3
621: 0 0 0 0 0 0 0 0 0 0 0 0 0 0 xen-percpu-virq debug3
622: 0 0 0 21775 0 0 0 0 0 0 0 0 0 0 xen-percpu-ipi callfunc3
623: 0 0 0 472951 0 0 0 0 0 0 0 0 0 0 xen-percpu-ipi resched3
624: 0 0 0 2674154 0 0 0 0 0 0 0 0 0 0 xen-percpu-virq timer3
625: 0 0 34753 0 0 0 0 0 0 0 0 0 0 0 xen-percpu-ipi callfuncsingle2
626: 0 0 0 0 0 0 0 0 0 0 0 0 0 0 xen-percpu-virq debug2
627: 0 0 7902 0 0 0 0 0 0 0 0 0 0 0 xen-percpu-ipi callfunc2
628: 0 0 588019 0 0 0 0 0 0 0 0 0 0 0 xen-percpu-ipi resched2
629: 0 0 3689556 0 0 0 0 0 0 0 0 0 0 0 xen-percpu-virq timer2
630: 0 54763 0 0 0 0 0 0 0 0 0 0 0 0 xen-percpu-ipi callfuncsingle1
631: 0 0 0 0 0 0 0 0 0 0 0 0 0 0 xen-percpu-virq debug1
632: 0 6348 0 0 0 0 0 0 0 0 0 0 0 0 xen-percpu-ipi callfunc1
633: 0 682282 0 0 0 0 0 0 0 0 0 0 0 0 xen-percpu-ipi resched1
634: 0 5198436 0 0 0 0 0 0 0 0 0 0 0 0 xen-percpu-virq timer1
635: 27410 0 0 0 0 0 0 0 0 0 0 0 0 0 xen-percpu-ipi callfuncsingle0
636: 0 0 0 0 0 0 0 0 0 0 0 0 0 0 xen-percpu-virq debug0
637: 5820 0 0 0 0 0 0 0 0 0 0 0 0 0 xen-percpu-ipi callfunc0
638: 807251 0 0 0 0 0 0 0 0 0 0 0 0 0 xen-percpu-ipi resched0
639: 5922415 0 0 0 0 0 0 0 0 0 0 0 0 0 xen-percpu-virq timer0
NMI: 0 0 0 0 0 0 0 0 0 0 0 0 0 0 Non-maskable interrupts
LOC: 0 0 0 0 0 0 0 0 0 0 0 0 0 0 Local timer interrupts
SPU: 0 0 0 0 0 0 0 0 0 0 0 0 0 0 Spurious interrupts
PMI: 0 0 0 0 0 0 0 0 0 0 0 0 0 0 Performance monitoring interrupts
PND: 0 0 0 0 0 0 0 0 0 0 0 0 0 0 Performance pending work
RES: 807251 682283 588019 472951 408052 341022 323277 297309 287828 272426 265116 261470 266405 269663 Rescheduling interrupts
CAL: 33230 61111 42655 70523 65860 51707 48334 46444 43976 42817 41463 40805 40402 39728 Function call interrupts
TLB: 0 0 0 0 0 0 0 0 0 0 0 0 0 0 TLB shootdowns
TRM: 0 0 0 0 0 0 0 0 0 0 0 0 0 0 Thermal event interrupts
THR: 0 0 0 0 0 0 0 0 0 0 0 0 0 0 Threshold APIC interrupts
MCE: 0 0 0 0 0 0 0 0 0 0 0 0 0 0 Machine check exceptions
MCP: 0 0 0 0 0 0 0 0 0 0 0 0 0 0 Machine check polls
ERR: 0
MIS: 0
====================
====================
nginx high load off
ONEX_LOAD = 1496
FIVX_LOAD = 588
uptime :
02:01:10 up 16:28, 0 users, load average: 14.96, 5.88, 3.35
====================
nginx_high_load_off
====================
nginx high load on
ONEX_LOAD = 1793
FIVX_LOAD = 678
uptime :
02:01:23 up 16:28, 0 users, load average: 17.93, 6.78, 3.67
cat /proc/interrupts :
CPU0 CPU1 CPU2 CPU3 CPU4 CPU5 CPU6 CPU7 CPU8 CPU9 CPU10 CPU11 CPU12 CPU13
565: 2047161 0 0 0 0 0 0 0 0 0 0 0 0 0 xen-dyn-event eth0
566: 63 0 0 0 0 0 0 0 0 0 0 0 0 0 xen-dyn-event blkif
567: 1283453 0 0 0 0 0 0 0 0 0 0 0 0 0 xen-dyn-event blkif
568: 2048 0 0 0 0 0 0 0 0 0 0 0 0 0 xen-dyn-event hvc_console
569: 434 0 0 0 0 0 0 0 0 0 0 0 0 0 xen-dyn-event xenbus
570: 0 0 0 0 0 0 0 0 0 0 0 0 0 31627 xen-percpu-ipi callfuncsingle13
571: 0 0 0 0 0 0 0 0 0 0 0 0 0 0 xen-percpu-virq debug13
572: 0 0 0 0 0 0 0 0 0 0 0 0 0 8147 xen-percpu-ipi callfunc13
573: 0 0 0 0 0 0 0 0 0 0 0 0 0 269998 xen-percpu-ipi resched13
574: 0 0 0 0 0 0 0 0 0 0 0 0 0 1531826 xen-percpu-virq timer13
575: 0 0 0 0 0 0 0 0 0 0 0 0 32001 0 xen-percpu-ipi callfuncsingle12
576: 0 0 0 0 0 0 0 0 0 0 0 0 0 0 xen-percpu-virq debug12
577: 0 0 0 0 0 0 0 0 0 0 0 0 8443 0 xen-percpu-ipi callfunc12
578: 0 0 0 0 0 0 0 0 0 0 0 0 266989 0 xen-percpu-ipi resched12
579: 0 0 0 0 0 0 0 0 0 0 0 0 1432919 0 xen-percpu-virq timer12
580: 0 0 0 0 0 0 0 0 0 0 0 32314 0 0 xen-percpu-ipi callfuncsingle11
581: 0 0 0 0 0 0 0 0 0 0 0 0 0 0 xen-percpu-virq debug11
582: 0 0 0 0 0 0 0 0 0 0 0 8795 0 0 xen-percpu-ipi callfunc11
583: 0 0 0 0 0 0 0 0 0 0 0 261913 0 0 xen-percpu-ipi resched11
584: 0 0 0 0 0 0 0 0 0 0 0 1451460 0 0 xen-percpu-virq timer11
585: 0 0 0 0 0 0 0 0 0 0 32392 0 0 0 xen-percpu-ipi callfuncsingle10
586: 0 0 0 0 0 0 0 0 0 0 0 0 0 0 xen-percpu-virq debug10
587: 0 0 0 0 0 0 0 0 0 0 9100 0 0 0 xen-percpu-ipi callfunc10
588: 0 0 0 0 0 0 0 0 0 0 265999 0 0 0 xen-percpu-ipi resched10
589: 0 0 0 0 0 0 0 0 0 0 1416401 0 0 0 xen-percpu-virq timer10
590: 0 0 0 0 0 0 0 0 0 33436 0 0 0 0 xen-percpu-ipi callfuncsingle9
591: 0 0 0 0 0 0 0 0 0 0 0 0 0 0 xen-percpu-virq debug9
592: 0 0 0 0 0 0 0 0 0 9405 0 0 0 0 xen-percpu-ipi callfunc9
593: 0 0 0 0 0 0 0 0 0 272650 0 0 0 0 xen-percpu-ipi resched9
594: 0 0 0 0 0 0 0 0 0 1492937 0 0 0 0 xen-percpu-virq timer9
595: 0 0 0 0 0 0 0 0 34046 0 0 0 0 0 xen-percpu-ipi callfuncsingle8
596: 0 0 0 0 0 0 0 0 0 0 0 0 0 0 xen-percpu-virq debug8
597: 0 0 0 0 0 0 0 0 9984 0 0 0 0 0 xen-percpu-ipi callfunc8
598: 0 0 0 0 0 0 0 0 288262 0 0 0 0 0 xen-percpu-ipi resched8
599: 0 0 0 0 0 0 0 0 1561403 0 0 0 0 0 xen-percpu-virq timer8
600: 0 0 0 0 0 0 0 35258 0 0 0 0 0 0 xen-percpu-ipi callfuncsingle7
601: 0 0 0 0 0 0 0 0 0 0 0 0 0 0 xen-percpu-virq debug7
602: 0 0 0 0 0 0 0 11259 0 0 0 0 0 0 xen-percpu-ipi callfunc7
603: 0 0 0 0 0 0 0 297715 0 0 0 0 0 0 xen-percpu-ipi resched7
604: 0 0 0 0 0 0 0 1654240 0 0 0 0 0 0 xen-percpu-virq timer7
605: 0 0 0 0 0 0 36901 0 0 0 0 0 0 0 xen-percpu-ipi callfuncsingle6
606: 0 0 0 0 0 0 0 0 0 0 0 0 0 0 xen-percpu-virq debug6
607: 0 0 0 0 0 0 11511 0 0 0 0 0 0 0 xen-percpu-ipi callfunc6
608: 0 0 0 0 0 0 324057 0 0 0 0 0 0 0 xen-percpu-ipi resched6
609: 0 0 0 0 0 0 1737127 0 0 0 0 0 0 0 xen-percpu-virq timer6
610: 0 0 0 0 0 38938 0 0 0 0 0 0 0 0 xen-percpu-ipi callfuncsingle5
611: 0 0 0 0 0 0 0 0 0 0 0 0 0 0 xen-percpu-virq debug5
612: 0 0 0 0 0 12799 0 0 0 0 0 0 0 0 xen-percpu-ipi callfunc5
613: 0 0 0 0 0 341531 0 0 0 0 0 0 0 0 xen-percpu-ipi resched5
614: 0 0 0 0 0 1876790 0 0 0 0 0 0 0 0 xen-percpu-virq timer5
615: 0 0 0 0 42326 0 0 0 0 0 0 0 0 0 xen-percpu-ipi callfuncsingle4
616: 0 0 0 0 0 0 0 0 0 0 0 0 0 0 xen-percpu-virq debug4
617: 0 0 0 0 23594 0 0 0 0 0 0 0 0 0 xen-percpu-ipi callfunc4
618: 0 0 0 0 408579 0 0 0 0 0 0 0 0 0 xen-percpu-ipi resched4
619: 0 0 0 0 2211654 0 0 0 0 0 0 0 0 0 xen-percpu-virq timer4
620: 0 0 0 48791 0 0 0 0 0 0 0 0 0 0 xen-percpu-ipi callfuncsingle3
621: 0 0 0 0 0 0 0 0 0 0 0 0 0 0 xen-percpu-virq debug3
622: 0 0 0 21778 0 0 0 0 0 0 0 0 0 0 xen-percpu-ipi callfunc3
623: 0 0 0 473447 0 0 0 0 0 0 0 0 0 0 xen-percpu-ipi resched3
624: 0 0 0 2677567 0 0 0 0 0 0 0 0 0 0 xen-percpu-virq timer3
625: 0 0 34768 0 0 0 0 0 0 0 0 0 0 0 xen-percpu-ipi callfuncsingle2
626: 0 0 0 0 0 0 0 0 0 0 0 0 0 0 xen-percpu-virq debug2
627: 0 0 7903 0 0 0 0 0 0 0 0 0 0 0 xen-percpu-ipi callfunc2
628: 0 0 588486 0 0 0 0 0 0 0 0 0 0 0 xen-percpu-ipi resched2
629: 0 0 3691186 0 0 0 0 0 0 0 0 0 0 0 xen-percpu-virq timer2
630: 0 54799 0 0 0 0 0 0 0 0 0 0 0 0 xen-percpu-ipi callfuncsingle1
631: 0 0 0 0 0 0 0 0 0 0 0 0 0 0 xen-percpu-virq debug1
632: 0 6351 0 0 0 0 0 0 0 0 0 0 0 0 xen-percpu-ipi callfunc1
633: 0 682680 0 0 0 0 0 0 0 0 0 0 0 0 xen-percpu-ipi resched1
634: 0 5200423 0 0 0 0 0 0 0 0 0 0 0 0 xen-percpu-virq timer1
635: 27442 0 0 0 0 0 0 0 0 0 0 0 0 0 xen-percpu-ipi callfuncsingle0
636: 0 0 0 0 0 0 0 0 0 0 0 0 0 0 xen-percpu-virq debug0
637: 5823 0 0 0 0 0 0 0 0 0 0 0 0 0 xen-percpu-ipi callfunc0
638: 807678 0 0 0 0 0 0 0 0 0 0 0 0 0 xen-percpu-ipi resched0
639: 5925119 0 0 0 0 0 0 0 0 0 0 0 0 0 xen-percpu-virq timer0
NMI: 0 0 0 0 0 0 0 0 0 0 0 0 0 0 Non-maskable interrupts
LOC: 0 0 0 0 0 0 0 0 0 0 0 0 0 0 Local timer interrupts
SPU: 0 0 0 0 0 0 0 0 0 0 0 0 0 0 Spurious interrupts
PMI: 0 0 0 0 0 0 0 0 0 0 0 0 0 0 Performance monitoring interrupts
PND: 0 0 0 0 0 0 0 0 0 0 0 0 0 0 Performance pending work
RES: 807678 682680 588486 473447 408579 341531 324058 297715 288262 272650 265999 261913 266989 269998 Rescheduling interrupts
CAL: 33265 61150 42671 70569 65920 51737 48412 46517 44030 42841 41492 41109 40444 39774 Function call interrupts
TLB: 0 0 0 0 0 0 0 0 0 0 0 0 0 0 TLB shootdowns
TRM: 0 0 0 0 0 0 0 0 0 0 0 0 0 0 Thermal event interrupts
THR: 0 0 0 0 0 0 0 0 0 0 0 0 0 0 Threshold APIC interrupts
MCE: 0 0 0 0 0 0 0 0 0 0 0 0 0 0 Machine check exceptions
MCP: 0 0 0 0 0 0 0 0 0 0 0 0 0 0 Machine check polls
ERR: 0
MIS: 0
====================
====================
nginx high load off
ONEX_LOAD = 1526
FIVX_LOAD = 657
uptime :
02:01:33 up 16:28, 0 users, load average: 15.26, 6.57, 3.63
====================
nginx_high_load_off
====================
nginx high load on
ONEX_LOAD = 1650
FIVX_LOAD = 467
uptime :
05:09:48 up 19:36, 0 users, load average: 16.50, 4.67, 1.81
cat /proc/interrupts :
CPU0 CPU1 CPU2 CPU3 CPU4 CPU5 CPU6 CPU7 CPU8 CPU9 CPU10 CPU11 CPU12 CPU13
565: 2380435 0 0 0 0 0 0 0 0 0 0 0 0 0 xen-dyn-event eth0
566: 63 0 0 0 0 0 0 0 0 0 0 0 0 0 xen-dyn-event blkif
567: 1410789 0 0 0 0 0 0 0 0 0 0 0 0 0 xen-dyn-event blkif
568: 2082 0 0 0 0 0 0 0 0 0 0 0 0 0 xen-dyn-event hvc_console
569: 434 0 0 0 0 0 0 0 0 0 0 0 0 0 xen-dyn-event xenbus
570: 0 0 0 0 0 0 0 0 0 0 0 0 0 42456 xen-percpu-ipi callfuncsingle13
571: 0 0 0 0 0 0 0 0 0 0 0 0 0 0 xen-percpu-virq debug13
572: 0 0 0 0 0 0 0 0 0 0 0 0 0 9744 xen-percpu-ipi callfunc13
573: 0 0 0 0 0 0 0 0 0 0 0 0 0 331645 xen-percpu-ipi resched13
574: 0 0 0 0 0 0 0 0 0 0 0 0 0 1860502 xen-percpu-virq timer13
575: 0 0 0 0 0 0 0 0 0 0 0 0 41972 0 xen-percpu-ipi callfuncsingle12
576: 0 0 0 0 0 0 0 0 0 0 0 0 0 0 xen-percpu-virq debug12
577: 0 0 0 0 0 0 0 0 0 0 0 0 10145 0 xen-percpu-ipi callfunc12
578: 0 0 0 0 0 0 0 0 0 0 0 0 325265 0 xen-percpu-ipi resched12
579: 0 0 0 0 0 0 0 0 0 0 0 0 1760822 0 xen-percpu-virq timer12
580: 0 0 0 0 0 0 0 0 0 0 0 43312 0 0 xen-percpu-ipi callfuncsingle11
581: 0 0 0 0 0 0 0 0 0 0 0 0 0 0 xen-percpu-virq debug11
582: 0 0 0 0 0 0 0 0 0 0 0 10444 0 0 xen-percpu-ipi callfunc11
583: 0 0 0 0 0 0 0 0 0 0 0 323204 0 0 xen-percpu-ipi resched11
584: 0 0 0 0 0 0 0 0 0 0 0 1781544 0 0 xen-percpu-virq timer11
585: 0 0 0 0 0 0 0 0 0 0 43417 0 0 0 xen-percpu-ipi callfuncsingle10
586: 0 0 0 0 0 0 0 0 0 0 0 0 0 0 xen-percpu-virq debug10
587: 0 0 0 0 0 0 0 0 0 0 10869 0 0 0 xen-percpu-ipi callfunc10
588: 0 0 0 0 0 0 0 0 0 0 323502 0 0 0 xen-percpu-ipi resched10
589: 0 0 0 0 0 0 0 0 0 0 1740947 0 0 0 xen-percpu-virq timer10
590: 0 0 0 0 0 0 0 0 0 46241 0 0 0 0 xen-percpu-ipi callfuncsingle9
591: 0 0 0 0 0 0 0 0 0 0 0 0 0 0 xen-percpu-virq debug9
592: 0 0 0 0 0 0 0 0 0 11085 0 0 0 0 xen-percpu-ipi callfunc9
593: 0 0 0 0 0 0 0 0 0 341915 0 0 0 0 xen-percpu-ipi resched9
594: 0 0 0 0 0 0 0 0 0 1873149 0 0 0 0 xen-percpu-virq timer9
595: 0 0 0 0 0 0 0 0 44888 0 0 0 0 0 xen-percpu-ipi callfuncsingle8
596: 0 0 0 0 0 0 0 0 0 0 0 0 0 0 xen-percpu-virq debug8
597: 0 0 0 0 0 0 0 0 11936 0 0 0 0 0 xen-percpu-ipi callfunc8
598: 0 0 0 0 0 0 0 0 359589 0 0 0 0 0 xen-percpu-ipi resched8
599: 0 0 0 0 0 0 0 0 1949204 0 0 0 0 0 xen-percpu-virq timer8
600: 0 0 0 0 0 0 0 50257 0 0 0 0 0 0 xen-percpu-ipi callfuncsingle7
601: 0 0 0 0 0 0 0 0 0 0 0 0 0 0 xen-percpu-virq debug7
602: 0 0 0 0 0 0 0 13336 0 0 0 0 0 0 xen-percpu-ipi callfunc7
603: 0 0 0 0 0 0 0 368282 0 0 0 0 0 0 xen-percpu-ipi resched7
604: 0 0 0 0 0 0 0 2040586 0 0 0 0 0 0 xen-percpu-virq timer7
605: 0 0 0 0 0 0 47261 0 0 0 0 0 0 0 xen-percpu-ipi callfuncsingle6
606: 0 0 0 0 0 0 0 0 0 0 0 0 0 0 xen-percpu-virq debug6
607: 0 0 0 0 0 0 13757 0 0 0 0 0 0 0 xen-percpu-ipi callfunc6
608: 0 0 0 0 0 0 396099 0 0 0 0 0 0 0 xen-percpu-ipi resched6
609: 0 0 0 0 0 0 2120277 0 0 0 0 0 0 0 xen-percpu-virq timer6
610: 0 0 0 0 0 50513 0 0 0 0 0 0 0 0 xen-percpu-ipi callfuncsingle5
611: 0 0 0 0 0 0 0 0 0 0 0 0 0 0 xen-percpu-virq debug5
612: 0 0 0 0 0 15254 0 0 0 0 0 0 0 0 xen-percpu-ipi callfunc5
613: 0 0 0 0 0 419430 0 0 0 0 0 0 0 0 xen-percpu-ipi resched5
614: 0 0 0 0 0 2309372 0 0 0 0 0 0 0 0 xen-percpu-virq timer5
615: 0 0 0 0 56524 0 0 0 0 0 0 0 0 0 xen-percpu-ipi callfuncsingle4
616: 0 0 0 0 0 0 0 0 0 0 0 0 0 0 xen-percpu-virq debug4
617: 0 0 0 0 28146 0 0 0 0 0 0 0 0 0 xen-percpu-ipi callfunc4
618: 0 0 0 0 499245 0 0 0 0 0 0 0 0 0 xen-percpu-ipi resched4
619: 0 0 0 0 2720161 0 0 0 0 0 0 0 0 0 xen-percpu-virq timer4
620: 0 0 0 66270 0 0 0 0 0 0 0 0 0 0 xen-percpu-ipi callfuncsingle3
621: 0 0 0 0 0 0 0 0 0 0 0 0 0 0 xen-percpu-virq debug3
622: 0 0 0 25841 0 0 0 0 0 0 0 0 0 0 xen-percpu-ipi callfunc3
623: 0 0 0 578674 0 0 0 0 0 0 0 0 0 0 xen-percpu-ipi resched3
624: 0 0 0 3251638 0 0 0 0 0 0 0 0 0 0 xen-percpu-virq timer3
625: 0 0 45891 0 0 0 0 0 0 0 0 0 0 0 xen-percpu-ipi callfuncsingle2
626: 0 0 0 0 0 0 0 0 0 0 0 0 0 0 xen-percpu-virq debug2
627: 0 0 9375 0 0 0 0 0 0 0 0 0 0 0 xen-percpu-ipi callfunc2
628: 0 0 712928 0 0 0 0 0 0 0 0 0 0 0 xen-percpu-ipi resched2
629: 0 0 4438415 0 0 0 0 0 0 0 0 0 0 0 xen-percpu-virq timer2
630: 0 68953 0 0 0 0 0 0 0 0 0 0 0 0 xen-percpu-ipi callfuncsingle1
631: 0 0 0 0 0 0 0 0 0 0 0 0 0 0 xen-percpu-virq debug1
632: 0 7530 0 0 0 0 0 0 0 0 0 0 0 0 xen-percpu-ipi callfunc1
633: 0 817419 0 0 0 0 0 0 0 0 0 0 0 0 xen-percpu-ipi resched1
634: 0 6221346 0 0 0 0 0 0 0 0 0 0 0 0 xen-percpu-virq timer1
635: 38004 0 0 0 0 0 0 0 0 0 0 0 0 0 xen-percpu-ipi callfuncsingle0
636: 0 0 0 0 0 0 0 0 0 0 0 0 0 0 xen-percpu-virq debug0
637: 6948 0 0 0 0 0 0 0 0 0 0 0 0 0 xen-percpu-ipi callfunc0
638: 961089 0 0 0 0 0 0 0 0 0 0 0 0 0 xen-percpu-ipi resched0
639: 7058770 0 0 0 0 0 0 0 0 0 0 0 0 0 xen-percpu-virq timer0
NMI: 0 0 0 0 0 0 0 0 0 0 0 0 0 0 Non-maskable interrupts
LOC: 0 0 0 0 0 0 0 0 0 0 0 0 0 0 Local timer interrupts
SPU: 0 0 0 0 0 0 0 0 0 0 0 0 0 0 Spurious interrupts
PMI: 0 0 0 0 0 0 0 0 0 0 0 0 0 0 Performance monitoring interrupts
PND: 0 0 0 0 0 0 0 0 0 0 0 0 0 0 Performance pending work
RES: 961089 817419 712928 578674 499245 419430 396099 368282 359589 341915 323502 323204 325265 331645 Rescheduling interrupts
CAL: 44952 76483 55266 92111 84670 65767 61018 63593 56824 57326 54286 53756 52117 52200 Function call interrupts
TLB: 0 0 0 0 0 0 0 0 0 0 0 0 0 0 TLB shootdowns
TRM: 0 0 0 0 0 0 0 0 0 0 0 0 0 0 Thermal event interrupts
THR: 0 0 0 0 0 0 0 0 0 0 0 0 0 0 Threshold APIC interrupts
MCE: 0 0 0 0 0 0 0 0 0 0 0 0 0 0 Machine check exceptions
MCP: 0 0 0 0 0 0 0 0 0 0 0 0 0 0 Machine check polls
ERR: 0
MIS: 0
====================
====================
nginx high load off
ONEX_LOAD = 1345
FIVX_LOAD = 737
uptime :
05:10:59 up 19:37, 0 users, load average: 13.45, 7.37, 3.04
====================
nginx_high_load_off
This is the revised /var/xdrago/second.sh script, the revisions could be more elegant and I might clean them up at some point:
#!/bin/bash

SHELL=/bin/bash
PATH=/usr/local/sbin:/usr/local/bin:/opt/local/bin:/usr/sbin:/usr/bin:/sbin:/bin

hold()
{
  # start additions
  echo "====================" >> /var/log/high-load.log
  echo "php-fpm and nginx about to be killed" >> /var/log/high-load.log
  echo "ONEX_LOAD = $ONEX_LOAD" >> /var/log/high-load.log
  echo "FIVX_LOAD = $FIVX_LOAD" >> /var/log/high-load.log
  echo "uptime : " >> /var/log/high-load.log
  uptime >> /var/log/high-load.log
  echo "top : " >> /var/log/high-load.log
  top -n 1 -b >> /var/log/high-load.log
  echo "processes : " >> /var/log/high-load.log
  ps -lA >> /var/log/high-load.log
  echo "cat /proc/interrupts : " >> /var/log/high-load.log
  cat /proc/interrupts >> /var/log/high-load.log
  echo "====================" >> /var/log/high-load.log
  # end additions
  /etc/init.d/nginx stop
  killall -9 nginx
  sleep 1
  killall -9 nginx
  /etc/init.d/php-fpm stop
  /etc/init.d/php53-fpm stop
  killall -9 php-fpm php-cgi
  echo load is $ONEX_LOAD:$FIVX_LOAD while maxload is $CTL_ONEX_LOAD:$CTL_FIVX_LOAD

}

terminate()
{
  if test -f /var/run/boa_run.pid ; then
    sleep 1
  else
    killall -9 php drush.php wget
  fi
}

nginx_high_load_on()
{
  # start additions
  echo "====================" >> /var/log/high-load.log
  echo "nginx high load on" >> /var/log/high-load.log
  echo "ONEX_LOAD = $ONEX_LOAD" >> /var/log/high-load.log
  echo "FIVX_LOAD = $FIVX_LOAD" >> /var/log/high-load.log
  echo "uptime : " >> /var/log/high-load.log
  uptime >> /var/log/high-load.log
  echo "top : " >> /var/log/high-load.log
  top -n 1 -b >> /var/log/high-load.log
  echo "processes : " >> /var/log/high-load.log
  ps -lA >> /var/log/high-load.log
  echo "cat /proc/interrupts : " >> /var/log/high-load.log
  cat /proc/interrupts >> /var/log/high-load.log
  echo "====================" >> /var/log/high-load.log
  # end additions
  mv -f /data/conf/nginx_high_load_off.conf /data/conf/nginx_high_load.conf
  /etc/init.d/nginx reload
}

nginx_high_load_off()
{
  # start additions
  echo "====================" >> /var/log/high-load.log
  echo "nginx high load off" >> /var/log/high-load.log
  echo "ONEX_LOAD = $ONEX_LOAD" >> /var/log/high-load.log
  echo "FIVX_LOAD = $FIVX_LOAD" >> /var/log/high-load.log
  echo "uptime : " >> /var/log/high-load.log
  uptime >> /var/log/high-load.log
  echo "top : " >> /var/log/high-load.log
  top -n 1 -b >> /var/log/high-load.log
  echo "processes : " >> /var/log/high-load.log
  ps -lA >> /var/log/high-load.log
  echo "====================" >> /var/log/high-load.log
  # end additions
  mv -f /data/conf/nginx_high_load.conf /data/conf/nginx_high_load_off.conf
  /etc/init.d/nginx reload
  echo "nginx_high_load_off" >> /var/log/high-load.log
}

control()
{
ONEX_LOAD=`awk '{print $1*100}' /proc/loadavg`
FIVX_LOAD=`awk '{print $2*100}' /proc/loadavg`
# Original values:
#CTL_ONEX_SPIDER_LOAD=388
#CTL_FIVX_SPIDER_LOAD=388
#CTL_ONEX_LOAD=1444
#CTL_FIVX_LOAD=888
#CTL_ONEX_LOAD_CRIT=1888
#CTL_FIVX_LOAD_CRIT=1555
# x4 of original:
CTL_ONEX_SPIDER_LOAD=1552
CTL_FIVX_SPIDER_LOAD=1552
CTL_ONEX_LOAD=5776
CTL_FIVX_LOAD=3552
CTL_ONEX_LOAD_CRIT=7552
CTL_FIVX_LOAD_CRIT=6220
# x6 of original:
#CTL_ONEX_SPIDER_LOAD=2328
#CTL_FIVX_SPIDER_LOAD=2328
#CTL_ONEX_LOAD=8664
#CTL_FIVX_LOAD=5328
#CTL_ONEX_LOAD_CRIT=11328
#CTL_FIVX_LOAD_CRIT=9330
if [ $ONEX_LOAD -ge $CTL_ONEX_SPIDER_LOAD ] && [ $ONEX_LOAD -lt $CTL_ONEX_LOAD ] && [ -e "/data/conf/nginx_high_load_off.conf" ] ; then
  nginx_high_load_on
elif [ $FIVX_LOAD -ge $CTL_FIVX_SPIDER_LOAD ] && [ $FIVX_LOAD -lt $CTL_FIVX_LOAD ] && [ -e "/data/conf/nginx_high_load_off.conf" ] ; then
  nginx_high_load_on
elif [ $ONEX_LOAD -lt $CTL_ONEX_SPIDER_LOAD ] && [ $FIVX_LOAD -lt $CTL_FIVX_SPIDER_LOAD ] && [ -e "/data/conf/nginx_high_load.conf" ] ; then
  nginx_high_load_off
fi
if [ $ONEX_LOAD -ge $CTL_ONEX_LOAD_CRIT ] ; then
  terminate
elif [ $FIVX_LOAD -ge $CTL_FIVX_LOAD_CRIT ] ; then
  terminate
fi
if [ $ONEX_LOAD -ge $CTL_ONEX_LOAD ] ; then
  hold
elif [ $FIVX_LOAD -ge $CTL_FIVX_LOAD ] ; then
  hold
else
  echo load is $ONEX_LOAD:$FIVX_LOAD while maxload is $CTL_ONEX_LOAD:$CTL_FIVX_LOAD
  echo ...OK now doing CTL...
  perl /var/xdrago/proc_num_ctrl.cgi
  touch /var/xdrago/log/proc_num_ctrl.done
  echo CTL done
fi
}

control
sleep 10
control
sleep 10
control
sleep 10
control
sleep 10
control
sleep 10
control
echo Done !
###EOF2013###
The errors in the php-fpm log are much like the others pasted in other comment on this thread so I haven't added them here.
For reference following are the results of perl /usr/local/bin/mysqltuner.pl:
 >>  MySQLTuner 1.2.0 - Major Hayden <major@mhtx.net>
 >>  Bug reports, feature requests, and downloads at http://mysqltuner.com/
 >>  Run with '--help' for additional options and output filtering
[OK] Logged in using credentials from debian maintenance account.

-------- General Statistics --------------------------------------------------
[--] Skipped version check for MySQLTuner script
[OK] Currently running supported MySQL version 5.5.31-MariaDB-1~squeeze-log
[OK] Operating on 64-bit architecture

-------- Storage Engine Statistics -------------------------------------------
[--] Status: +Archive -BDB +Federated +InnoDB -ISAM -NDBCluster
[--] Data in MyISAM tables: 104M (Tables: 2)
[--] Data in InnoDB tables: 444M (Tables: 1037)
[--] Data in PERFORMANCE_SCHEMA tables: 0B (Tables: 17)
[!!] Total fragmented tables: 97

-------- Security Recommendations  -------------------------------------------
[OK] All database users have passwords assigned

-------- Performance Metrics -------------------------------------------------
[--] Up for: 1d 1h 6m 42s (5M q [60.782 qps], 148K conn, TX: 10B, RX: 880M)
[--] Reads / Writes: 86% / 14%
[--] Total buffers: 1.1G global + 13.4M per thread (75 max threads)
[OK] Maximum possible memory usage: 2.1G (26% of installed RAM)
[OK] Slow queries: 0% (35/5M)
[OK] Highest usage of available connections: 74% (56/75)
[OK] Key buffer size / total MyISAM indexes: 509.0M/93.0M
[OK] Key buffer hit rate: 98.3% (11M cached / 201K reads)
[OK] Query cache efficiency: 74.7% (3M cached / 4M selects)
[!!] Query cache prunes per day: 789637
[OK] Sorts requiring temporary tables: 2% (3K temp sorts / 148K sorts)
[!!] Joins performed without indexes: 5225
[!!] Temporary tables created on disk: 29% (53K on disk / 179K total)
[OK] Thread cache hit rate: 99% (56 created / 148K connections)
[!!] Table cache hit rate: 0% (128 open / 41K opened)
[OK] Open file limit used: 0% (4/196K)
[OK] Table locks acquired immediately: 99% (1M immediate / 1M locks)
[OK] InnoDB data size / buffer pool: 444.7M/509.0M

-------- Recommendations -----------------------------------------------------
General recommendations:
    Run OPTIMIZE TABLE to defragment tables for better performance
    Adjust your join queries to always utilize indexes
    When making adjustments, make tmp_table_size/max_heap_table_size equal
    Reduce your SELECT DISTINCT queries without LIMIT clauses
    Increase table_cache gradually to avoid file descriptor limits
Variables to adjust:
    query_cache_size (> 64M)
    join_buffer_size (> 1.0M, or always use indexes with joins)
    tmp_table_size (> 64M)
    max_heap_table_size (> 128M)
    table_cache (> 128)
comment:50 Changed 3 years ago by chris
- Add Hours to Ticket changed from 0.0 to 0.25
- Total Hours changed from 16.88 to 17.13
The top command usually displayes one line for all the CPU activity:
top - 11:47:11 up 1 day,  2:14,  1 user,  load average: 0.22, 0.29, 0.37
Tasks: 249 total,   5 running, 244 sleeping,   0 stopped,   0 zombie
Cpu(s):  0.3%us,  0.7%sy,  0.0%ni, 99.0%id,  0.0%wa,  0.0%hi,  0.0%si,  0.0%st
Mem:   8372060k total,  7650408k used,   721652k free,  2503992k buffers
Swap:  1048568k total,        0k used,  1048568k free,  2375212k cached
But we want to know what all the CPUs are doing, in interactive mode you can toggle this behaviour with 1.
To get the text dump to output this data you need to start top press 1 so all the CPUs show up, then write a config file by trying W and this will save the current configuration to $HOME/.toprc and will result on the batch mode outputting info on all the CPUs, for example:
top - 11:35:57 up 1 day,  2:02,  1 user,  load average: 0.45, 0.45, 0.46
Tasks: 238 total,   3 running, 235 sleeping,   0 stopped,   0 zombie
Cpu0  :  2.5%us,  2.3%sy,  0.0%ni, 91.3%id,  3.3%wa,  0.0%hi,  0.1%si,  0.5%st
Cpu1  :  1.9%us,  2.2%sy,  0.0%ni, 95.2%id,  0.2%wa,  0.0%hi,  0.0%si,  0.4%st
Cpu2  :  1.9%us,  1.9%sy,  0.0%ni, 95.7%id,  0.1%wa,  0.0%hi,  0.0%si,  0.4%st
Cpu3  :  1.3%us,  1.5%sy,  0.0%ni, 96.8%id,  0.1%wa,  0.0%hi,  0.0%si,  0.4%st
Cpu4  :  1.1%us,  1.3%sy,  0.0%ni, 97.0%id,  0.1%wa,  0.0%hi,  0.0%si,  0.4%st
Cpu5  :  0.9%us,  1.2%sy,  0.0%ni, 97.5%id,  0.0%wa,  0.0%hi,  0.0%si,  0.4%st
Cpu6  :  0.8%us,  1.1%sy,  0.0%ni, 97.7%id,  0.0%wa,  0.0%hi,  0.0%si,  0.4%st
Cpu7  :  0.7%us,  1.0%sy,  0.0%ni, 97.8%id,  0.0%wa,  0.0%hi,  0.0%si,  0.4%st
Cpu8  :  0.7%us,  1.0%sy,  0.0%ni, 97.9%id,  0.0%wa,  0.0%hi,  0.0%si,  0.4%st
Cpu9  :  0.7%us,  1.0%sy,  0.0%ni, 97.7%id,  0.2%wa,  0.0%hi,  0.0%si,  0.4%st
Cpu10 :  0.6%us,  0.9%sy,  0.0%ni, 98.0%id,  0.0%wa,  0.0%hi,  0.0%si,  0.4%st
Cpu11 :  0.6%us,  0.9%sy,  0.0%ni, 97.9%id,  0.1%wa,  0.0%hi,  0.0%si,  0.4%st
Cpu12 :  0.6%us,  0.9%sy,  0.0%ni, 98.0%id,  0.0%wa,  0.0%hi,  0.0%si,  0.4%st
Cpu13 :  0.7%us,  1.0%sy,  0.0%ni, 97.9%id,  0.1%wa,  0.0%hi,  0.0%si,  0.4%st
Mem:   8372060k total,  7629848k used,   742212k free,  2503360k buffers
Swap:  1048568k total,        0k used,  1048568k free,  2367916k cached
I spent some time reading the top man page so that when we next have a load spike we should get to see the state of all the CPUs on the high-load.log file.
comment:51 Changed 3 years ago by chris
- Add Hours to Ticket changed from 0.0 to 0.35
- Total Hours changed from 17.13 to 17.48
I have scripted copying the nginx access log to penguin just before it they are rotated every day, I'll document this later.
The next task, for next week now, will be to process the logs on penguin using awstats, by then we will have a few days of logs to start with.
comment:52 Changed 3 years ago by chris
- Add Hours to Ticket changed from 0.0 to 2.0
- Total Hours changed from 17.48 to 19.48
Over night there have were several load spikes, the first few were ones where switching to the high load config resulted in the server recovering quite fast, the last one is more critical as the load spike was higher and nginx and php-fpm were killed resulting in around 5 mins of downtime.
Following are the first part of the output from top that was logged each time.
16:31:02
 16:31:02 up 1 day,  6:57,  2 users,  load average: 16.52, 4.73, 1.85
top :
top - 16:31:03 up 1 day,  6:57,  2 users,  load average: 16.52, 4.73, 1.85
Tasks: 274 total,  33 running, 239 sleeping,   0 stopped,   2 zombie
Cpu0  :  2.5%us,  2.3%sy,  0.0%ni, 91.5%id,  3.1%wa,  0.0%hi,  0.1%si,  0.5%st
Cpu1  :  2.0%us,  2.2%sy,  0.0%ni, 95.2%id,  0.2%wa,  0.0%hi,  0.0%si,  0.4%st
Cpu2  :  1.9%us,  1.9%sy,  0.0%ni, 95.6%id,  0.1%wa,  0.0%hi,  0.0%si,  0.4%st
Cpu3  :  1.3%us,  1.5%sy,  0.0%ni, 96.6%id,  0.1%wa,  0.0%hi,  0.0%si,  0.4%st
Cpu4  :  1.2%us,  1.4%sy,  0.0%ni, 97.0%id,  0.1%wa,  0.0%hi,  0.0%si,  0.4%st
Cpu5  :  0.9%us,  1.2%sy,  0.0%ni, 97.5%id,  0.0%wa,  0.0%hi,  0.0%si,  0.4%st
Cpu6  :  0.8%us,  1.1%sy,  0.0%ni, 97.7%id,  0.0%wa,  0.0%hi,  0.0%si,  0.4%st
Cpu7  :  0.8%us,  1.0%sy,  0.0%ni, 97.8%id,  0.0%wa,  0.0%hi,  0.0%si,  0.4%st
Cpu8  :  0.7%us,  1.0%sy,  0.0%ni, 97.8%id,  0.0%wa,  0.0%hi,  0.0%si,  0.4%st
Cpu9  :  0.7%us,  1.0%sy,  0.0%ni, 97.7%id,  0.2%wa,  0.0%hi,  0.0%si,  0.4%st
Cpu10 :  0.6%us,  0.9%sy,  0.0%ni, 98.0%id,  0.0%wa,  0.0%hi,  0.0%si,  0.4%st
Cpu11 :  0.7%us,  1.0%sy,  0.0%ni, 97.9%id,  0.1%wa,  0.0%hi,  0.0%si,  0.4%st
Cpu12 :  0.7%us,  1.0%sy,  0.0%ni, 97.9%id,  0.0%wa,  0.0%hi,  0.0%si,  0.4%st
Cpu13 :  0.7%us,  1.0%sy,  0.0%ni, 97.9%id,  0.0%wa,  0.0%hi,  0.0%si,  0.4%st
Mem:   8372060k total,  7887204k used,   484856k free,  2519720k buffers
Swap:  1048568k total,        0k used,  1048568k free,  2539488k cached

  PID USER      PR  NI  VIRT  RES  SHR S %CPU %MEM    TIME+  COMMAND
45571 www-data  20   0  774m 137m  94m R   97  1.7   5:22.81 php-fpm
17991 www-data  20   0  758m  66m  39m R   96  0.8   0:39.38 php-fpm
45603 www-data  20   0  766m 107m  72m R   91  1.3   5:52.13 php-fpm
45604 www-data  20   0  777m 110m  63m R   91  1.4   5:50.46 php-fpm
18490 www-data  20   0  739m  16m 7460 R   87  0.2   0:15.91 php-fpm
45606 www-data  20   0  772m  99m  57m R   86  1.2   5:22.92 php-fpm
45891 www-data  20   0  775m 136m  91m R   86  1.7   6:26.29 php-fpm
18965 www-data  20   0  739m  16m 7468 R   74  0.2   0:16.27 php-fpm
45574 www-data  20   0  769m  95m  56m R   64  1.2   5:57.58 php-fpm
18540 www-data  20   0  735m 8000 2640 R   56  0.1   0:02.59 php-fpm
45645 www-data  20   0  776m 119m  74m R   56  1.5   6:12.16 php-fpm
45607 www-data  20   0  779m 119m  71m R   54  1.5   5:38.10 php-fpm
45597 www-data  20   0  773m 105m  63m R   53  1.3   5:56.12 php-fpm
45906 www-data  20   0  769m 128m  89m R   53  1.6   5:13.50 php-fpm
18507 www-data  20   0  739m  16m 7460 R   51  0.2   0:12.39 php-fpm
45572 www-data  20   0  774m 101m  58m R   49  1.2   5:40.97 php-fpm
45599 www-data  20   0  779m 105m  57m R   48  1.3   6:05.59 php-fpm
45573 www-data  20   0  783m 119m  67m R   47  1.5   5:48.89 php-fpm
18495 www-data  20   0  739m  16m 7460 R   44  0.2   0:14.88 php-fpm
45646 www-data  20   0  759m  91m  62m R   43  1.1   5:28.63 php-fpm
19210 aegir     20   0  234m  25m 8748 R   12  0.3   0:00.28 drush.php
18445 root      20   0 43396 8028 1084 S    4  0.1   0:00.94 munin-node
19256 root      20   0 19200 1372  912 R    2  0.0   0:00.04 top
19278 nobody    20   0 43396 8132 1188 R    2  0.1   0:00.02 munin-node
19287 root      20   0 10376  912  768 S    2  0.0   0:00.02 awk
52877 www-data  20   0 75092  11m 1940 S    1  0.1   0:16.75 nginx
52894 www-data  20   0 75092  11m 1948 S    1  0.1   0:19.34 nginx
    1 root      20   0  8356  780  648 S    0  0.0   0:05.11 init
    2 root      20   0     0    0    0 S    0  0.0   0:00.00 kthreadd
21:57:29
 21:57:29 up 1 day, 12:24,  1 user,  load average: 18.16, 5.39, 2.02
top :
top - 21:57:30 up 1 day, 12:24,  1 user,  load average: 18.16, 5.39, 2.02
Tasks: 259 total,  27 running, 230 sleeping,   0 stopped,   2 zombie
Cpu0  :  2.5%us,  2.3%sy,  0.0%ni, 91.8%id,  2.8%wa,  0.0%hi,  0.1%si,  0.5%st
Cpu1  :  2.0%us,  2.2%sy,  0.0%ni, 95.2%id,  0.1%wa,  0.0%hi,  0.0%si,  0.4%st
Cpu2  :  1.9%us,  1.9%sy,  0.0%ni, 95.6%id,  0.1%wa,  0.0%hi,  0.0%si,  0.4%st
Cpu3  :  1.3%us,  1.5%sy,  0.0%ni, 96.7%id,  0.1%wa,  0.0%hi,  0.0%si,  0.4%st
Cpu4  :  1.1%us,  1.4%sy,  0.0%ni, 97.0%id,  0.1%wa,  0.0%hi,  0.0%si,  0.4%st
Cpu5  :  0.9%us,  1.2%sy,  0.0%ni, 97.5%id,  0.0%wa,  0.0%hi,  0.0%si,  0.4%st
Cpu6  :  0.8%us,  1.1%sy,  0.0%ni, 97.7%id,  0.0%wa,  0.0%hi,  0.0%si,  0.4%st
Cpu7  :  0.8%us,  1.1%sy,  0.0%ni, 97.8%id,  0.0%wa,  0.0%hi,  0.0%si,  0.4%st
Cpu8  :  0.7%us,  1.0%sy,  0.0%ni, 97.8%id,  0.0%wa,  0.0%hi,  0.0%si,  0.4%st
Cpu9  :  0.7%us,  1.0%sy,  0.0%ni, 97.8%id,  0.2%wa,  0.0%hi,  0.0%si,  0.4%st
Cpu10 :  0.6%us,  0.9%sy,  0.0%ni, 98.0%id,  0.0%wa,  0.0%hi,  0.0%si,  0.4%st
Cpu11 :  0.6%us,  0.9%sy,  0.0%ni, 97.9%id,  0.1%wa,  0.0%hi,  0.0%si,  0.4%st
Cpu12 :  0.7%us,  1.0%sy,  0.0%ni, 98.0%id,  0.0%wa,  0.0%hi,  0.0%si,  0.4%st
Cpu13 :  0.7%us,  1.0%sy,  0.0%ni, 97.9%id,  0.0%wa,  0.0%hi,  0.0%si,  0.4%st
Mem:   8372060k total,  8077252k used,   294808k free,  2468380k buffers
Swap:  1048568k total,        0k used,  1048568k free,  2611272k cached

  PID USER      PR  NI  VIRT  RES  SHR S %CPU %MEM    TIME+  COMMAND
50092 www-data  20   0  739m  16m 7476 R  100  0.2   0:26.70 php-fpm
49775 www-data  20   0  770m  74m  34m R   93  0.9   0:28.96 php-fpm
50127 www-data  20   0  740m  19m 9.8m R   85  0.2   0:25.75 php-fpm
50145 www-data  20   0  740m  22m  11m R   75  0.3   0:24.47 php-fpm
49766 www-data  20   0  774m  80m  37m R   73  1.0   0:32.37 php-fpm
49770 www-data  20   0  754m  55m  31m R   67  0.7   0:26.50 php-fpm
55399 www-data  20   0  766m  87m  51m R   67  1.1   1:20.79 php-fpm
49773 www-data  20   0  773m  75m  31m R   66  0.9   0:22.04 php-fpm
49780 www-data  20   0  760m  57m  27m R   66  0.7   0:29.57 php-fpm
49779 www-data  20   0  738m  15m 5752 R   64  0.2   0:10.90 php-fpm
50126 www-data  20   0  739m  16m 7476 R   62  0.2   0:19.51 php-fpm
56147 www-data  20   0  769m 147m 108m R   60  1.8   1:37.23 php-fpm
49771 www-data  20   0  770m  74m  34m R   58  0.9   0:28.96 php-fpm
50093 www-data  20   0  739m  16m 7460 R   56  0.2   0:25.06 php-fpm
55366 www-data  20   0  767m 144m 107m R   52  1.8   1:43.76 php-fpm
49778 www-data  20   0  770m  74m  34m R   48  0.9   0:31.67 php-fpm
55402 www-data  20   0  766m 102m  66m R   42  1.3   1:33.75 php-fpm
20343 www-data  20   0 75060  11m 1900 S   39  0.1   0:06.93 nginx
49776 www-data  20   0  772m  79m  36m R   37  1.0   0:25.08 php-fpm
49963 www-data  20   0  760m  59m  29m R   37  0.7   0:27.17 php-fpm
55404 www-data  20   0  767m  98m  61m R   33  1.2   1:57.49 php-fpm
50053 www-data  20   0  744m  39m  25m R   29  0.5   0:29.79 php-fpm
50155 www-data  20   0  735m 9192 3648 R   27  0.1   0:14.61 php-fpm
 3356 mysql     20   0 1908m 1.0g  10m S    6 13.0  67:13.42 mysqld
20313 www-data  20   0 75060  11m 1900 S    4  0.1   0:10.47 nginx
20334 www-data  20   0 75060  11m 1900 S    4  0.1   0:08.10 nginx
50262 root      20   0 43396 7976 1032 R    4  0.1   0:00.24 munin-node
50835 root      20   0 19200 1384  912 R    2  0.0   0:00.02 top
    1 root      20   0  8356  780  648 S    0  0.0   0:05.71 init
    2 root      20   0     0    0    0 S    0  0.0   0:00.00 kthreadd
23:01:03
 23:01:03 up 1 day, 13:27,  0 users,  load average: 28.25, 8.73, 3.37
top :
top - 23:01:04 up 1 day, 13:27,  0 users,  load average: 28.25, 8.73, 3.37
Tasks: 298 total,  37 running, 257 sleeping,   0 stopped,   4 zombie
Cpu0  :  2.5%us,  2.4%sy,  0.0%ni, 91.8%id,  2.8%wa,  0.0%hi,  0.1%si,  0.5%st
Cpu1  :  2.0%us,  2.3%sy,  0.0%ni, 95.2%id,  0.1%wa,  0.0%hi,  0.0%si,  0.4%st
Cpu2  :  1.9%us,  2.0%sy,  0.0%ni, 95.6%id,  0.1%wa,  0.0%hi,  0.0%si,  0.4%st
Cpu3  :  1.3%us,  1.6%sy,  0.0%ni, 96.6%id,  0.1%wa,  0.0%hi,  0.0%si,  0.4%st
Cpu4  :  1.1%us,  1.4%sy,  0.0%ni, 97.0%id,  0.1%wa,  0.0%hi,  0.0%si,  0.4%st
Cpu5  :  0.9%us,  1.2%sy,  0.0%ni, 97.4%id,  0.0%wa,  0.0%hi,  0.0%si,  0.4%st
Cpu6  :  0.8%us,  1.1%sy,  0.0%ni, 97.6%id,  0.0%wa,  0.0%hi,  0.0%si,  0.4%st
Cpu7  :  0.8%us,  1.1%sy,  0.0%ni, 97.7%id,  0.0%wa,  0.0%hi,  0.0%si,  0.4%st
Cpu8  :  0.7%us,  1.1%sy,  0.0%ni, 97.8%id,  0.0%wa,  0.0%hi,  0.0%si,  0.4%st
Cpu9  :  0.7%us,  1.0%sy,  0.0%ni, 97.7%id,  0.2%wa,  0.0%hi,  0.0%si,  0.4%st
Cpu10 :  0.6%us,  1.0%sy,  0.0%ni, 98.0%id,  0.0%wa,  0.0%hi,  0.0%si,  0.4%st
Cpu11 :  0.6%us,  1.0%sy,  0.0%ni, 97.9%id,  0.1%wa,  0.0%hi,  0.0%si,  0.4%st
Cpu12 :  0.7%us,  1.0%sy,  0.0%ni, 97.9%id,  0.0%wa,  0.0%hi,  0.0%si,  0.4%st
Cpu13 :  0.7%us,  1.0%sy,  0.0%ni, 97.9%id,  0.0%wa,  0.0%hi,  0.0%si,  0.4%st
Mem:   8372060k total,  7889596k used,   482464k free,  2471192k buffers
Swap:  1048568k total,        0k used,  1048568k free,  2653560k cached

  PID USER      PR  NI  VIRT  RES  SHR S %CPU %MEM    TIME+  COMMAND
 4481 www-data  20   0  760m  77m  47m R   55  0.9   1:02.28 php-fpm
 4485 www-data  20   0  764m  93m  60m R   49  1.1   1:07.65 php-fpm
 4470 www-data  20   0  769m  88m  49m R   35  1.1   1:14.21 php-fpm
 4473 www-data  20   0  774m  92m  49m R   35  1.1   1:06.79 php-fpm
 4474 www-data  20   0  768m  86m  48m R   35  1.1   0:57.78 php-fpm
31358 www-data  20   0  736m  13m 7196 R   35  0.2   0:12.86 php-fpm
31373 www-data  20   0  735m 8336 2916 R   33  0.1   0:03.32 php-fpm
50093 www-data  20   0  759m  85m  56m R   31  1.0   2:22.98 php-fpm
31354 www-data  20   0  739m  16m 7456 R   30  0.2   0:14.51 php-fpm
31371 www-data  20   0  738m  12m 3900 R   30  0.2   0:06.13 php-fpm
50145 www-data  20   0  769m  97m  58m R   30  1.2   2:28.35 php-fpm
 4478 www-data  20   0  752m  69m  48m R   29  0.9   0:58.57 php-fpm
31370 www-data  20   0  735m 8372 2948 R   29  0.1   0:03.91 php-fpm
50126 www-data  20   0  769m  87m  49m R   29  1.1   2:31.44 php-fpm
31363 www-data  20   0  739m  16m 7048 R   27  0.2   0:11.86 php-fpm
31374 www-data  20   0  735m 8292 2876 R   27  0.1   0:03.14 php-fpm
31378 www-data  20   0  735m 8120 2728 R   27  0.1   0:02.17 php-fpm
 4480 www-data  20   0  771m  89m  49m R   26  1.1   1:16.16 php-fpm
31360 www-data  20   0  736m  14m 7636 R   26  0.2   0:13.45 php-fpm
31362 www-data  20   0  738m  12m 4116 R   26  0.2   0:07.34 php-fpm
31372 www-data  20   0  735m 9128 3608 R   26  0.1   0:06.26 php-fpm
31377 www-data  20   0  735m 7884 2560 R   25  0.1   0:02.14 php-fpm
 4468 www-data  20   0  759m  76m  47m R   24  0.9   1:07.90 php-fpm
 4483 www-data  20   0  770m  98m  58m R   24  1.2   1:08.15 php-fpm
 4488 www-data  20   0  759m  77m  48m R   24  0.9   1:02.41 php-fpm
 4479 www-data  20   0  753m  89m  67m R   22  1.1   0:54.15 php-fpm
50127 www-data  20   0  767m  95m  58m R   22  1.2   2:16.62 php-fpm
52791 www-data  20   0 75052  11m 1904 R   18  0.1   0:04.02 nginx
31361 www-data  20   0  738m  12m 4108 R   17  0.2   0:06.97 php-fpm
31273 aegir     20   0  235m  25m 8768 R   14  0.3   0:21.13 drush.php
31342 www-data  20   0  736m  14m 7772 R   12  0.2   0:14.19 php-fpm
31469 aegir     20   0  224m  18m 8632 R    8  0.2   0:00.25 drush.php
 2340 ntp       20   0 38340 2168 1592 R    7  0.0   0:26.49 ntpd
31523 root      20   0 19200 1412  912 R    5  0.0   0:00.14 top
31567 root      20   0 16852 1068  868 R    2  0.0   0:00.02 tar
 2322 pdnsd     20   0  206m 1656  632 S    1  0.0   0:25.85 pdnsd
 3868 root      20   0 37176 2400 1884 S    1  0.0   0:17.73 master
31264 root      20   0 10796 1572 1180 S    1  0.0   0:00.39 backupninja
31272 root      20   0 10836 1624 1192 S    1  0.0   0:00.13 metche
31319 root      20   0 43396 8032 1088 S    1  0.1   0:00.14 munin-node
31470 root      20   0 10660 1384 1124 S    1  0.0   0:00.01 bash
31484 root      20   0 10684 1424 1144 S    1  0.0   0:00.02 bash
31576 root      20   0 13288  712  416 R    1  0.0   0:00.01 bzip2
31596 root      20   0     0    0    0 Z    1  0.0   0:00.01 awk <defunct>
31597 root      20   0  3956  592  496 S    1  0.0   0:00.01 mysql_slowqueri
    1 root      20   0  8356  780  648 S    0  0.0   0:05.81 init
    2 root      20   0     0    0    0 S    0  0.0   0:00.00 kthreadd
    3 root      RT   0     0    0    0 S    0  0.0   0:29.00 migration/0
23:07:32
 23:07:32 up 1 day, 13:34,  0 users,  load average: 27.50, 18.11, 10.43
top :
top - 23:07:33 up 1 day, 13:34,  0 users,  load average: 27.50, 18.11, 10.43
Tasks: 289 total,  56 running, 233 sleeping,   0 stopped,   0 zombie
Cpu0  :  2.5%us,  2.4%sy,  0.0%ni, 91.7%id,  2.8%wa,  0.0%hi,  0.1%si,  0.5%st
Cpu1  :  2.0%us,  2.3%sy,  0.0%ni, 95.1%id,  0.1%wa,  0.0%hi,  0.0%si,  0.5%st
Cpu2  :  1.9%us,  2.0%sy,  0.0%ni, 95.5%id,  0.1%wa,  0.0%hi,  0.0%si,  0.5%st
Cpu3  :  1.3%us,  1.6%sy,  0.0%ni, 96.6%id,  0.1%wa,  0.0%hi,  0.0%si,  0.5%st
Cpu4  :  1.1%us,  1.4%sy,  0.0%ni, 96.9%id,  0.1%wa,  0.0%hi,  0.0%si,  0.5%st
Cpu5  :  0.9%us,  1.3%sy,  0.0%ni, 97.3%id,  0.0%wa,  0.0%hi,  0.0%si,  0.4%st
Cpu6  :  0.8%us,  1.2%sy,  0.0%ni, 97.5%id,  0.0%wa,  0.0%hi,  0.0%si,  0.4%st
Cpu7  :  0.8%us,  1.1%sy,  0.0%ni, 97.7%id,  0.0%wa,  0.0%hi,  0.0%si,  0.4%st
Cpu8  :  0.7%us,  1.1%sy,  0.0%ni, 97.7%id,  0.0%wa,  0.0%hi,  0.0%si,  0.4%st
Cpu9  :  0.7%us,  1.0%sy,  0.0%ni, 97.7%id,  0.2%wa,  0.0%hi,  0.0%si,  0.4%st
Cpu10 :  0.6%us,  1.0%sy,  0.0%ni, 97.9%id,  0.0%wa,  0.0%hi,  0.0%si,  0.4%st
Cpu11 :  0.6%us,  1.0%sy,  0.0%ni, 97.8%id,  0.1%wa,  0.0%hi,  0.0%si,  0.4%st
Cpu12 :  0.7%us,  1.0%sy,  0.0%ni, 97.8%id,  0.0%wa,  0.0%hi,  0.0%si,  0.4%st
Cpu13 :  0.7%us,  1.1%sy,  0.0%ni, 97.8%id,  0.0%wa,  0.0%hi,  0.0%si,  0.4%st
Mem:   8372060k total,  7559140k used,   812920k free,  2471720k buffers
Swap:  1048568k total,        0k used,  1048568k free,  2408416k cached

  PID USER      PR  NI  VIRT  RES  SHR S %CPU %MEM    TIME+  COMMAND
37023 www-data  20   0  788m 112m  54m R   40  1.4   0:25.56 php-fpm
37039 www-data  20   0  761m  71m  39m R   36  0.9   0:24.71 php-fpm
37040 www-data  20   0  768m  78m  41m R   36  1.0   0:18.50 php-fpm
40099 www-data  20   0  735m 6748 1540 R   36  0.1   0:00.41 php-fpm
39694 www-data  20   0  735m 6956 1740 R   33  0.1   0:07.21 php-fpm
39706 www-data  20   0  735m 6928 1716 R   31  0.1   0:05.90 php-fpm
39691 www-data  20   0  735m 7788 2484 R   29  0.1   0:10.36 php-fpm
37022 www-data  20   0  758m  69m  41m R   28  0.8   0:24.13 php-fpm
37032 www-data  20   0  759m  67m  39m R   28  0.8   0:23.29 php-fpm
39421 www-data  20   0 74420  10m  992 R   28  0.1   0:09.38 nginx
37035 www-data  20   0  765m  72m  36m R   27  0.9   0:29.01 php-fpm
39700 www-data  20   0  735m 6928 1716 R   27  0.1   0:08.08 php-fpm
37026 www-data  20   0  774m  88m  42m R   25  1.1   0:22.94 php-fpm
37036 www-data  20   0  758m  62m  35m R   25  0.8   0:21.28 php-fpm
37038 www-data  20   0  768m  76m  39m R   25  0.9   0:22.01 php-fpm
39695 www-data  20   0  735m 6928 1716 R   25  0.1   0:07.05 php-fpm
39697 www-data  20   0  735m 6956 1740 R   25  0.1   0:06.80 php-fpm
37030 www-data  20   0  759m  68m  40m R   24  0.8   0:24.42 php-fpm
37041 www-data  20   0  758m  67m  40m R   24  0.8   0:22.59 php-fpm
39698 www-data  20   0  735m 6912 1708 R   24  0.1   0:06.30 php-fpm
39956 www-data  20   0  735m 6960 1740 R   24  0.1   0:05.96 php-fpm
39966 www-data  20   0  735m 6932 1716 R   24  0.1   0:07.24 php-fpm
37031 www-data  20   0  756m  64m  37m R   23  0.8   0:26.85 php-fpm
37044 www-data  20   0  750m  59m  38m R   23  0.7   0:18.09 php-fpm
37045 www-data  20   0  758m  67m  40m R   23  0.8   0:18.56 php-fpm
37047 www-data  20   0  766m  76m  40m R   23  0.9   0:17.97 php-fpm
39696 www-data  20   0  735m 6928 1716 R   23  0.1   0:06.79 php-fpm
39996 www-data  20   0  735m 6916 1704 R   23  0.1   0:02.76 php-fpm
40018 www-data  20   0  735m 6920 1708 R   23  0.1   0:02.33 php-fpm
37042 www-data  20   0  768m  78m  41m R   21  1.0   0:20.97 php-fpm
39749 www-data  20   0  735m 6928 1716 R   21  0.1   0:05.78 php-fpm
39985 www-data  20   0  735m 6908 1700 R   21  0.1   0:01.85 php-fpm
39983 www-data  20   0  735m 6916 1708 R   20  0.1   0:03.29 php-fpm
40017 www-data  20   0  735m 6936 1716 R   20  0.1   0:03.86 php-fpm
39882 www-data  20   0  735m 6932 1716 R   19  0.1   0:05.45 php-fpm
39965 www-data  20   0  735m 6908 1700 R   19  0.1   0:02.07 php-fpm
39999 www-data  20   0  735m 6920 1708 R   19  0.1   0:04.01 php-fpm
37024 www-data  20   0  766m  72m  36m R   17  0.9   0:22.42 php-fpm
37029 www-data  20   0  756m  63m  36m R   17  0.8   0:21.47 php-fpm
37046 www-data  20   0  759m  67m  39m R   17  0.8   0:26.86 php-fpm
39693 www-data  20   0  735m 6932 1716 R   17  0.1   0:09.51 php-fpm
40013 www-data  20   0  735m 6920 1708 R   17  0.1   0:02.85 php-fpm
39995 www-data  20   0  735m 6936 1716 R   16  0.1   0:01.65 php-fpm
40012 www-data  20   0  735m 6920 1708 R   16  0.1   0:03.52 php-fpm
39986 www-data  20   0  735m 6736 1532 R   13  0.1   0:00.86 php-fpm
39787 www-data  20   0  735m 6908 1700 R   11  0.1   0:04.14 php-fpm
37033 www-data  20   0  752m  59m  37m R    9  0.7   0:21.88 php-fpm
39982 www-data  20   0  735m 6860 1652 R    9  0.1   0:03.13 php-fpm
39984 www-data  20   0  735m 6788 1584 R    9  0.1   0:02.38 php-fpm
39936 www-data  20   0  735m 6932 1716 R    8  0.1   0:06.02 php-fpm
39968 www-data  20   0  735m 6932 1716 R    8  0.1   0:05.48 php-fpm
39998 www-data  20   0  735m 6920 1708 R    8  0.1   0:03.16 php-fpm
39417 www-data  20   0 74420 9.8m  800 S    7  0.1   0:04.31 nginx
39964 www-data  20   0  735m 6932 1716 R    5  0.1   0:06.88 php-fpm
 1817 root      20   0  6468  600  480 S    1  0.0   2:45.31 vnstatd
 2524 root      20   0 53372  15m 1532 S    1  0.2   6:13.17 lfd
 3356 mysql     20   0 1921m 1.0g  10m S    1 13.0  69:10.85 mysqld
40039 aegir     20   0  235m  26m 8896 S    1  0.3   0:03.03 drush.php
40196 root      20   0 19200 1404  912 R    1  0.0   0:00.03 top
    1 root      20   0  8356  780  648 S    0  0.0   0:05.82 init
    2 root      20   0     0    0    0 S    0  0.0   0:00.00 kthreadd
08:00:56
 08:00:56 up 1 day, 22:27,  0 users,  load average: 21.87, 6.02, 2.21
top :
top - 08:00:57 up 1 day, 22:27,  0 users,  load average: 21.87, 6.02, 2.21
Tasks: 269 total,  57 running, 210 sleeping,   0 stopped,   2 zombie
Cpu0  :  2.5%us,  2.4%sy,  0.0%ni, 91.2%id,  3.3%wa,  0.0%hi,  0.1%si,  0.5%st
Cpu1  :  2.0%us,  2.3%sy,  0.0%ni, 94.8%id,  0.4%wa,  0.0%hi,  0.0%si,  0.5%st
Cpu2  :  1.9%us,  2.0%sy,  0.0%ni, 95.5%id,  0.1%wa,  0.0%hi,  0.0%si,  0.5%st
Cpu3  :  1.3%us,  1.6%sy,  0.0%ni, 96.4%id,  0.3%wa,  0.0%hi,  0.0%si,  0.5%st
Cpu4  :  1.1%us,  1.4%sy,  0.0%ni, 96.9%id,  0.1%wa,  0.0%hi,  0.0%si,  0.5%st
Cpu5  :  0.9%us,  1.3%sy,  0.0%ni, 97.3%id,  0.0%wa,  0.0%hi,  0.0%si,  0.5%st
Cpu6  :  0.8%us,  1.2%sy,  0.0%ni, 97.6%id,  0.0%wa,  0.0%hi,  0.0%si,  0.4%st
Cpu7  :  0.8%us,  1.1%sy,  0.0%ni, 97.6%id,  0.1%wa,  0.0%hi,  0.0%si,  0.4%st
Cpu8  :  0.7%us,  1.1%sy,  0.0%ni, 97.7%id,  0.1%wa,  0.0%hi,  0.0%si,  0.4%st
Cpu9  :  0.7%us,  1.1%sy,  0.0%ni, 97.7%id,  0.2%wa,  0.0%hi,  0.0%si,  0.4%st
Cpu10 :  0.6%us,  1.0%sy,  0.0%ni, 97.9%id,  0.0%wa,  0.0%hi,  0.0%si,  0.4%st
Cpu11 :  0.7%us,  1.0%sy,  0.0%ni, 97.8%id,  0.1%wa,  0.0%hi,  0.0%si,  0.4%st
Cpu12 :  0.7%us,  1.0%sy,  0.0%ni, 97.8%id,  0.0%wa,  0.0%hi,  0.0%si,  0.4%st
Cpu13 :  0.7%us,  1.1%sy,  0.0%ni, 97.7%id,  0.1%wa,  0.0%hi,  0.0%si,  0.4%st
Mem:   8372060k total,  7356528k used,  1015532k free,  1851100k buffers
Swap:  1048568k total,        0k used,  1048568k free,  2433460k cached

  PID USER      PR  NI  VIRT  RES  SHR S %CPU %MEM    TIME+  COMMAND
11415 www-data  20   0  787m 203m 147m R   56  2.5   7:37.28 php-fpm
50968 www-data  20   0  739m  16m 7472 R   52  0.2   0:04.66 php-fpm
15493 www-data  20   0  769m 149m 110m R   47  1.8   9:07.38 php-fpm
50967 www-data  20   0  739m  16m 7472 R   46  0.2   0:04.06 php-fpm
13672 www-data  20   0  772m 149m 107m R   44  1.8   7:46.01 php-fpm
50978 www-data  20   0  739m  16m 7472 R   44  0.2   0:04.68 php-fpm
12691 www-data  20   0  768m 163m 125m R   41  2.0   7:42.48 php-fpm
50963 www-data  20   0  739m  16m 7472 R   41  0.2   0:04.06 php-fpm
50964 www-data  20   0  739m  16m 7472 R   41  0.2   0:04.16 php-fpm
 5695 www-data  20   0  778m 148m 101m R   40  1.8   4:12.11 php-fpm
11120 www-data  20   0  765m 142m 107m R   40  1.7   9:24.31 php-fpm
 6009 www-data  20   0  775m 130m  85m R   38  1.6   4:20.16 php-fpm
11422 www-data  20   0  770m 161m 121m R   38  2.0   7:45.76 php-fpm
50981 www-data  20   0  739m  16m 7472 R   38  0.2   0:03.97 php-fpm
50939 www-data  20   0  738m  14m 5684 R   37  0.2   0:04.94 php-fpm
50941 www-data  20   0  739m  16m 7480 R   37  0.2   0:06.56 php-fpm
50970 www-data  20   0  738m  14m 5684 R   37  0.2   0:04.11 php-fpm
14047 www-data  20   0  759m 149m 120m R   35  1.8   7:48.22 php-fpm
14433 www-data  20   0  768m 162m 125m R   35  2.0   8:14.64 php-fpm
50977 www-data  20   0  739m  16m 7472 R   35  0.2   0:04.07 php-fpm
51022 www-data  20   0  739m  16m 7472 R   35  0.2   0:04.18 php-fpm
51023 www-data  20   0  738m  12m 3904 R   35  0.2   0:02.34 php-fpm
 5686 www-data  20   0  791m 156m  96m R   34  1.9   4:12.40 php-fpm
50980 www-data  20   0  739m  16m 7472 R   34  0.2   0:04.31 php-fpm
51029 www-data  20   0  735m 6756 1540 R   34  0.1   0:01.02 php-fpm
50960 www-data  20   0  739m  16m 7472 R   32  0.2   0:04.74 php-fpm
 5696 www-data  20   0  777m 138m  91m R   29  1.7   4:33.54 php-fpm
50942 www-data  20   0  739m  16m 7472 R   29  0.2   0:05.36 php-fpm
50969 www-data  20   0  739m  16m 7472 R   29  0.2   0:04.29 php-fpm
51030 www-data  20   0  739m  15m 6208 R   28  0.2   0:03.38 php-fpm
51031 www-data  20   0  735m 6912 1700 R   28  0.1   0:01.77 php-fpm
11732 www-data  20   0  837m 222m 116m R   25  2.7   8:58.31 php-fpm
50976 www-data  20   0  739m  16m 7472 R   25  0.2   0:04.09 php-fpm
 5691 www-data  20   0  775m 134m  89m R   24  1.6   4:39.07 php-fpm
 5700 www-data  20   0  778m 137m  90m R   24  1.7   3:51.47 php-fpm
51024 www-data  20   0  738m  14m 5572 R   24  0.2   0:02.52 php-fpm
51027 www-data  20   0  735m 6912 1700 R   24  0.1   0:01.40 php-fpm
15486 www-data  20   0  779m 171m 123m R   22  2.1   8:46.50 php-fpm
16620 www-data  20   0  769m 151m 113m R   19  1.9   7:55.02 php-fpm
15496 www-data  20   0  770m 153m 113m R   18  1.9   9:36.26 php-fpm
50944 www-data  20   0  739m  16m 7472 R   13  0.2   0:04.99 php-fpm
47157 www-data  20   0 74420  10m 1928 R   12  0.1   0:09.84 nginx
27129 redis     20   0  191m  52m  920 R    3  0.6   2:53.16 redis-server
51223 root      20   0     0    0    0 R    3  0.0   0:00.02 sleep
50614 root      20   0 43396 8028 1084 S    1  0.1   0:04.77 munin-node
51227 root      20   0 19200 1384  912 R    1  0.0   0:00.02 top
    1 root      20   0  8356  780  648 S    0  0.0   0:08.74 init
    2 root      20   0     0    0    0 S    0  0.0   0:00.02 kthreadd
09:59:58
 09:59:58 up 2 days, 26 min,  1 user,  load average: 18.10, 5.17, 1.93
top :
top - 09:59:59 up 2 days, 26 min,  1 user,  load average: 18.10, 5.17, 1.93
Tasks: 266 total,  40 running, 226 sleeping,   0 stopped,   0 zombie
Cpu0  :  2.5%us,  2.4%sy,  0.0%ni, 91.3%id,  3.3%wa,  0.0%hi,  0.1%si,  0.5%st
Cpu1  :  1.9%us,  2.3%sy,  0.0%ni, 94.8%id,  0.4%wa,  0.0%hi,  0.0%si,  0.5%st
Cpu2  :  1.9%us,  2.0%sy,  0.0%ni, 95.5%id,  0.1%wa,  0.0%hi,  0.0%si,  0.5%st
Cpu3  :  1.3%us,  1.6%sy,  0.0%ni, 96.3%id,  0.3%wa,  0.0%hi,  0.0%si,  0.5%st
Cpu4  :  1.1%us,  1.5%sy,  0.0%ni, 96.9%id,  0.1%wa,  0.0%hi,  0.0%si,  0.5%st
Cpu5  :  0.9%us,  1.3%sy,  0.0%ni, 97.3%id,  0.0%wa,  0.0%hi,  0.0%si,  0.5%st
Cpu6  :  0.8%us,  1.2%sy,  0.0%ni, 97.5%id,  0.0%wa,  0.0%hi,  0.0%si,  0.4%st
Cpu7  :  0.8%us,  1.2%sy,  0.0%ni, 97.6%id,  0.1%wa,  0.0%hi,  0.0%si,  0.4%st
Cpu8  :  0.7%us,  1.1%sy,  0.0%ni, 97.6%id,  0.1%wa,  0.0%hi,  0.0%si,  0.4%st
Cpu9  :  0.7%us,  1.1%sy,  0.0%ni, 97.6%id,  0.2%wa,  0.0%hi,  0.0%si,  0.4%st
Cpu10 :  0.6%us,  1.0%sy,  0.0%ni, 97.9%id,  0.0%wa,  0.0%hi,  0.0%si,  0.4%st
Cpu11 :  0.7%us,  1.1%sy,  0.0%ni, 97.8%id,  0.1%wa,  0.0%hi,  0.0%si,  0.4%st
Cpu12 :  0.7%us,  1.1%sy,  0.0%ni, 97.8%id,  0.0%wa,  0.0%hi,  0.0%si,  0.4%st
Cpu13 :  0.7%us,  1.1%sy,  0.0%ni, 97.7%id,  0.1%wa,  0.0%hi,  0.0%si,  0.4%st
Mem:   8372060k total,  7259364k used,  1112696k free,  1821832k buffers
Swap:  1048568k total,        0k used,  1048568k free,  2483304k cached

  PID USER      PR  NI  VIRT  RES  SHR S %CPU %MEM    TIME+  COMMAND
51208 www-data  20   0  759m  81m  52m R   95  1.0   2:24.82 php-fpm
53242 www-data  20   0  764m  94m  61m R   56  1.2   2:02.07 php-fpm
51027 www-data  20   0  767m  87m  51m R   54  1.1   2:40.76 php-fpm
53626 www-data  20   0  772m 101m  58m R   54  1.2   2:11.45 php-fpm
53664 www-data  20   0  767m  96m  60m R   54  1.2   2:30.49 php-fpm
51211 www-data  20   0  767m  89m  52m R   50  1.1   2:11.54 php-fpm
51215 www-data  20   0  759m  85m  57m R   50  1.1   2:24.41 php-fpm
53077 www-data  20   0  774m 100m  56m R   50  1.2   2:10.90 php-fpm
 6240 www-data  20   0  740m  21m  10m R   49  0.3   0:23.19 php-fpm
 6248 www-data  20   0  740m  21m  10m R   49  0.3   0:20.48 php-fpm
51028 www-data  20   0  768m  93m  55m R   49  1.1   2:13.78 php-fpm
51030 www-data  20   0  770m 104m  64m R   49  1.3   2:52.08 php-fpm
53138 www-data  20   0  777m  96m  50m R   49  1.2   2:07.81 php-fpm
 6243 www-data  20   0  739m  16m 7448 R   47  0.2   0:19.16 php-fpm
 6250 www-data  20   0  739m  16m 7444 R   47  0.2   0:19.81 php-fpm
 6249 www-data  20   0  739m  16m 7448 R   45  0.2   0:19.25 php-fpm
 6253 www-data  20   0  739m  16m 7444 R   45  0.2   0:14.76 php-fpm
51026 www-data  20   0  772m  94m  52m R   45  1.2   2:10.43 php-fpm
51031 www-data  20   0  768m  90m  52m R   45  1.1   2:36.67 php-fpm
 6372 tn        20   0  258m  49m 9080 R   43  0.6   0:13.00 drush.php
51029 www-data  20   0  772m 123m  82m R   43  1.5   2:50.91 php-fpm
53340 www-data  20   0  769m  89m  50m R   43  1.1   1:57.83 php-fpm
 6252 www-data  20   0  739m  16m 7464 R   41  0.2   0:20.59 php-fpm
52759 www-data  20   0  767m  96m  59m R   40  1.2   2:15.25 php-fpm
53041 www-data  20   0  768m  95m  57m R   40  1.2   2:15.41 php-fpm
 6257 www-data  20   0  735m 8372 2952 R   36  0.1   0:03.66 php-fpm
51441 www-data  20   0  768m 100m  62m R   36  1.2   1:59.49 php-fpm
53300 www-data  20   0  762m  82m  50m R   34  1.0   2:17.06 php-fpm
51062 www-data  20   0  759m  90m  62m R   32  1.1   2:15.69 php-fpm
 6254 www-data  20   0  739m  16m 7444 R   31  0.2   0:13.16 php-fpm
 6659 root      20   0 19200 1376  912 R    2  0.0   0:00.02 top
    1 root      20   0  8356  780  648 S    0  0.0   0:09.22 init
    2 root      20   0     0    0    0 S    0  0.0   0:00.02 kthreadd
    3 root      RT   0     0    0    0 S    0  0.0   0:34.09 migration/0
11:15:58
 11:15:58 up 2 days,  1:42,  1 user,  load average: 15.80, 4.66, 1.95
top :
top - 11:15:59 up 2 days,  1:42,  1 user,  load average: 15.80, 4.66, 1.95
Tasks: 259 total,  18 running, 239 sleeping,   0 stopped,   2 zombie
Cpu0  :  2.5%us,  2.4%sy,  0.0%ni, 91.3%id,  3.2%wa,  0.0%hi,  0.1%si,  0.5%st
Cpu1  :  1.9%us,  2.4%sy,  0.0%ni, 94.8%id,  0.4%wa,  0.0%hi,  0.0%si,  0.5%st
Cpu2  :  1.9%us,  2.1%sy,  0.0%ni, 95.4%id,  0.1%wa,  0.0%hi,  0.0%si,  0.5%st
Cpu3  :  1.3%us,  1.6%sy,  0.0%ni, 96.3%id,  0.3%wa,  0.0%hi,  0.0%si,  0.5%st
Cpu4  :  1.1%us,  1.5%sy,  0.0%ni, 96.8%id,  0.1%wa,  0.0%hi,  0.0%si,  0.5%st
Cpu5  :  0.9%us,  1.3%sy,  0.0%ni, 97.2%id,  0.0%wa,  0.0%hi,  0.0%si,  0.5%st
Cpu6  :  0.8%us,  1.2%sy,  0.0%ni, 97.5%id,  0.0%wa,  0.0%hi,  0.0%si,  0.5%st
Cpu7  :  0.8%us,  1.2%sy,  0.0%ni, 97.5%id,  0.1%wa,  0.0%hi,  0.0%si,  0.5%st
Cpu8  :  0.7%us,  1.2%sy,  0.0%ni, 97.6%id,  0.1%wa,  0.0%hi,  0.0%si,  0.5%st
Cpu9  :  0.7%us,  1.1%sy,  0.0%ni, 97.6%id,  0.2%wa,  0.0%hi,  0.0%si,  0.5%st
Cpu10 :  0.6%us,  1.1%sy,  0.0%ni, 97.8%id,  0.0%wa,  0.0%hi,  0.0%si,  0.5%st
Cpu11 :  0.7%us,  1.1%sy,  0.0%ni, 97.7%id,  0.1%wa,  0.0%hi,  0.0%si,  0.5%st
Cpu12 :  0.7%us,  1.1%sy,  0.0%ni, 97.7%id,  0.0%wa,  0.0%hi,  0.0%si,  0.5%st
Cpu13 :  0.7%us,  1.1%sy,  0.0%ni, 97.7%id,  0.1%wa,  0.0%hi,  0.0%si,  0.5%st
Mem:   8372060k total,  7125752k used,  1246308k free,  1824588k buffers
Swap:  1048568k total,        0k used,  1048568k free,  2525444k cached

  PID USER      PR  NI  VIRT  RES  SHR S %CPU %MEM    TIME+  COMMAND
 8588 www-data  20   0  770m  92m  53m R  130  1.1   2:11.90 php-fpm
 6571 www-data  20   0  770m  91m  52m R  128  1.1   1:39.57 php-fpm
 7297 www-data  20   0  771m  89m  49m R  127  1.1   2:13.49 php-fpm
 7309 www-data  20   0  776m 103m  57m R  125  1.3   2:23.27 php-fpm
 8012 www-data  20   0  769m  87m  48m R  125  1.1   1:24.40 php-fpm
 8771 www-data  20   0  759m  84m  55m R  121  1.0   1:27.05 php-fpm
 7725 www-data  20   0  770m  88m  49m R  115  1.1   1:38.88 php-fpm
32521 www-data  20   0  769m  90m  51m R  115  1.1   1:02.91 php-fpm
 6774 www-data  20   0  759m  77m  49m R  111  1.0   1:38.98 php-fpm
 6408 www-data  20   0  772m  97m  55m R  100  1.2   1:44.62 php-fpm
 6260 www-data  20   0  754m  84m  60m R   98  1.0   2:08.71 php-fpm
 6259 www-data  20   0  770m  98m  58m R   96  1.2   2:30.25 php-fpm
 6264 www-data  20   0  770m  98m  58m R   83  1.2   2:42.95 php-fpm
11340 www-data  20   0  768m 104m  66m R   81  1.3   1:31.02 php-fpm
 6263 www-data  20   0  769m  89m  50m R   76  1.1   2:37.23 php-fpm
63347 root      20   0 10620 1368 1148 S    4  0.0   0:06.56 bash
63776 root      20   0 19200 1380  912 R    2  0.0   0:00.02 top
    1 root      20   0  8356  780  648 S    0  0.0   0:09.94 init
    2 root      20   0     0    0    0 S    0  0.0   0:00.02 kthreadd
12:02:34
At noon there was a load spike that resulted in nginx and php-fpm being killed.
The load of 81 (equivalent to 5 on a uni-processor system, see http://blog.scoutapp.com/articles/2009/07/31/understanding-load-averages) caused php-fpm and nginx to be killed, I think this is probably a bit too low, looking at the CPU states about they are not doing much and with the current 8GB of RAM the server isn't swapping at all -- there is 1GB of RAM free.
nginx high load on
ONEX_LOAD = 2628
FIVX_LOAD = 1095
uptime :
 12:02:34 up 2 days,  2:29,  1 user,  load average: 43.12, 15.94, 6.19
top :
====================
nginx high load on
ONEX_LOAD = 6109
FIVX_LOAD = 3001
uptime :
 12:04:41 up 2 days,  2:31,  1 user,  load average: 81.24, 38.13, 15.40
top :
====================
php-fpm and nginx about to be killed
ONEX_LOAD = 8124
FIVX_LOAD = 3813
uptime :
 12:04:41 up 2 days,  2:31,  1 user,  load average: 81.24, 38.13, 15.40
top :
====================
php-fpm and nginx about to be killed
ONEX_LOAD = 8124
FIVX_LOAD = 3813
uptime :
 12:04:41 up 2 days,  2:31,  1 user,  load average: 81.24, 38.13, 15.40
top :
top - 12:04:41 up 2 days,  2:31,  1 user,  load average: 81.24, 38.13, 15.40
Tasks: 354 total,  61 running, 292 sleeping,   0 stopped,   1 zombie
Cpu0  :  2.5%us,  2.5%sy,  0.0%ni, 91.2%id,  3.2%wa,  0.0%hi,  0.1%si,  0.6%st
Cpu1  :  1.9%us,  2.4%sy,  0.0%ni, 94.7%id,  0.4%wa,  0.0%hi,  0.0%si,  0.6%st
Cpu2  :  1.9%us,  2.1%sy,  0.0%ni, 95.3%id,  0.1%wa,  0.0%hi,  0.0%si,  0.6%st
Cpu3  :  1.3%us,  1.7%sy,  0.0%ni, 96.2%id,  0.3%wa,  0.0%hi,  0.0%si,  0.5%st
Cpu4  :  1.1%us,  1.6%sy,  0.0%ni, 96.7%id,  0.1%wa,  0.0%hi,  0.0%si,  0.5%st
Cpu5  :  0.9%us,  1.4%sy,  0.0%ni, 97.1%id,  0.0%wa,  0.0%hi,  0.0%si,  0.5%st
Cpu6  :  0.8%us,  1.3%sy,  0.0%ni, 97.4%id,  0.0%wa,  0.0%hi,  0.0%si,  0.5%st
Cpu7  :  0.8%us,  1.3%sy,  0.0%ni, 97.4%id,  0.0%wa,  0.0%hi,  0.0%si,  0.5%st
Cpu8  :  0.7%us,  1.2%sy,  0.0%ni, 97.5%id,  0.1%wa,  0.0%hi,  0.0%si,  0.5%st
Cpu9  :  0.7%us,  1.2%sy,  0.0%ni, 97.5%id,  0.2%wa,  0.0%hi,  0.0%si,  0.5%st
Cpu10 :  0.6%us,  1.1%sy,  0.0%ni, 97.7%id,  0.0%wa,  0.0%hi,  0.0%si,  0.5%st
Cpu11 :  0.7%us,  1.1%sy,  0.0%ni, 97.6%id,  0.1%wa,  0.0%hi,  0.0%si,  0.5%st
Cpu12 :  0.7%us,  1.2%sy,  0.0%ni, 97.6%id,  0.0%wa,  0.0%hi,  0.0%si,  0.5%st
Cpu13 :  0.7%us,  1.2%sy,  0.0%ni, 97.6%id,  0.1%wa,  0.0%hi,  0.0%si,  0.5%st
Mem:   8372060k total,  7311676k used,  1060384k free,  1827280k buffers
Swap:  1048568k total,        0k used,  1048568k free,  2413744k cached

  PID USER      PR  NI  VIRT  RES  SHR S %CPU %MEM    TIME+  COMMAND
33536 www-data  20   0  739m  16m 7412 R   34  0.2   0:27.62 php-fpm
 1650 www-data  20   0  767m  83m  47m R   32  1.0   2:02.19 php-fpm
33602 www-data  20   0  738m  14m 5524 R   32  0.2   0:15.04 php-fpm
 1639 www-data  20   0  768m  96m  59m R   30  1.2   2:32.42 php-fpm
 1646 www-data  20   0  779m  94m  46m R   30  1.2   2:28.53 php-fpm
 1649 www-data  20   0  778m 117m  69m R   29  1.4   1:42.00 php-fpm
33489 www-data  20   0  739m  16m 7392 R   29  0.2   0:36.28 php-fpm
33511 www-data  20   0  739m  16m 7392 R   29  0.2   0:30.93 php-fpm
33587 www-data  20   0  739m  16m 7392 R   29  0.2   0:19.65 php-fpm
33610 www-data  20   0  738m  14m 5620 R   29  0.2   0:12.82 php-fpm
 1638 www-data  20   0  768m  82m  45m R   27  1.0   1:27.38 php-fpm
33490 www-data  20   0  739m  16m 7412 R   27  0.2   0:35.29 php-fpm
33555 www-data  20   0  739m  16m 7392 R   27  0.2   0:21.10 php-fpm
 1637 www-data  20   0  770m  88m  49m R   25  1.1   1:32.50 php-fpm
 1640 www-data  20   0  769m  85m  46m R   25  1.0   1:18.79 php-fpm
 1641 www-data  20   0  769m  86m  47m R   25  1.1   1:37.08 php-fpm
 1644 www-data  20   0  759m  77m  49m R   25  0.9   1:24.41 php-fpm
 1645 www-data  20   0  756m  76m  50m R   25  0.9   1:29.48 php-fpm
33508 www-data  20   0  739m  16m 7376 R   25  0.2   0:31.68 php-fpm
33546 www-data  20   0  739m  16m 7392 R   25  0.2   0:29.41 php-fpm
33615 www-data  20   0  738m  13m 4996 R   25  0.2   0:06.10 php-fpm
 1633 www-data  20   0  790m 124m  64m R   23  1.5   2:07.66 php-fpm
 1651 www-data  20   0  775m  98m  53m R   23  1.2   1:52.55 php-fpm
33542 www-data  20   0  739m  16m 7376 R   23  0.2   0:26.59 php-fpm
33601 www-data  20   0  738m  13m 4996 R   23  0.2   0:16.93 php-fpm
33606 www-data  20   0  739m  15m 6668 R   23  0.2   0:13.79 php-fpm
33607 www-data  20   0  739m  16m 7392 R   23  0.2   0:11.05 php-fpm
33611 www-data  20   0  739m  16m 7376 R   23  0.2   0:10.72 php-fpm
33614 www-data  20   0  738m  13m 4648 R   23  0.2   0:08.19 php-fpm
33616 www-data  20   0  738m  13m 5036 R   23  0.2   0:05.09 php-fpm
33114 www-data  20   0  739m  17m 7548 R   22  0.2   0:51.43 php-fpm
33554 www-data  20   0  739m  16m 7376 R   22  0.2   0:22.99 php-fpm
33586 www-data  20   0  739m  16m 7392 R   22  0.2   0:21.11 php-fpm
33594 www-data  20   0  739m  16m 6932 R   22  0.2   0:17.97 php-fpm
33613 www-data  20   0  738m  12m 3968 R   22  0.2   0:06.04 php-fpm
 1636 www-data  20   0  780m  97m  47m R   20  1.2   1:57.37 php-fpm
 1643 www-data  20   0  769m  87m  49m R   20  1.1   1:34.98 php-fpm
 1647 www-data  20   0  769m  87m  48m R   20  1.1   2:31.06 php-fpm
33488 www-data  20   0  739m  16m 7352 R   20  0.2   0:38.12 php-fpm
33539 www-data  20   0  739m  16m 7392 R   20  0.2   0:28.44 php-fpm
33552 www-data  20   0  739m  16m 7392 R   20  0.2   0:23.66 php-fpm
33619 www-data  20   0  738m  12m 3956 R   20  0.2   0:08.27 php-fpm
33618 www-data  20   0  738m  14m 5476 R   16  0.2   0:08.94 php-fpm
33671 www-data  20   0  738m  12m 3992 R   16  0.2   0:01.69 php-fpm
33795 root      20   0 13288 6952  424 R   14  0.1   0:00.08 bzip2
 1652 www-data  20   0  761m  78m  48m R   13  1.0   1:15.18 php-fpm
33592 www-data  20   0  738m  13m 4996 R   13  0.2   0:19.70 php-fpm
33593 www-data  20   0  738m  14m 5652 S    9  0.2   0:19.63 php-fpm
33806 aegir     20   0 37152 2324 1848 D    9  0.0   0:00.05 postdrop
 1648 www-data  20   0  768m  85m  47m R    7  1.0   1:20.05 php-fpm
33604 www-data  20   0  738m  14m 5636 S    7  0.2   0:15.85 php-fpm
 1634 www-data  20   0  771m  88m  48m R    5  1.1   1:45.03 php-fpm
 2234 root      20   0  117m 1940 1076 S    5  0.0   0:45.27 rsyslogd
33624 root      20   0 19200 1412  912 R    5  0.0   0:19.34 top
33738 root      20   0 19200 1464  912 R    5  0.0   0:00.06 top
33794 root      20   0 19200 1448  912 S    5  0.0   0:00.03 top
 1642 www-data  20   0  771m  89m  48m R    4  1.1   1:35.15 php-fpm
 3356 mysql     20   0 2000m 1.1g  10m S    4 14.3  92:04.57 mysqld
27129 redis     20   0  191m  37m  920 S    4  0.5   4:25.78 redis-server
33298 root      20   0 10808 1596 1188 S    4  0.0   0:01.00 backupninja
33780 root      20   0 16852 1080  868 S    4  0.0   0:00.02 tar
33846 root      20   0 19200 1452  912 S    4  0.0   0:00.02 top
  225 root      20   0     0    0    0 R    2  0.0   0:47.92 kjournald
 1434 www-data  20   0 75076  11m 1892 S    2  0.1   0:02.24 nginx
33299 root      20   0 10836 1624 1192 S    2  0.0   0:00.08 metche
33307 root      20   0 10752 1584 1228 S    2  0.0   0:00.20 bash
33332 root      20   0 10624 1372 1148 S    2  0.0   0:00.20 bash
33783 aegir     20   0 37164 2344 1868 S    2  0.0   0:00.01 sendmail
33827 postfix   20   0 39340 2528 2004 D    2  0.0   0:00.01 cleanup
33836 postfix   20   0 39252 2404 1908 S    2  0.0   0:00.01 trivial-rewrite
33882 root      20   0 39848 2784 2128 S    2  0.0   0:00.01 mysqladmin
    1 root      20   0  8356  780  648 S    0  0.0   0:10.02 init
    2 root      20   0     0    0    0 S    0  0.0   0:00.02 kthreadd
12:04:55
This is after php-fpm and nginx have been stopped:
php-fpm and nginx about to be killed
ONEX_LOAD = 6941
FIVX_LOAD = 3772
uptime :
 12:04:55 up 2 days,  2:31,  1 user,  load average: 69.41, 37.72, 15.64
top :
====================
php-fpm and nginx about to be killed
ONEX_LOAD = 6941
FIVX_LOAD = 3772
uptime :
 12:04:55 up 2 days,  2:31,  1 user,  load average: 69.41, 37.72, 15.64
top :
top - 12:04:56 up 2 days,  2:31,  1 user,  load average: 69.41, 37.72, 15.64
Tasks: 232 total,   1 running, 231 sleeping,   0 stopped,   0 zombie
Cpu0  :  2.5%us,  2.5%sy,  0.0%ni, 91.2%id,  3.2%wa,  0.0%hi,  0.1%si,  0.6%st
Cpu1  :  1.9%us,  2.4%sy,  0.0%ni, 94.7%id,  0.4%wa,  0.0%hi,  0.0%si,  0.6%st
Cpu2  :  1.9%us,  2.1%sy,  0.0%ni, 95.3%id,  0.1%wa,  0.0%hi,  0.0%si,  0.6%st
Cpu3  :  1.3%us,  1.7%sy,  0.0%ni, 96.2%id,  0.3%wa,  0.0%hi,  0.0%si,  0.5%st
Cpu4  :  1.1%us,  1.6%sy,  0.0%ni, 96.7%id,  0.1%wa,  0.0%hi,  0.0%si,  0.5%st
Cpu5  :  0.9%us,  1.4%sy,  0.0%ni, 97.1%id,  0.0%wa,  0.0%hi,  0.0%si,  0.5%st
Cpu6  :  0.8%us,  1.3%sy,  0.0%ni, 97.4%id,  0.0%wa,  0.0%hi,  0.0%si,  0.5%st
Cpu7  :  0.8%us,  1.3%sy,  0.0%ni, 97.4%id,  0.0%wa,  0.0%hi,  0.0%si,  0.5%st
Cpu8  :  0.7%us,  1.2%sy,  0.0%ni, 97.5%id,  0.1%wa,  0.0%hi,  0.0%si,  0.5%st
Cpu9  :  0.7%us,  1.2%sy,  0.0%ni, 97.5%id,  0.2%wa,  0.0%hi,  0.0%si,  0.5%st
Cpu10 :  0.6%us,  1.1%sy,  0.0%ni, 97.7%id,  0.0%wa,  0.0%hi,  0.0%si,  0.5%st
Cpu11 :  0.7%us,  1.1%sy,  0.0%ni, 97.6%id,  0.1%wa,  0.0%hi,  0.0%si,  0.5%st
Cpu12 :  0.7%us,  1.2%sy,  0.0%ni, 97.6%id,  0.0%wa,  0.0%hi,  0.0%si,  0.5%st
Cpu13 :  0.7%us,  1.2%sy,  0.0%ni, 97.6%id,  0.1%wa,  0.0%hi,  0.0%si,  0.5%st
Mem:   8372060k total,  6151508k used,  2220552k free,  1827288k buffers
Swap:  1048568k total,        0k used,  1048568k free,  2322900k cached

  PID USER      PR  NI  VIRT  RES  SHR S %CPU %MEM    TIME+  COMMAND
36669 root      20   0 19068 1344  912 R    6  0.0   0:00.05 top
36672 root      20   0 19068 1344  912 S    4  0.0   0:00.02 top
    1 root      20   0  8356  780  648 S    0  0.0   0:10.02 init
    2 root      20   0     0    0    0 S    0  0.0   0:00.02 kthreadd
    3 root      RT   0     0    0    0 S    0  0.0   0:35.41 migration/0
12:05:01
php-fpm and nginx about to be killed
ONEX_LOAD = 6385
FIVX_LOAD = 3709
uptime :
 12:05:01 up 2 days,  2:31,  1 user,  load average: 63.85, 37.09, 15.56
top :
top - 12:05:01 up 2 days,  2:31,  1 user,  load average: 63.85, 37.09, 15.56
Tasks: 260 total,   4 running, 256 sleeping,   0 stopped,   0 zombie
Cpu0  :  2.5%us,  2.5%sy,  0.0%ni, 91.2%id,  3.2%wa,  0.0%hi,  0.1%si,  0.6%st
Cpu1  :  1.9%us,  2.4%sy,  0.0%ni, 94.7%id,  0.4%wa,  0.0%hi,  0.0%si,  0.6%st
Cpu2  :  1.9%us,  2.1%sy,  0.0%ni, 95.3%id,  0.1%wa,  0.0%hi,  0.0%si,  0.6%st
Cpu3  :  1.3%us,  1.7%sy,  0.0%ni, 96.2%id,  0.3%wa,  0.0%hi,  0.0%si,  0.5%st
Cpu4  :  1.1%us,  1.6%sy,  0.0%ni, 96.7%id,  0.1%wa,  0.0%hi,  0.0%si,  0.5%st
Cpu5  :  0.9%us,  1.4%sy,  0.0%ni, 97.1%id,  0.0%wa,  0.0%hi,  0.0%si,  0.5%st
Cpu6  :  0.8%us,  1.3%sy,  0.0%ni, 97.4%id,  0.0%wa,  0.0%hi,  0.0%si,  0.5%st
Cpu7  :  0.8%us,  1.3%sy,  0.0%ni, 97.4%id,  0.0%wa,  0.0%hi,  0.0%si,  0.5%st
Cpu8  :  0.7%us,  1.2%sy,  0.0%ni, 97.5%id,  0.1%wa,  0.0%hi,  0.0%si,  0.5%st
Cpu9  :  0.7%us,  1.2%sy,  0.0%ni, 97.5%id,  0.2%wa,  0.0%hi,  0.0%si,  0.5%st
Cpu10 :  0.6%us,  1.1%sy,  0.0%ni, 97.7%id,  0.0%wa,  0.0%hi,  0.0%si,  0.5%st
Cpu11 :  0.7%us,  1.1%sy,  0.0%ni, 97.6%id,  0.1%wa,  0.0%hi,  0.0%si,  0.5%st
Cpu12 :  0.7%us,  1.2%sy,  0.0%ni, 97.6%id,  0.0%wa,  0.0%hi,  0.0%si,  0.5%st
Cpu13 :  0.7%us,  1.2%sy,  0.0%ni, 97.6%id,  0.1%wa,  0.0%hi,  0.0%si,  0.5%st
Mem:   8372060k total,  6187608k used,  2184452k free,  1827288k buffers
Swap:  1048568k total,        0k used,  1048568k free,  2323052k cached

  PID USER      PR  NI  VIRT  RES  SHR S %CPU %MEM    TIME+  COMMAND
36832 root      20   0 39156  19m  16m R  100  0.2   0:00.74 apt-get
36826 aegir     20   0  235m  26m 8912 R   57  0.3   0:00.52 drush.php
36910 root      20   0 13288 6956  428 R   27  0.1   0:00.14 bzip2
 3356 mysql     20   0 2000m 1.1g  10m S    4 14.3  92:04.95 mysqld
36867 root      20   0 19200 1368  912 R    4  0.0   0:00.04 top
36909 root      20   0 16852 1080  868 S    4  0.0   0:00.02 tar
36823 root      20   0 10620 1368 1148 S    2  0.0   0:00.01 bash
36899 root      20   0  5368  564  480 S    2  0.0   0:00.01 sleep
36912 root      20   0  5368  564  480 S    2  0.0   0:00.01 sleep
    1 root      20   0  8356  780  648 S    0  0.0   0:10.02 init
    2 root      20   0     0    0    0 S    0  0.0   0:00.02 kthreadd
12:05:03
php-fpm and nginx about to be killed
ONEX_LOAD = 5898
FIVX_LOAD = 3652
uptime :
 12:05:03 up 2 days,  2:31,  1 user,  load average: 58.98, 36.52, 15.49
top :
top - 12:05:03 up 2 days,  2:31,  1 user,  load average: 58.98, 36.52, 15.49
Tasks: 253 total,   3 running, 250 sleeping,   0 stopped,   0 zombie
Cpu0  :  2.5%us,  2.5%sy,  0.0%ni, 91.2%id,  3.2%wa,  0.0%hi,  0.1%si,  0.6%st
Cpu1  :  1.9%us,  2.4%sy,  0.0%ni, 94.7%id,  0.4%wa,  0.0%hi,  0.0%si,  0.6%st
Cpu2  :  1.9%us,  2.1%sy,  0.0%ni, 95.3%id,  0.1%wa,  0.0%hi,  0.0%si,  0.6%st
Cpu3  :  1.3%us,  1.7%sy,  0.0%ni, 96.2%id,  0.3%wa,  0.0%hi,  0.0%si,  0.5%st
Cpu4  :  1.1%us,  1.6%sy,  0.0%ni, 96.7%id,  0.1%wa,  0.0%hi,  0.0%si,  0.5%st
Cpu5  :  0.9%us,  1.4%sy,  0.0%ni, 97.1%id,  0.0%wa,  0.0%hi,  0.0%si,  0.5%st
Cpu6  :  0.8%us,  1.3%sy,  0.0%ni, 97.4%id,  0.0%wa,  0.0%hi,  0.0%si,  0.5%st
Cpu7  :  0.8%us,  1.3%sy,  0.0%ni, 97.4%id,  0.0%wa,  0.0%hi,  0.0%si,  0.5%st
Cpu8  :  0.7%us,  1.2%sy,  0.0%ni, 97.5%id,  0.1%wa,  0.0%hi,  0.0%si,  0.5%st
Cpu9  :  0.7%us,  1.2%sy,  0.0%ni, 97.5%id,  0.2%wa,  0.0%hi,  0.0%si,  0.5%st
Cpu10 :  0.6%us,  1.1%sy,  0.0%ni, 97.7%id,  0.0%wa,  0.0%hi,  0.0%si,  0.5%st
Cpu11 :  0.7%us,  1.1%sy,  0.0%ni, 97.6%id,  0.1%wa,  0.0%hi,  0.0%si,  0.5%st
Cpu12 :  0.7%us,  1.2%sy,  0.0%ni, 97.6%id,  0.0%wa,  0.0%hi,  0.0%si,  0.5%st
Cpu13 :  0.7%us,  1.2%sy,  0.0%ni, 97.6%id,  0.1%wa,  0.0%hi,  0.0%si,  0.5%st
Mem:   8372060k total,  6167872k used,  2204188k free,  1827292k buffers
Swap:  1048568k total,        0k used,  1048568k free,  2323876k cached

  PID USER      PR  NI  VIRT  RES  SHR S %CPU %MEM    TIME+  COMMAND
36910 root      20   0 13292 7024  448 R   99  0.1   0:02.11 bzip2
36991 root      20   0 38728  19m  16m R   52  0.2   0:00.27 apt-get
 2524 root      20   0 53504  15m 1532 S    2  0.2  10:06.58 lfd
 3356 mysql     20   0 2000m 1.1g  10m S    2 14.3  92:05.08 mysqld
36909 root      20   0 16852 1084  868 S    2  0.0   0:00.10 tar
36990 root      20   0 19200 1368  912 R    2  0.0   0:00.02 top
    1 root      20   0  8356  780  648 S    0  0.0   0:10.02 init
    2 root      20   0     0    0    0 S    0  0.0   0:00.02 kthreadd
12:05:06
php-fpm and nginx about to be killed
ONEX_LOAD = 5898
FIVX_LOAD = 3652
uptime :
 12:05:06 up 2 days,  2:31,  1 user,  load average: 58.98, 36.52, 15.49
top :
top - 12:05:07 up 2 days,  2:31,  1 user,  load average: 58.98, 36.52, 15.49
Tasks: 244 total,   1 running, 243 sleeping,   0 stopped,   0 zombie
Cpu0  :  2.5%us,  2.5%sy,  0.0%ni, 91.2%id,  3.2%wa,  0.0%hi,  0.1%si,  0.6%st
Cpu1  :  1.9%us,  2.4%sy,  0.0%ni, 94.7%id,  0.4%wa,  0.0%hi,  0.0%si,  0.6%st
Cpu2  :  1.9%us,  2.1%sy,  0.0%ni, 95.3%id,  0.1%wa,  0.0%hi,  0.0%si,  0.6%st
Cpu3  :  1.3%us,  1.7%sy,  0.0%ni, 96.2%id,  0.3%wa,  0.0%hi,  0.0%si,  0.5%st
Cpu4  :  1.1%us,  1.6%sy,  0.0%ni, 96.7%id,  0.1%wa,  0.0%hi,  0.0%si,  0.5%st
Cpu5  :  0.9%us,  1.4%sy,  0.0%ni, 97.1%id,  0.0%wa,  0.0%hi,  0.0%si,  0.5%st
Cpu6  :  0.8%us,  1.3%sy,  0.0%ni, 97.4%id,  0.0%wa,  0.0%hi,  0.0%si,  0.5%st
Cpu7  :  0.8%us,  1.3%sy,  0.0%ni, 97.4%id,  0.0%wa,  0.0%hi,  0.0%si,  0.5%st
Cpu8  :  0.7%us,  1.2%sy,  0.0%ni, 97.5%id,  0.1%wa,  0.0%hi,  0.0%si,  0.5%st
Cpu9  :  0.7%us,  1.2%sy,  0.0%ni, 97.5%id,  0.2%wa,  0.0%hi,  0.0%si,  0.5%st
Cpu10 :  0.6%us,  1.1%sy,  0.0%ni, 97.7%id,  0.0%wa,  0.0%hi,  0.0%si,  0.5%st
Cpu11 :  0.7%us,  1.1%sy,  0.0%ni, 97.6%id,  0.1%wa,  0.0%hi,  0.0%si,  0.5%st
Cpu12 :  0.7%us,  1.2%sy,  0.0%ni, 97.6%id,  0.0%wa,  0.0%hi,  0.0%si,  0.5%st
Cpu13 :  0.7%us,  1.2%sy,  0.0%ni, 97.6%id,  0.1%wa,  0.0%hi,  0.0%si,  0.5%st
Mem:   8372060k total,  6156464k used,  2215596k free,  1827296k buffers
Swap:  1048568k total,        0k used,  1048568k free,  2324872k cached

  PID USER      PR  NI  VIRT  RES  SHR S %CPU %MEM    TIME+  COMMAND
37138 root      20   0 19200 1368  912 R    4  0.0   0:00.03 top
37164 root      20   0 19200 1360  912 S    4  0.0   0:00.02 top
    1 root      20   0  8356  780  648 S    0  0.0   0:10.02 init
    2 root      20   0     0    0    0 S    0  0.0   0:00.02 kthreadd
    3 root      RT   0     0    0    0 S    0  0.0   0:35.41 migration/0
12:05:13
php-fpm and nginx about to be killed
ONEX_LOAD = 5426
FIVX_LOAD = 3592
uptime :
 12:05:13 up 2 days,  2:32,  1 user,  load average: 54.26, 35.92, 15.41
top :
top - 12:05:13 up 2 days,  2:32,  1 user,  load average: 49.91, 35.32, 15.32
Tasks: 240 total,   1 running, 239 sleeping,   0 stopped,   0 zombie
Cpu0  :  2.5%us,  2.5%sy,  0.0%ni, 91.2%id,  3.2%wa,  0.0%hi,  0.1%si,  0.6%st
Cpu1  :  1.9%us,  2.4%sy,  0.0%ni, 94.7%id,  0.4%wa,  0.0%hi,  0.0%si,  0.6%st
Cpu2  :  1.9%us,  2.1%sy,  0.0%ni, 95.3%id,  0.1%wa,  0.0%hi,  0.0%si,  0.6%st
Cpu3  :  1.3%us,  1.7%sy,  0.0%ni, 96.2%id,  0.3%wa,  0.0%hi,  0.0%si,  0.5%st
Cpu4  :  1.1%us,  1.6%sy,  0.0%ni, 96.7%id,  0.1%wa,  0.0%hi,  0.0%si,  0.5%st
Cpu5  :  0.9%us,  1.4%sy,  0.0%ni, 97.1%id,  0.0%wa,  0.0%hi,  0.0%si,  0.5%st
Cpu6  :  0.8%us,  1.3%sy,  0.0%ni, 97.4%id,  0.0%wa,  0.0%hi,  0.0%si,  0.5%st
Cpu7  :  0.8%us,  1.3%sy,  0.0%ni, 97.4%id,  0.0%wa,  0.0%hi,  0.0%si,  0.5%st
Cpu8  :  0.7%us,  1.2%sy,  0.0%ni, 97.5%id,  0.1%wa,  0.0%hi,  0.0%si,  0.5%st
Cpu9  :  0.7%us,  1.2%sy,  0.0%ni, 97.5%id,  0.2%wa,  0.0%hi,  0.0%si,  0.5%st
Cpu10 :  0.6%us,  1.1%sy,  0.0%ni, 97.7%id,  0.0%wa,  0.0%hi,  0.0%si,  0.5%st
Cpu11 :  0.7%us,  1.1%sy,  0.0%ni, 97.6%id,  0.1%wa,  0.0%hi,  0.0%si,  0.5%st
Cpu12 :  0.7%us,  1.2%sy,  0.0%ni, 97.6%id,  0.0%wa,  0.0%hi,  0.0%si,  0.5%st
Cpu13 :  0.7%us,  1.2%sy,  0.0%ni, 97.6%id,  0.1%wa,  0.0%hi,  0.0%si,  0.5%st
Mem:   8372060k total,  6155624k used,  2216436k free,  1827300k buffers
Swap:  1048568k total,        0k used,  1048568k free,  2325092k cached

  PID USER      PR  NI  VIRT  RES  SHR S %CPU %MEM    TIME+  COMMAND
37383 root      20   0 19200 1364  912 R    6  0.0   0:00.05 top
    1 root      20   0  8356  780  648 S    0  0.0   0:10.02 init
    2 root      20   0     0    0    0 S    0  0.0   0:00.02 kthreadd
    3 root      RT   0     0    0    0 S    0  0.0   0:35.41 migration/0
12:09:31
Here is the record in the log file after they have been killed when the processes have been started again:
nginx high load off
ONEX_LOAD = 89
FIVX_LOAD = 1519
uptime :
 12:09:31 up 2 days,  2:36,  1 user,  load average: 0.89, 15.19, 11.70
top :
top - 12:09:32 up 2 days,  2:36,  1 user,  load average: 0.89, 15.19, 11.70
Tasks: 240 total,   2 running, 238 sleeping,   0 stopped,   0 zombie
Cpu0  :  2.5%us,  2.5%sy,  0.0%ni, 91.2%id,  3.2%wa,  0.0%hi,  0.1%si,  0.6%st
Cpu1  :  1.9%us,  2.4%sy,  0.0%ni, 94.7%id,  0.4%wa,  0.0%hi,  0.0%si,  0.6%st
Cpu2  :  1.9%us,  2.1%sy,  0.0%ni, 95.3%id,  0.1%wa,  0.0%hi,  0.0%si,  0.6%st
Cpu3  :  1.3%us,  1.7%sy,  0.0%ni, 96.2%id,  0.3%wa,  0.0%hi,  0.0%si,  0.5%st
Cpu4  :  1.1%us,  1.6%sy,  0.0%ni, 96.7%id,  0.1%wa,  0.0%hi,  0.0%si,  0.5%st
Cpu5  :  0.9%us,  1.4%sy,  0.0%ni, 97.2%id,  0.0%wa,  0.0%hi,  0.0%si,  0.5%st
Cpu6  :  0.8%us,  1.3%sy,  0.0%ni, 97.4%id,  0.0%wa,  0.0%hi,  0.0%si,  0.5%st
Cpu7  :  0.8%us,  1.3%sy,  0.0%ni, 97.4%id,  0.0%wa,  0.0%hi,  0.0%si,  0.5%st
Cpu8  :  0.7%us,  1.2%sy,  0.0%ni, 97.5%id,  0.1%wa,  0.0%hi,  0.0%si,  0.5%st
Cpu9  :  0.7%us,  1.2%sy,  0.0%ni, 97.5%id,  0.2%wa,  0.0%hi,  0.0%si,  0.5%st
Cpu10 :  0.6%us,  1.1%sy,  0.0%ni, 97.7%id,  0.0%wa,  0.0%hi,  0.0%si,  0.5%st
Cpu11 :  0.7%us,  1.1%sy,  0.0%ni, 97.6%id,  0.1%wa,  0.0%hi,  0.0%si,  0.5%st
Cpu12 :  0.7%us,  1.2%sy,  0.0%ni, 97.6%id,  0.0%wa,  0.0%hi,  0.0%si,  0.5%st
Cpu13 :  0.7%us,  1.2%sy,  0.0%ni, 97.6%id,  0.1%wa,  0.0%hi,  0.0%si,  0.5%st
Mem:   8372060k total,  7008972k used,  1363088k free,  1827428k buffers
Swap:  1048568k total,        0k used,  1048568k free,  2404800k cached

  PID USER      PR  NI  VIRT  RES  SHR S %CPU %MEM    TIME+  COMMAND
37456 www-data  20   0  777m  85m  39m R   21  1.0   0:03.45 php-fpm
41269 root      20   0 19200 1356  912 R    8  0.0   0:00.06 top
 3356 mysql     20   0 2000m 1.1g  10m S    2 14.3  92:08.32 mysqld
37435 www-data  20   0 70996 8628 1860 S    2  0.1   0:00.23 nginx
39446 root      20   0 33988 5648 2120 S    2  0.1   0:00.43 vi
40519 root      20   0 10620 1360 1148 S    2  0.0   0:00.04 bash
    1 root      20   0  8356  780  648 S    0  0.0   0:10.03 init
    2 root      20   0     0    0    0 S    0  0.0   0:00.02 kthreadd
Following is what was written to the /var/log/php/php53-fpm-error.log:
[22-Jun-2013 12:00:23] WARNING: [pool www] child 1651, script '/data/disk/tn/static/transition-network-d6-p005/index.php' (request: "GET /index.php") executing too slow (39.092773 sec), logging
[22-Jun-2013 12:00:24] NOTICE: child 1651 stopped for tracing
[22-Jun-2013 12:00:24] NOTICE: about to trace 1651
[22-Jun-2013 12:00:24] NOTICE: finished trace of 1651
[22-Jun-2013 12:00:33] WARNING: [pool www] child 1635, script '/data/disk/tn/static/transition-network-d6-p005/index.php' (request: "GET /index.php") executing too slow (32.119338 sec), logging
[22-Jun-2013 12:00:34] NOTICE: child 1635 stopped for tracing
[22-Jun-2013 12:00:34] NOTICE: about to trace 1635
[22-Jun-2013 12:00:34] NOTICE: finished trace of 1635
[22-Jun-2013 12:00:43] WARNING: [pool www] child 1647, script '/data/disk/tn/static/transition-network-d6-p005/index.php' (request: "GET /index.php") executing too slow (38.397008 sec), logging
[22-Jun-2013 12:00:43] WARNING: [pool www] child 1646, script '/data/disk/tn/static/transition-network-d6-p005/index.php' (request: "GET /index.php") executing too slow (37.888318 sec), logging
[22-Jun-2013 12:00:43] WARNING: [pool www] child 1639, script '/data/disk/tn/static/transition-network-d6-p005/index.php' (request: "GET /index.php") executing too slow (35.109913 sec), logging
[22-Jun-2013 12:00:43] NOTICE: child 1639 stopped for tracing
[22-Jun-2013 12:00:43] NOTICE: about to trace 1639
[22-Jun-2013 12:00:44] NOTICE: finished trace of 1639
[22-Jun-2013 12:00:44] NOTICE: child 1646 stopped for tracing
[22-Jun-2013 12:00:44] NOTICE: about to trace 1646
[22-Jun-2013 12:00:44] NOTICE: finished trace of 1646
[22-Jun-2013 12:00:44] NOTICE: child 1647 stopped for tracing
[22-Jun-2013 12:00:44] NOTICE: about to trace 1647
[22-Jun-2013 12:00:45] NOTICE: finished trace of 1647
[22-Jun-2013 12:01:04] WARNING: [pool www] child 1633, script '/data/disk/tn/static/transition-network-d6-p005/index.php' (request: "GET /index.php") executing too slow (35.350825 sec), logging
[22-Jun-2013 12:01:04] NOTICE: child 1633 stopped for tracing
[22-Jun-2013 12:01:04] NOTICE: about to trace 1633
[22-Jun-2013 12:01:06] NOTICE: finished trace of 1633
[22-Jun-2013 12:01:14] WARNING: [pool www] child 1650, script '/data/disk/tn/static/transition-network-d6-p005/index.php' (request: "GET /index.php") executing too slow (32.470621 sec), logging
[22-Jun-2013 12:01:14] WARNING: [pool www] child 1636, script '/data/disk/tn/static/transition-network-d6-p005/index.php' (request: "GET /index.php") executing too slow (34.120095 sec), logging
[22-Jun-2013 12:01:14] NOTICE: child 1636 stopped for tracing
[22-Jun-2013 12:01:14] NOTICE: about to trace 1636
[22-Jun-2013 12:01:15] NOTICE: finished trace of 1636
[22-Jun-2013 12:01:15] NOTICE: child 1650 stopped for tracing
[22-Jun-2013 12:01:15] NOTICE: about to trace 1650
[22-Jun-2013 12:01:17] NOTICE: finished trace of 1650
[22-Jun-2013 12:01:24] WARNING: [pool www] child 33114, script '/data/disk/tn/static/transition-network-d6-p005/index.php' (request: "GET /index.php") executing too slow (30.482372 sec), logging
[22-Jun-2013 12:01:25] NOTICE: child 33114 stopped for tracing
[22-Jun-2013 12:01:25] NOTICE: about to trace 33114
[22-Jun-2013 12:01:26] NOTICE: finished trace of 33114
[22-Jun-2013 12:01:34] WARNING: [pool www] child 1643, script '/data/disk/tn/static/transition-network-d6-p005/index.php' (request: "GET /index.php") executing too slow (36.580010 sec), logging
[22-Jun-2013 12:01:34] WARNING: [pool www] child 1637, script '/data/disk/tn/static/transition-network-d6-p005/index.php' (request: "GET /index.php") executing too slow (32.509937 sec), logging
[22-Jun-2013 12:01:35] NOTICE: child 1637 stopped for tracing
[22-Jun-2013 12:01:35] NOTICE: about to trace 1637
[22-Jun-2013 12:01:36] ERROR: failed to ptrace(PEEKDATA) pid 1637: Input/output error (5)
[22-Jun-2013 12:01:37] NOTICE: finished trace of 1637
[22-Jun-2013 12:01:37] NOTICE: child 1643 stopped for tracing
[22-Jun-2013 12:01:37] NOTICE: about to trace 1643
[22-Jun-2013 12:01:40] NOTICE: finished trace of 1643
[22-Jun-2013 12:01:45] WARNING: [pool www] child 1649, script '/data/disk/tn/static/transition-network-d6-p005/index.php' (request: "GET /index.php") executing too slow (33.152829 sec), logging
[22-Jun-2013 12:01:45] WARNING: [pool www] child 1642, script '/data/disk/tn/static/transition-network-d6-p005/index.php' (request: "GET /index.php") executing too slow (34.611072 sec), logging
[22-Jun-2013 12:01:45] WARNING: [pool www] child 1641, script '/data/disk/tn/static/transition-network-d6-p005/index.php' (request: "GET /index.php") executing too slow (31.466280 sec), logging
[22-Jun-2013 12:01:45] NOTICE: child 1649 stopped for tracing
[22-Jun-2013 12:01:45] NOTICE: about to trace 1649
[22-Jun-2013 12:01:46] ERROR: failed to ptrace(PEEKDATA) pid 1649: Input/output error (5)
[22-Jun-2013 12:01:46] NOTICE: finished trace of 1649
[22-Jun-2013 12:01:46] NOTICE: child 1641 stopped for tracing
[22-Jun-2013 12:01:46] NOTICE: about to trace 1641
[22-Jun-2013 12:01:47] ERROR: failed to ptrace(PEEKDATA) pid 1641: Input/output error (5)
[22-Jun-2013 12:01:48] NOTICE: finished trace of 1641
[22-Jun-2013 12:01:48] NOTICE: child 1642 stopped for tracing
[22-Jun-2013 12:01:48] NOTICE: about to trace 1642
[22-Jun-2013 12:01:49] NOTICE: finished trace of 1642
[22-Jun-2013 12:01:52] WARNING: [pool www] seems busy (you may need to increase pm.start_servers, or pm.min/max_spare_servers), spawning 8 children, there are 9 idle, and 32 total children
[22-Jun-2013 12:01:53] WARNING: [pool www] seems busy (you may need to increase pm.start_servers, or pm.min/max_spare_servers), spawning 16 children, there are 9 idle, and 33 total children
[22-Jun-2013 12:01:55] WARNING: [pool www] child 1645, script '/data/disk/tn/static/transition-network-d6-p005/index.php' (request: "GET /index.php") executing too slow (35.111287 sec), logging
[22-Jun-2013 12:01:55] WARNING: [pool www] child 1640, script '/data/disk/tn/static/transition-network-d6-p005/index.php' (request: "GET /index.php") executing too slow (34.842618 sec), logging
[22-Jun-2013 12:01:55] NOTICE: child 1640 stopped for tracing
[22-Jun-2013 12:01:55] NOTICE: about to trace 1640
[22-Jun-2013 12:01:57] NOTICE: finished trace of 1640
[22-Jun-2013 12:01:57] NOTICE: child 1645 stopped for tracing
[22-Jun-2013 12:01:57] NOTICE: about to trace 1645
[22-Jun-2013 12:01:59] NOTICE: finished trace of 1645
[22-Jun-2013 12:02:05] WARNING: [pool www] child 1638, script '/data/disk/tn/static/transition-network-d6-p005/index.php' (request: "GET /index.php") executing too slow (39.258995 sec), logging
[22-Jun-2013 12:02:05] NOTICE: child 1638 stopped for tracing
[22-Jun-2013 12:02:05] NOTICE: about to trace 1638
[22-Jun-2013 12:02:06] ERROR: failed to ptrace(PEEKDATA) pid 1638: Input/output error (5)
[22-Jun-2013 12:02:07] NOTICE: finished trace of 1638
[22-Jun-2013 12:02:15] WARNING: [pool www] child 1652, script '/data/disk/tn/static/transition-network-d6-p005/index.php' (request: "GET /index.php") executing too slow (38.402964 sec), logging
[22-Jun-2013 12:02:15] WARNING: [pool www] child 1648, script '/data/disk/tn/static/transition-network-d6-p005/index.php' (request: "GET /index.php") executing too slow (31.221868 sec), logging
[22-Jun-2013 12:02:15] WARNING: [pool www] child 1644, script '/data/disk/tn/static/transition-network-d6-p005/index.php' (request: "GET /index.php") executing too slow (37.352610 sec), logging
[22-Jun-2013 12:02:15] WARNING: [pool www] child 1634, script '/data/disk/tn/static/transition-network-d6-p005/index.php' (request: "GET /index.php") executing too slow (30.993610 sec), logging
[22-Jun-2013 12:02:15] NOTICE: child 1652 stopped for tracing
[22-Jun-2013 12:02:15] NOTICE: about to trace 1652
[22-Jun-2013 12:02:16] NOTICE: finished trace of 1652
[22-Jun-2013 12:02:16] NOTICE: child 1634 stopped for tracing
[22-Jun-2013 12:02:16] NOTICE: about to trace 1634
[22-Jun-2013 12:02:16] NOTICE: about to trace 1634
[22-Jun-2013 12:02:18] NOTICE: finished trace of 1634
[22-Jun-2013 12:02:18] NOTICE: child 1644 stopped for tracing
[22-Jun-2013 12:02:18] NOTICE: about to trace 1644
[22-Jun-2013 12:02:21] NOTICE: finished trace of 1644
[22-Jun-2013 12:02:21] NOTICE: child 1648 stopped for tracing
[22-Jun-2013 12:02:21] NOTICE: about to trace 1648
[22-Jun-2013 12:02:24] NOTICE: finished trace of 1648
[22-Jun-2013 12:02:25] WARNING: [pool www] child 33488, script '/data/disk/tn/static/transition-network-d6-p005/index.php' (request: "GET /index.php") executing too slow (31.277113 sec), logging
[22-Jun-2013 12:02:25] WARNING: [pool www] child 33486, script '/data/disk/tn/static/transition-network-d6-p005/index.php' (request: "GET /index.php") executing too slow (33.158089 sec), logging
[22-Jun-2013 12:02:25] WARNING: [pool www] child 1635, script '/data/disk/tn/static/transition-network-d6-p005/index.php' (request: "HEAD /index.php") executing too slow (36.440551 sec), logging
[22-Jun-2013 12:02:26] NOTICE: child 33488 stopped for tracing
[22-Jun-2013 12:02:26] NOTICE: about to trace 33488
[22-Jun-2013 12:02:28] ERROR: failed to ptrace(PEEKDATA) pid 33488: Input/output error (5)
[22-Jun-2013 12:02:29] NOTICE: finished trace of 33488
[22-Jun-2013 12:02:29] NOTICE: child 1635 stopped for tracing
[22-Jun-2013 12:02:29] NOTICE: about to trace 1635
[22-Jun-2013 12:02:31] ERROR: failed to ptrace(PEEKDATA) pid 1635: Input/output error (5)
[22-Jun-2013 12:02:32] NOTICE: finished trace of 1635
[22-Jun-2013 12:02:32] NOTICE: child 33486 stopped for tracing
[22-Jun-2013 12:02:32] NOTICE: about to trace 33486
[22-Jun-2013 12:02:34] ERROR: failed to ptrace(PEEKDATA) pid 33486: Input/output error (5)
[22-Jun-2013 12:02:36] NOTICE: finished trace of 33486
[22-Jun-2013 12:02:36] WARNING: [pool www] child 33490, script '/data/disk/tn/static/transition-network-d6-p005/index.php' (request: "GET /index.php") executing too slow (30.771847 sec), logging
[22-Jun-2013 12:02:36] WARNING: [pool www] child 33489, script '/data/disk/tn/static/transition-network-d6-p005/index.php' (request: "GET /index.php") executing too slow (39.684622 sec), logging
[22-Jun-2013 12:02:36] NOTICE: child 33490 stopped for tracing
[22-Jun-2013 12:02:36] NOTICE: about to trace 33490
[22-Jun-2013 12:02:38] ERROR: failed to ptrace(PEEKDATA) pid 33490: Input/output error (5)
[22-Jun-2013 12:02:40] NOTICE: finished trace of 33490
[22-Jun-2013 12:02:40] NOTICE: child 33489 stopped for tracing
[22-Jun-2013 12:02:40] NOTICE: about to trace 33489
[22-Jun-2013 12:02:42] ERROR: failed to ptrace(PEEKDATA) pid 33489: Input/output error (5)
[22-Jun-2013 12:02:43] NOTICE: finished trace of 33489
[22-Jun-2013 12:02:43] WARNING: [pool www] seems busy (you may need to increase pm.start_servers, or pm.min/max_spare_servers), spawning 8 children, there are 8 idle, and 39 total children
[22-Jun-2013 12:02:44] WARNING: [pool www] seems busy (you may need to increase pm.start_servers, or pm.min/max_spare_servers), spawning 16 children, there are 8 idle, and 41 total children
[22-Jun-2013 12:02:46] WARNING: [pool www] seems busy (you may need to increase pm.start_servers, or pm.min/max_spare_servers), spawning 32 children, there are 8 idle, and 43 total children
[22-Jun-2013 12:02:47] WARNING: [pool www] seems busy (you may need to increase pm.start_servers, or pm.min/max_spare_servers), spawning 32 children, there are 8 idle, and 45 total children
[22-Jun-2013 12:02:49] WARNING: [pool www] seems busy (you may need to increase pm.start_servers, or pm.min/max_spare_servers), spawning 32 children, there are 6 idle, and 47 total children
[22-Jun-2013 12:02:50] WARNING: [pool www] seems busy (you may need to increase pm.start_servers, or pm.min/max_spare_servers), spawning 32 children, there are 8 idle, and 51 total children
[22-Jun-2013 12:02:56] WARNING: [pool www] child 33536, script '/data/disk/tn/static/transition-network-d6-p005/index.php' (request: "GET /index.php") executing too slow (31.151578 sec), logging
[22-Jun-2013 12:02:56] WARNING: [pool www] child 33511, script '/data/disk/tn/static/transition-network-d6-p005/index.php' (request: "GET /index.php") executing too slow (35.119777 sec), logging
[22-Jun-2013 12:02:56] WARNING: [pool www] child 33508, script '/data/disk/tn/static/transition-network-d6-p005/index.php' (request: "GET /index.php") executing too slow (39.194974 sec), logging
[22-Jun-2013 12:02:56] NOTICE: child 33511 stopped for tracing
[22-Jun-2013 12:02:56] NOTICE: about to trace 33511
[22-Jun-2013 12:02:58] NOTICE: finished trace of 33511
[22-Jun-2013 12:02:58] NOTICE: child 33508 stopped for tracing
[22-Jun-2013 12:02:58] NOTICE: about to trace 33508
[22-Jun-2013 12:02:59] NOTICE: finished trace of 33508
[22-Jun-2013 12:02:59] NOTICE: child 33536 stopped for tracing
[22-Jun-2013 12:02:59] NOTICE: about to trace 33536
[22-Jun-2013 12:03:00] ERROR: failed to ptrace(PEEKDATA) pid 33536: Input/output error (5)
[22-Jun-2013 12:03:01] NOTICE: finished trace of 33536
[22-Jun-2013 12:03:06] WARNING: [pool www] child 33546, script '/data/disk/tn/static/transition-network-d6-p005/index.php' (request: "GET /index.php") executing too slow (34.052783 sec), logging
[22-Jun-2013 12:03:06] WARNING: [pool www] child 33542, script '/data/disk/tn/static/transition-network-d6-p005/index.php' (request: "GET /index.php") executing too slow (35.571572 sec), logging
[22-Jun-2013 12:03:06] WARNING: [pool www] child 33539, script '/data/disk/tn/static/transition-network-d6-p005/index.php' (request: "GET /index.php") executing too slow (39.905059 sec), logging
[22-Jun-2013 12:03:07] NOTICE: child 33539 stopped for tracing
[22-Jun-2013 12:03:07] NOTICE: about to trace 33539
[22-Jun-2013 12:03:07] ERROR: failed to ptrace(PEEKDATA) pid 33539: Input/output error (5)
[22-Jun-2013 12:03:09] NOTICE: finished trace of 33539
[22-Jun-2013 12:03:09] NOTICE: child 33542 stopped for tracing
[22-Jun-2013 12:03:09] NOTICE: about to trace 33542
[22-Jun-2013 12:03:10] ERROR: failed to ptrace(PEEKDATA) pid 33542: Input/output error (5)
[22-Jun-2013 12:03:10] NOTICE: finished trace of 33542
[22-Jun-2013 12:03:10] NOTICE: child 33546 stopped for tracing
[22-Jun-2013 12:03:10] NOTICE: about to trace 33546
[22-Jun-2013 12:03:11] ERROR: failed to ptrace(PEEKDATA) pid 33546: Input/output error (5)
[22-Jun-2013 12:03:12] NOTICE: finished trace of 33546
[22-Jun-2013 12:03:17] WARNING: [pool www] child 33554, script '/data/disk/tn/static/transition-network-d6-p005/index.php' (request: "GET /index.php") executing too slow (34.365713 sec), logging
[22-Jun-2013 12:03:17] WARNING: [pool www] child 33552, script '/data/disk/tn/static/transition-network-d6-p005/index.php' (request: "GET /index.php") executing too slow (35.734208 sec), logging
[22-Jun-2013 12:03:17] NOTICE: child 33552 stopped for tracing
[22-Jun-2013 12:03:17] NOTICE: about to trace 33552
[22-Jun-2013 12:03:18] ERROR: failed to ptrace(PEEKDATA) pid 33552: Input/output error (5)
[22-Jun-2013 12:03:21] NOTICE: finished trace of 33552
[22-Jun-2013 12:03:21] NOTICE: child 33554 stopped for tracing
[22-Jun-2013 12:03:21] NOTICE: about to trace 33554
[22-Jun-2013 12:03:25] ERROR: failed to ptrace(PEEKDATA) pid 33554: Input/output error (5)
[22-Jun-2013 12:03:26] NOTICE: finished trace of 33554
[22-Jun-2013 12:03:27] WARNING: [pool www] child 33594, script '/data/disk/tn/static/transition-network-d6-p005/index.php' (request: "GET /index.php") executing too slow (31.143826 sec), logging
[22-Jun-2013 12:03:27] WARNING: [pool www] child 33587, script '/data/disk/tn/static/transition-network-d6-p005/index.php' (request: "GET /index.php") executing too slow (32.058360 sec), logging
[22-Jun-2013 12:03:27] WARNING: [pool www] child 33586, script '/data/disk/tn/static/transition-network-d6-p005/index.php' (request: "GET /index.php") executing too slow (33.421254 sec), logging
[22-Jun-2013 12:03:27] WARNING: [pool www] child 33555, script '/data/disk/tn/static/transition-network-d6-p005/index.php' (request: "GET /index.php") executing too slow (39.496059 sec), logging
[22-Jun-2013 12:03:27] WARNING: [pool www] child 33114, script '/data/disk/tn/static/transition-network-d6-p005/index.php' (request: "GET /index.php") executing too slow (38.303183 sec), logging
[22-Jun-2013 12:03:27] WARNING: [pool www] child 1643, script '/data/disk/tn/static/transition-network-d6-p005/index.php' (request: "GET /index.php") executing too slow (34.175861 sec), logging
[22-Jun-2013 12:03:28] NOTICE: child 33114 stopped for tracing
[22-Jun-2013 12:03:28] NOTICE: about to trace 33114
[22-Jun-2013 12:03:30] ERROR: failed to ptrace(PEEKDATA) pid 33114: Input/output error (5)
[22-Jun-2013 12:03:32] NOTICE: finished trace of 33114
[22-Jun-2013 12:03:32] NOTICE: child 1643 stopped for tracing
[22-Jun-2013 12:03:32] NOTICE: about to trace 1643
[22-Jun-2013 12:03:34] ERROR: failed to ptrace(PEEKDATA) pid 1643: Input/output error (5)
[22-Jun-2013 12:03:35] NOTICE: finished trace of 1643
[22-Jun-2013 12:03:35] NOTICE: child 33555 stopped for tracing
[22-Jun-2013 12:03:35] NOTICE: about to trace 33555
[22-Jun-2013 12:03:36] ERROR: failed to ptrace(PEEKDATA) pid 33555: Input/output error (5)
[22-Jun-2013 12:03:38] NOTICE: finished trace of 33555
[22-Jun-2013 12:03:38] NOTICE: child 33586 stopped for tracing
[22-Jun-2013 12:03:38] NOTICE: about to trace 33586
[22-Jun-2013 12:03:39] ERROR: failed to ptrace(PEEKDATA) pid 33586: Input/output error (5)
[22-Jun-2013 12:03:39] NOTICE: finished trace of 33586
[22-Jun-2013 12:03:39] NOTICE: child 33587 stopped for tracing
[22-Jun-2013 12:03:39] NOTICE: about to trace 33587
[22-Jun-2013 12:03:41] NOTICE: finished trace of 33587
[22-Jun-2013 12:03:42] NOTICE: child 33594 stopped for tracing
[22-Jun-2013 12:03:42] NOTICE: about to trace 33594
[22-Jun-2013 12:03:44] NOTICE: finished trace of 33594
[22-Jun-2013 12:03:44] WARNING: [pool www] child 33603, script '/data/disk/tn/static/transition-network-d6-p005/index.php' (request: "GET /index.php") executing too slow (38.711441 sec), logging
[22-Jun-2013 12:03:44] WARNING: [pool www] child 33601, script '/data/disk/tn/static/transition-network-d6-p005/index.php' (request: "GET /index.php") executing too slow (30.574718 sec), logging
[22-Jun-2013 12:03:44] WARNING: [pool www] child 33593, script '/data/disk/tn/static/transition-network-d6-p005/index.php' (request: "GET /index.php") executing too slow (42.349060 sec), logging
[22-Jun-2013 12:03:44] WARNING: [pool www] child 33592, script '/data/disk/tn/static/transition-network-d6-p005/index.php' (request: "GET /index.php") executing too slow (42.648372 sec), logging
[22-Jun-2013 12:03:44] NOTICE: child 33601 stopped for tracing
[22-Jun-2013 12:03:44] NOTICE: about to trace 33601
[22-Jun-2013 12:03:46] ERROR: failed to ptrace(PEEKDATA) pid 33601: Input/output error (5)
[22-Jun-2013 12:03:47] NOTICE: finished trace of 33601
[22-Jun-2013 12:03:47] NOTICE: child 33592 stopped for tracing
[22-Jun-2013 12:03:47] NOTICE: about to trace 33592
[22-Jun-2013 12:03:50] ERROR: failed to ptrace(PEEKDATA) pid 33592: Input/output error (5)
[22-Jun-2013 12:03:52] NOTICE: finished trace of 33592
[22-Jun-2013 12:03:52] NOTICE: child 33593 stopped for tracing
[22-Jun-2013 12:03:52] NOTICE: about to trace 33593
[22-Jun-2013 12:03:53] ERROR: failed to ptrace(PEEKDATA) pid 33593: Input/output error (5)
[22-Jun-2013 12:03:56] NOTICE: finished trace of 33593
[22-Jun-2013 12:03:56] NOTICE: child 33603 stopped for tracing
[22-Jun-2013 12:03:56] NOTICE: about to trace 33603
[22-Jun-2013 12:03:58] ERROR: failed to ptrace(PEEKDATA) pid 33603: Input/output error (5)
[22-Jun-2013 12:04:00] NOTICE: finished trace of 33603
[22-Jun-2013 12:04:00] WARNING: [pool www] child 33610, script '/data/disk/tn/static/transition-network-d6-p005/index.php' (request: "GET /index.php") executing too slow (30.728167 sec), logging
[22-Jun-2013 12:04:00] WARNING: [pool www] child 33606, script '/data/disk/tn/static/transition-network-d6-p005/index.php' (request: "GET /index.php") executing too slow (35.620598 sec), logging
[22-Jun-2013 12:04:00] WARNING: [pool www] child 33604, script '/data/disk/tn/static/transition-network-d6-p005/index.php' (request: "HEAD /index.php") executing too slow (41.222512 sec), logging
[22-Jun-2013 12:04:00] WARNING: [pool www] child 33602, script '/data/disk/tn/static/transition-network-d6-p005/index.php' (request: "HEAD /index.php") executing too slow (37.904272 sec), logging
[22-Jun-2013 12:04:00] NOTICE: child 33604 stopped for tracing
[22-Jun-2013 12:04:00] NOTICE: about to trace 33604
[22-Jun-2013 12:04:01] ERROR: failed to ptrace(PEEKDATA) pid 33604: Input/output error (5)
[22-Jun-2013 12:04:03] NOTICE: finished trace of 33604
[22-Jun-2013 12:04:03] NOTICE: child 33602 stopped for tracing
[22-Jun-2013 12:04:03] NOTICE: about to trace 33602
[22-Jun-2013 12:04:05] NOTICE: finished trace of 33602
[22-Jun-2013 12:04:05] NOTICE: child 33606 stopped for tracing
[22-Jun-2013 12:04:05] NOTICE: about to trace 33606
[22-Jun-2013 12:04:09] NOTICE: finished trace of 33606
[22-Jun-2013 12:04:09] NOTICE: child 33610 stopped for tracing
[22-Jun-2013 12:04:09] NOTICE: about to trace 33610
[22-Jun-2013 12:04:11] ERROR: failed to ptrace(PEEKDATA) pid 33610: Input/output error (5)
[22-Jun-2013 12:04:13] NOTICE: finished trace of 33610
[22-Jun-2013 12:04:13] WARNING: [pool www] child 33607, script '/data/disk/tn/static/transition-network-d6-p005/index.php' (request: "GET /index.php") executing too slow (30.034944 sec), logging
[22-Jun-2013 12:04:14] WARNING: [pool www] seems busy (you may need to increase pm.start_servers, or pm.min/max_spare_servers), spawning 8 children, there are 7 idle, and 59 total children
[22-Jun-2013 12:04:14] NOTICE: child 33607 stopped for tracing
[22-Jun-2013 12:04:14] NOTICE: about to trace 33607
[22-Jun-2013 12:04:17] ERROR: failed to ptrace(PEEKDATA) pid 33607: Input/output error (5)
[22-Jun-2013 12:04:19] NOTICE: finished trace of 33607
[22-Jun-2013 12:04:19] WARNING: [pool www] seems busy (you may need to increase pm.start_servers, or pm.min/max_spare_servers), spawning 16 children, there are 5 idle, and 62 total children
[22-Jun-2013 12:04:20] WARNING: [pool www] seems busy (you may need to increase pm.start_servers, or pm.min/max_spare_servers), spawning 32 children, there are 6 idle, and 67 total children
[22-Jun-2013 12:04:21] WARNING: [pool www] seems busy (you may need to increase pm.start_servers, or pm.min/max_spare_servers), spawning 32 children, there are 9 idle, and 71 total children
[22-Jun-2013 12:04:23] WARNING: [pool www] child 33618, script '/data/disk/tn/static/transition-network-d6-p005/index.php' (request: "GET /index.php") executing too slow (32.925871 sec), logging
[22-Jun-2013 12:04:23] WARNING: [pool www] child 33611, script '/data/disk/tn/static/transition-network-d6-p005/index.php' (request: "GET /index.php") executing too slow (35.520972 sec), logging
[22-Jun-2013 12:04:24] NOTICE: child 33611 stopped for tracing
[22-Jun-2013 12:04:25] NOTICE: about to trace 33611
[22-Jun-2013 12:04:27] NOTICE: finished trace of 33611
[22-Jun-2013 12:04:27] NOTICE: child 33618 stopped for tracing
[22-Jun-2013 12:04:27] NOTICE: about to trace 33618
[22-Jun-2013 12:04:29] ERROR: failed to ptrace(PEEKDATA) pid 33618: Input/output error (5)
[22-Jun-2013 12:04:30] NOTICE: finished trace of 33618
[22-Jun-2013 12:04:34] WARNING: [pool www] child 33619, script '/data/disk/tn/static/transition-network-d6-p005/index.php' (request: "GET /index.php") executing too slow (34.695058 sec), logging
[22-Jun-2013 12:04:34] WARNING: [pool www] child 33614, script '/data/disk/tn/static/transition-network-d6-p005/index.php' (request: "GET /index.php") executing too slow (33.567031 sec), logging
[22-Jun-2013 12:04:34] NOTICE: child 33614 stopped for tracing
[22-Jun-2013 12:04:34] NOTICE: about to trace 33614
[22-Jun-2013 12:04:37] NOTICE: finished trace of 33614
[22-Jun-2013 12:04:37] NOTICE: child 33619 stopped for tracing
[22-Jun-2013 12:04:37] NOTICE: about to trace 33619
[22-Jun-2013 12:04:38] ERROR: failed to ptrace(PEEKDATA) pid 33619: Input/output error (5)
[22-Jun-2013 12:04:39] NOTICE: finished trace of 33619
[22-Jun-2013 12:04:44] WARNING: [pool www] child 33615, script '/data/disk/tn/static/transition-network-d6-p005/index.php' (request: "GET /index.php") executing too slow (32.554511 sec), logging
[22-Jun-2013 12:04:44] NOTICE: child 33615 stopped for tracing
[22-Jun-2013 12:04:44] NOTICE: about to trace 33615
[22-Jun-2013 12:04:44] NOTICE: finished trace of 33615
[22-Jun-2013 12:04:44] NOTICE: Finishing ...
[22-Jun-2013 12:04:44] NOTICE: Finishing ...
[22-Jun-2013 12:04:44] NOTICE: exiting, bye-bye!
[22-Jun-2013 12:05:15] NOTICE: fpm is running, pid 37446
[22-Jun-2013 12:05:15] NOTICE: ready to handle connections
The following mysql errors were written to /var/log/daemon.log, note that they only start when php-fpm is shutdown -- they are as a result of php-fpm being shutdown:
Jun 22 12:04:44 puffin mysqld: 130622 12:04:44 [Warning] Aborted connection 303769 to db: 'transitionnetw_0' user: 'transitionnetw_0' host: 'localhost' (Unknown error)
Jun 22 12:04:44 puffin mysqld: 130622 12:04:44 [Warning] Aborted connection 303775 to db: 'transitionnetw_0' user: 'transitionnetw_0' host: 'localhost' (Unknown error)
Jun 22 12:04:44 puffin mysqld: 130622 12:04:44 [Warning] Aborted connection 303774 to db: 'transitionnetw_0' user: 'transitionnetw_0' host: 'localhost' (Unknown error)
Jun 22 12:04:44 puffin mysqld: 130622 12:04:44 [Warning] Aborted connection 303773 to db: 'transitionnetw_0' user: 'transitionnetw_0' host: 'localhost' (Unknown error)
Jun 22 12:04:44 puffin mysqld: 130622 12:04:44 [Warning] Aborted connection 303742 to db: 'transitionnetw_0' user: 'transitionnetw_0' host: 'localhost' (Unknown error)
Jun 22 12:04:44 puffin mysqld: 130622 12:04:44 [Warning] Aborted connection 303752 to db: 'transitionnetw_0' user: 'transitionnetw_0' host: 'localhost' (Unknown error)
Jun 22 12:04:44 puffin mysqld: 130622 12:04:44 [Warning] Aborted connection 303782 to db: 'transitionnetw_0' user: 'transitionnetw_0' host: 'localhost' (Unknown error)
Jun 22 12:04:44 puffin mysqld: 130622 12:04:44 [Warning] Aborted connection 303743 to db: 'transitionnetw_0' user: 'transitionnetw_0' host: 'localhost' (Unknown error)
Jun 22 12:04:44 puffin mysqld: 130622 12:04:44 [Warning] Aborted connection 303770 to db: 'transitionnetw_0' user: 'transitionnetw_0' host: 'localhost' (Unknown error)
Jun 22 12:04:44 puffin mysqld: 130622 12:04:44 [Warning] Aborted connection 303724 to db: 'transitionnetw_0' user: 'transitionnetw_0' host: 'localhost' (Unknown error)
Jun 22 12:04:44 puffin mysqld: 130622 12:04:44 [Warning] Aborted connection 303755 to db: 'transitionnetw_0' user: 'transitionnetw_0' host: 'localhost' (Unknown error)
Jun 22 12:04:44 puffin mysqld: 130622 12:04:44 [Warning] Aborted connection 303734 to db: 'transitionnetw_0' user: 'transitionnetw_0' host: 'localhost' (Unknown error)
Jun 22 12:04:44 puffin mysqld: 130622 12:04:44 [Warning] Aborted connection 303763 to db: 'transitionnetw_0' user: 'transitionnetw_0' host: 'localhost' (Unknown error)
Jun 22 12:04:44 puffin mysqld: 130622 12:04:44 [Warning] Aborted connection 303754 to db: 'transitionnetw_0' user: 'transitionnetw_0' host: 'localhost' (Unknown error)
Jun 22 12:04:44 puffin mysqld: 130622 12:04:44 [Warning] Aborted connection 303750 to db: 'transitionnetw_0' user: 'transitionnetw_0' host: 'localhost' (Unknown error)
Jun 22 12:04:44 puffin mysqld: 130622 12:04:44 [Warning] Aborted connection 303761 to db: 'transitionnetw_0' user: 'transitionnetw_0' host: 'localhost' (Unknown error)
Jun 22 12:04:44 puffin mysqld: 130622 12:04:44 [Warning] Aborted connection 303771 to db: 'transitionnetw_0' user: 'transitionnetw_0' host: 'localhost' (Unknown error)
Jun 22 12:04:44 puffin mysqld: 130622 12:04:44 [Warning] Aborted connection 303715 to db: 'transitionnetw_0' user: 'transitionnetw_0' host: 'localhost' (Unknown error)
Jun 22 12:04:44 puffin mysqld: 130622 12:04:44 [Warning] Aborted connection 303766 to db: 'transitionnetw_0' user: 'transitionnetw_0' host: 'localhost' (Unknown error)
Jun 22 12:04:44 puffin mysqld: 130622 12:04:44 [Warning] Aborted connection 303776 to db: 'transitionnetw_0' user: 'transitionnetw_0' host: 'localhost' (Unknown error)
Jun 22 12:04:44 puffin mysqld: 130622 12:04:44 [Warning] Aborted connection 303768 to db: 'transitionnetw_0' user: 'transitionnetw_0' host: 'localhost' (Unknown error)
Jun 22 12:04:44 puffin mysqld: 130622 12:04:44 [Warning] Aborted connection 303751 to db: 'transitionnetw_0' user: 'transitionnetw_0' host: 'localhost' (Unknown error)
Jun 22 12:04:44 puffin mysqld: 130622 12:04:44 [Warning] Aborted connection 303746 to db: 'transitionnetw_0' user: 'transitionnetw_0' host: 'localhost' (Unknown error)
Jun 22 12:04:44 puffin mysqld: 130622 12:04:44 [Warning] Aborted connection 303749 to db: 'transitionnetw_0' user: 'transitionnetw_0' host: 'localhost' (Unknown error)
Jun 22 12:04:44 puffin mysqld: 130622 12:04:44 [Warning] Aborted connection 303748 to db: 'transitionnetw_0' user: 'transitionnetw_0' host: 'localhost' (Unknown error)
Jun 22 12:04:44 puffin mysqld: 130622 12:04:44 [Warning] Aborted connection 303738 to db: 'transitionnetw_0' user: 'transitionnetw_0' host: 'localhost' (Unknown error)
Jun 22 12:04:44 puffin mysqld: 130622 12:04:44 [Warning] Aborted connection 303729 to db: 'transitionnetw_0' user: 'transitionnetw_0' host: 'localhost' (Unknown error)
Jun 22 12:04:44 puffin mysqld: 130622 12:04:44 [Warning] Aborted connection 303777 to db: 'transitionnetw_0' user: 'transitionnetw_0' host: 'localhost' (Unknown error)
Jun 22 12:04:44 puffin mysqld: 130622 12:04:44 [Warning] Aborted connection 303676 to db: 'transitionnetw_0' user: 'transitionnetw_0' host: 'localhost' (Unknown error)
Jun 22 12:04:44 puffin mysqld: 130622 12:04:44 [Warning] Aborted connection 303825 to db: 'transitionnetw_0' user: 'transitionnetw_0' host: 'localhost' (Unknown error)
Jun 22 12:04:44 puffin mysqld: 130622 12:04:44 [Warning] Aborted connection 303817 to db: 'transitionnetw_0' user: 'transitionnetw_0' host: 'localhost' (Unknown error)
Jun 22 12:04:44 puffin mysqld: 130622 12:04:44 [Warning] Aborted connection 303745 to db: 'transitionnetw_0' user: 'transitionnetw_0' host: 'localhost' (Unknown error)
Jun 22 12:04:44 puffin mysqld: 130622 12:04:44 [Warning] Aborted connection 303720 to db: 'transitionnetw_0' user: 'transitionnetw_0' host: 'localhost' (Unknown error)
Jun 22 12:04:44 puffin mysqld: 130622 12:04:44 [Warning] Aborted connection 303762 to db: 'transitionnetw_0' user: 'transitionnetw_0' host: 'localhost' (Unknown error)
Jun 22 12:04:44 puffin mysqld: 130622 12:04:44 [Warning] Aborted connection 303757 to db: 'transitionnetw_0' user: 'transitionnetw_0' host: 'localhost' (Unknown error)
Jun 22 12:04:44 puffin mysqld: 130622 12:04:44 [Warning] Aborted connection 303747 to db: 'transitionnetw_0' user: 'transitionnetw_0' host: 'localhost' (Unknown error)
Jun 22 12:04:44 puffin mysqld: 130622 12:04:44 [Warning] Aborted connection 303737 to db: 'transitionnetw_0' user: 'transitionnetw_0' host: 'localhost' (Unknown error)
Jun 22 12:04:44 puffin mysqld: 130622 12:04:44 [Warning] Aborted connection 303765 to db: 'transitionnetw_0' user: 'transitionnetw_0' host: 'localhost' (Unknown error)
Jun 22 12:04:44 puffin mysqld: 130622 12:04:44 [Warning] Aborted connection 303740 to db: 'transitionnetw_0' user: 'transitionnetw_0' host: 'localhost' (Unknown error)
Jun 22 12:04:44 puffin mysqld: 130622 12:04:44 [Warning] Aborted connection 303756 to db: 'transitionnetw_0' user: 'transitionnetw_0' host: 'localhost' (Unknown error)
Jun 22 12:04:44 puffin mysqld: 130622 12:04:44 [Warning] Aborted connection 303753 to db: 'transitionnetw_0' user: 'transitionnetw_0' host: 'localhost' (Unknown error)
Jun 22 12:04:44 puffin mysqld: 130622 12:04:44 [Warning] Aborted connection 303730 to db: 'transitionnetw_0' user: 'transitionnetw_0' host: 'localhost' (Unknown error)
Jun 22 12:04:44 puffin mysqld: 130622 12:04:44 [Warning] Aborted connection 303717 to db: 'transitionnetw_0' user: 'transitionnetw_0' host: 'localhost' (Unknown error)
Jun 22 12:04:44 puffin mysqld: 130622 12:04:44 [Warning] Aborted connection 303731 to db: 'transitionnetw_0' user: 'transitionnetw_0' host: 'localhost' (Unknown error)
Jun 22 12:04:44 puffin mysqld: 130622 12:04:44 [Warning] Aborted connection 303781 to db: 'transitionnetw_0' user: 'transitionnetw_0' host: 'localhost' (Unknown error)
Jun 22 12:04:44 puffin mysqld: 130622 12:04:44 [Warning] Aborted connection 303778 to db: 'transitionnetw_0' user: 'transitionnetw_0' host: 'localhost' (Unknown error)
Jun 22 12:04:44 puffin mysqld: 130622 12:04:44 [Warning] Aborted connection 303735 to db: 'transitionnetw_0' user: 'transitionnetw_0' host: 'localhost' (Unknown error)
Jun 22 12:04:44 puffin mysqld: 130622 12:04:44 [Warning] Aborted connection 303759 to db: 'transitionnetw_0' user: 'transitionnetw_0' host: 'localhost' (Unknown error)
Jun 22 12:04:44 puffin mysqld: 130622 12:04:44 [Warning] Aborted connection 303722 to db: 'transitionnetw_0' user: 'transitionnetw_0' host: 'localhost' (Unknown error)
Jun 22 12:04:44 puffin mysqld: 130622 12:04:44 [Warning] Aborted connection 303727 to db: 'transitionnetw_0' user: 'transitionnetw_0' host: 'localhost' (Unknown error)
Jun 22 12:04:44 puffin mysqld: 130622 12:04:44 [Warning] Aborted connection 303714 to db: 'transitionnetw_0' user: 'transitionnetw_0' host: 'localhost' (Unknown error)
Jun 22 12:04:44 puffin mysqld: 130622 12:04:44 [Warning] Aborted connection 303739 to db: 'transitionnetw_0' user: 'transitionnetw_0' host: 'localhost' (Unknown error)
I have edited /var/xdrago/second.sh and removed the dumping of ps -lA and cat proc/interrupts to the /var/log/high-load.log file and also re-multiplied the variables by 5 rather than 4:
# Original values:
#CTL_ONEX_SPIDER_LOAD=388
#CTL_FIVX_SPIDER_LOAD=388
#CTL_ONEX_LOAD=1444
#CTL_FIVX_LOAD=888
#CTL_ONEX_LOAD_CRIT=1888
#CTL_FIVX_LOAD_CRIT=1555
# x4 of original:
#CTL_ONEX_SPIDER_LOAD=1552
#CTL_FIVX_SPIDER_LOAD=1552
#CTL_ONEX_LOAD=5776
#CTL_FIVX_LOAD=3552
#CTL_ONEX_LOAD_CRIT=7552
#CTL_FIVX_LOAD_CRIT=6220
# 5x of original:
CTL_ONEX_SPIDER_LOAD=1940
CTL_FIVX_SPIDER_LOAD=1940
CTL_ONEX_LOAD=7220
CTL_FIVX_LOAD=4440
CTL_ONEX_LOAD_CRIT=9440
CTL_FIVX_LOAD_CRIT=7775
comment:53 Changed 3 years ago by chris
- Add Hours to Ticket changed from 0.0 to 1.3
- Total Hours changed from 19.48 to 20.78
I have made a start on the awstats configuration, see wiki:AwStatsInstall
There was just another load spike, I caught the end of it and the site was slow but still responsive -- I didn't get any 502 or 503 errors when browsing it, it was just very sluggish. I think this indicates that the 5x settings in second.sh are probably about right.
See also the graphs, since the munin refresh rate was changed from 5 mins to 3 mins the spikes are better recorded:
- https://penguin.transitionnetwork.org/munin/transitionnetwork.org/puffin.transitionnetwork.org/load.html
- https://penguin.transitionnetwork.org/munin/transitionnetwork.org/puffin.transitionnetwork.org/cpu.html
I'll upload these image to this ticket.
This is what was written to high-load.log at the start:
nginx high load on
ONEX_LOAD = 2245
FIVX_LOAD = 672
uptime :
 16:29:29 up 2 days,  6:56,  2 users,  load average: 22.45, 6.72, 2.62
top :
top - 16:29:30 up 2 days,  6:56,  2 users,  load average: 22.45, 6.72, 2.62
Tasks: 274 total,  34 running, 240 sleeping,   0 stopped,   0 zombie
Cpu0  :  2.5%us,  2.5%sy,  0.0%ni, 91.4%id,  3.1%wa,  0.0%hi,  0.1%si,  0.6%st
Cpu1  :  1.9%us,  2.4%sy,  0.0%ni, 94.8%id,  0.4%wa,  0.0%hi,  0.0%si,  0.5%st
Cpu2  :  1.9%us,  2.1%sy,  0.0%ni, 95.4%id,  0.1%wa,  0.0%hi,  0.0%si,  0.5%st
Cpu3  :  1.3%us,  1.7%sy,  0.0%ni, 96.2%id,  0.3%wa,  0.0%hi,  0.0%si,  0.5%st
Cpu4  :  1.1%us,  1.5%sy,  0.0%ni, 96.8%id,  0.1%wa,  0.0%hi,  0.0%si,  0.5%st
Cpu5  :  0.9%us,  1.4%sy,  0.0%ni, 97.2%id,  0.0%wa,  0.0%hi,  0.0%si,  0.5%st
Cpu6  :  0.8%us,  1.3%sy,  0.0%ni, 97.4%id,  0.0%wa,  0.0%hi,  0.0%si,  0.5%st
Cpu7  :  0.8%us,  1.2%sy,  0.0%ni, 97.4%id,  0.0%wa,  0.0%hi,  0.0%si,  0.5%st
Cpu8  :  0.7%us,  1.2%sy,  0.0%ni, 97.5%id,  0.1%wa,  0.0%hi,  0.0%si,  0.5%st
Cpu9  :  0.7%us,  1.2%sy,  0.0%ni, 97.5%id,  0.1%wa,  0.0%hi,  0.0%si,  0.5%st
Cpu10 :  0.6%us,  1.1%sy,  0.0%ni, 97.7%id,  0.0%wa,  0.0%hi,  0.0%si,  0.5%st
Cpu11 :  0.7%us,  1.1%sy,  0.0%ni, 97.6%id,  0.1%wa,  0.0%hi,  0.0%si,  0.5%st
Cpu12 :  0.7%us,  1.1%sy,  0.0%ni, 97.7%id,  0.0%wa,  0.0%hi,  0.0%si,  0.5%st
Cpu13 :  0.7%us,  1.1%sy,  0.0%ni, 97.6%id,  0.1%wa,  0.0%hi,  0.0%si,  0.5%st
Mem:   8372060k total,  7551116k used,   820944k free,  1834400k buffers
Swap:  1048568k total,        0k used,  1048568k free,  2597216k cached

  PID USER      PR  NI  VIRT  RES  SHR S %CPU %MEM    TIME+  COMMAND
37460 www-data  20   0  779m 111m  63m R   93  1.4   5:07.66 php-fpm
28122 www-data  20   0  738m  12m 3956 R   64  0.2   0:18.24 php-fpm
37449 www-data  20   0  777m  98m  51m R   61  1.2   5:13.37 php-fpm
27935 www-data  20   0  739m  16m 7392 R   60  0.2   0:31.46 php-fpm
37462 www-data  20   0  778m 108m  61m R   60  1.3   5:05.99 php-fpm
28119 www-data  20   0  738m  12m 3980 R   56  0.2   0:18.83 php-fpm
37452 www-data  20   0  777m 109m  63m R   55  1.3   5:00.77 php-fpm
27938 www-data  20   0  739m  16m 7376 R   53  0.2   0:25.12 php-fpm
27939 www-data  20   0  738m  12m 3980 R   53  0.2   0:21.74 php-fpm
37450 www-data  20   0  780m 115m  65m R   53  1.4   5:47.06 php-fpm
37465 www-data  20   0  764m  94m  61m R   53  1.2   5:15.87 php-fpm
28124 www-data  20   0  738m  12m 3972 R   52  0.2   0:18.12 php-fpm
37461 www-data  20   0  776m  98m  52m R   52  1.2   5:11.53 php-fpm
37467 www-data  20   0  778m 135m  87m R   52  1.7   5:20.84 php-fpm
28179 www-data  20   0  735m 7968 2628 R   50  0.1   0:02.08 php-fpm
28270 www-data  20   0  738m  12m 3968 R   48  0.2   0:18.80 php-fpm
37463 www-data  20   0  768m 104m  66m R   48  1.3   5:22.53 php-fpm
37453 www-data  20   0  777m 108m  61m R   47  1.3   5:46.63 php-fpm
28149 www-data  20   0  738m  12m 3972 R   45  0.2   0:14.44 php-fpm
37448 www-data  20   0  776m 104m  58m R   45  1.3   5:22.87 php-fpm
37457 www-data  20   0  778m 142m  95m R   45  1.7   5:18.96 php-fpm
37451 www-data  20   0  773m  97m  55m R   44  1.2   5:34.51 php-fpm
37455 www-data  20   0  771m 100m  59m R   44  1.2   5:18.36 php-fpm
37447 www-data  20   0  829m 178m  80m R   42  2.2   5:15.28 php-fpm
28172 www-data  20   0  735m 8044 2688 R   39  0.1   0:07.80 php-fpm
37468 www-data  20   0  770m  99m  59m R   39  1.2   5:25.87 php-fpm
37459 www-data  20   0  775m 105m  61m R   35  1.3   5:03.91 php-fpm
28860 root      20   0 10624  532  304 S    3  0.0   0:00.02 bash
  225 root      20   0     0    0    0 S    2  0.0   0:51.50 kjournald
28346 root      20   0 10624 1368 1144 S    2  0.0   0:00.09 bash
28859 root      20   0 19200 1380  912 R    2  0.0   0:00.02 top
    1 root      20   0  8356  780  648 S    0  0.0   0:10.47 init
    2 root      20   0     0    0    0 S    0  0.0   0:00.02 kthreadd
And this when the high load settings were switched off:
nginx high load off
ONEX_LOAD = 1823
FIVX_LOAD = 1418
uptime :
 16:32:11 up 2 days,  6:59,  2 users,  load average: 18.23, 14.18, 6.31
top :
top - 16:32:12 up 2 days,  6:59,  2 users,  load average: 18.23, 14.18, 6.31
Tasks: 253 total,   1 running, 252 sleeping,   0 stopped,   0 zombie
Cpu0  :  2.5%us,  2.5%sy,  0.0%ni, 91.3%id,  3.1%wa,  0.0%hi,  0.1%si,  0.6%st
Cpu1  :  1.9%us,  2.4%sy,  0.0%ni, 94.7%id,  0.4%wa,  0.0%hi,  0.0%si,  0.6%st
Cpu2  :  1.9%us,  2.1%sy,  0.0%ni, 95.3%id,  0.1%wa,  0.0%hi,  0.0%si,  0.6%st
Cpu3  :  1.3%us,  1.7%sy,  0.0%ni, 96.2%id,  0.3%wa,  0.0%hi,  0.0%si,  0.5%st
Cpu4  :  1.1%us,  1.6%sy,  0.0%ni, 96.7%id,  0.1%wa,  0.0%hi,  0.0%si,  0.5%st
Cpu5  :  0.9%us,  1.4%sy,  0.0%ni, 97.1%id,  0.0%wa,  0.0%hi,  0.0%si,  0.5%st
Cpu6  :  0.8%us,  1.3%sy,  0.0%ni, 97.4%id,  0.0%wa,  0.0%hi,  0.0%si,  0.5%st
Cpu7  :  0.8%us,  1.3%sy,  0.0%ni, 97.4%id,  0.0%wa,  0.0%hi,  0.0%si,  0.5%st
Cpu8  :  0.7%us,  1.2%sy,  0.0%ni, 97.5%id,  0.1%wa,  0.0%hi,  0.0%si,  0.5%st
Cpu9  :  0.7%us,  1.2%sy,  0.0%ni, 97.5%id,  0.1%wa,  0.0%hi,  0.0%si,  0.5%st
Cpu10 :  0.6%us,  1.1%sy,  0.0%ni, 97.7%id,  0.0%wa,  0.0%hi,  0.0%si,  0.5%st
Cpu11 :  0.7%us,  1.1%sy,  0.0%ni, 97.6%id,  0.1%wa,  0.0%hi,  0.0%si,  0.5%st
Cpu12 :  0.7%us,  1.2%sy,  0.0%ni, 97.6%id,  0.0%wa,  0.0%hi,  0.0%si,  0.5%st
Cpu13 :  0.7%us,  1.2%sy,  0.0%ni, 97.6%id,  0.1%wa,  0.0%hi,  0.0%si,  0.5%st
Mem:   8372060k total,  6993624k used,  1378436k free,  1834460k buffers
Swap:  1048568k total,        0k used,  1048568k free,  2598336k cached

  PID USER      PR  NI  VIRT  RES  SHR S %CPU %MEM    TIME+  COMMAND
33473 root      20   0 19200 1360  912 R    8  0.0   0:00.06 top
   30 root      RT   0     0    0    0 S    2  0.0   0:21.87 migration/9
33274 root      20   0 10620 1364 1148 S    2  0.0   0:00.03 bash
    1 root      20   0  8356  780  648 S    0  0.0   0:10.48 init
    2 root      20   0     0    0    0 S    0  0.0   0:00.02 kthreadd
    3 root      RT   0     0    0    0 S    0  0.0   0:39.41 migration/0
Following is what was written to the php-fpm error log:
[22-Jun-2013 16:28:48] WARNING: [pool www] child 37467, script '/data/disk/tn/static/transition-network-d6-p005/index.php' (request: "HEAD /index.php") executing too slow (32.756779 sec), logging
[22-Jun-2013 16:28:48] WARNING: [pool www] child 37463, script '/data/disk/tn/static/transition-network-d6-p005/index.php' (request: "HEAD /index.php") executing too slow (32.961709 sec), logging
[22-Jun-2013 16:28:48] WARNING: [pool www] child 37462, script '/data/disk/tn/static/transition-network-d6-p005/index.php' (request: "HEAD /index.php") executing too slow (33.430994 sec), logging
[22-Jun-2013 16:28:48] WARNING: [pool www] child 37461, script '/data/disk/tn/static/transition-network-d6-p005/index.php' (request: "HEAD /index.php") executing too slow (32.855172 sec), logging
[22-Jun-2013 16:28:48] WARNING: [pool www] child 37459, script '/data/disk/tn/static/transition-network-d6-p005/index.php' (request: "HEAD /index.php") executing too slow (33.163302 sec), logging
[22-Jun-2013 16:28:48] WARNING: [pool www] child 37456, script '/data/disk/tn/static/transition-network-d6-p005/index.php' (request: "HEAD /index.php") executing too slow (33.285125 sec), logging
[22-Jun-2013 16:28:48] WARNING: [pool www] child 37453, script '/data/disk/tn/static/transition-network-d6-p005/index.php' (request: "HEAD /index.php") executing too slow (32.776045 sec), logging
[22-Jun-2013 16:28:48] WARNING: [pool www] child 37451, script '/data/disk/tn/static/transition-network-d6-p005/index.php' (request: "HEAD /index.php") executing too slow (32.548963 sec), logging
[22-Jun-2013 16:28:48] WARNING: [pool www] child 37450, script '/data/disk/tn/static/transition-network-d6-p005/index.php' (request: "HEAD /index.php") executing too slow (32.966145 sec), logging
[22-Jun-2013 16:28:48] WARNING: [pool www] child 37448, script '/data/disk/tn/static/transition-network-d6-p005/index.php' (request: "HEAD /index.php") executing too slow (32.471156 sec), logging
[22-Jun-2013 16:28:48] WARNING: [pool www] child 37447, script '/data/disk/tn/static/transition-network-d6-p005/index.php' (request: "HEAD /index.php") executing too slow (32.587559 sec), logging
[22-Jun-2013 16:28:48] NOTICE: child 37467 stopped for tracing
[22-Jun-2013 16:28:48] NOTICE: about to trace 37467
[22-Jun-2013 16:28:48] ERROR: failed to ptrace(PEEKDATA) pid 37467: Input/output error (5)
[22-Jun-2013 16:28:49] NOTICE: finished trace of 37467
[22-Jun-2013 16:28:49] NOTICE: child 37447 stopped for tracing
[22-Jun-2013 16:28:49] NOTICE: about to trace 37447
[22-Jun-2013 16:28:49] NOTICE: finished trace of 37447
[22-Jun-2013 16:28:49] NOTICE: child 37448 stopped for tracing
[22-Jun-2013 16:28:49] NOTICE: about to trace 37448
[22-Jun-2013 16:28:50] NOTICE: finished trace of 37448
[22-Jun-2013 16:28:50] NOTICE: child 37450 stopped for tracing
[22-Jun-2013 16:28:50] NOTICE: about to trace 37450
[22-Jun-2013 16:28:50] NOTICE: finished trace of 37450
[22-Jun-2013 16:28:50] NOTICE: child 37451 stopped for tracing
[22-Jun-2013 16:28:50] NOTICE: about to trace 37451
[22-Jun-2013 16:28:50] ERROR: failed to ptrace(PEEKDATA) pid 37451: Input/output error (5)
[22-Jun-2013 16:28:50] NOTICE: finished trace of 37451
[22-Jun-2013 16:28:50] NOTICE: child 37453 stopped for tracing
[22-Jun-2013 16:28:50] NOTICE: about to trace 37453
[22-Jun-2013 16:28:50] ERROR: failed to ptrace(PEEKDATA) pid 37453: Input/output error (5)
[22-Jun-2013 16:28:50] NOTICE: finished trace of 37453
[22-Jun-2013 16:28:50] NOTICE: child 37456 stopped for tracing
[22-Jun-2013 16:28:50] NOTICE: about to trace 37456
[22-Jun-2013 16:28:50] NOTICE: finished trace of 37456
[22-Jun-2013 16:28:50] NOTICE: child 37459 stopped for tracing
[22-Jun-2013 16:28:50] NOTICE: about to trace 37459
[22-Jun-2013 16:28:50] NOTICE: finished trace of 37459
[22-Jun-2013 16:28:50] NOTICE: child 37461 stopped for tracing
[22-Jun-2013 16:28:50] NOTICE: about to trace 37461
[22-Jun-2013 16:28:51] NOTICE: finished trace of 37461
[22-Jun-2013 16:28:51] NOTICE: child 37462 stopped for tracing
[22-Jun-2013 16:28:51] NOTICE: about to trace 37462
[22-Jun-2013 16:28:51] NOTICE: finished trace of 37462
[22-Jun-2013 16:28:51] NOTICE: child 37463 stopped for tracing
[22-Jun-2013 16:28:51] NOTICE: about to trace 37463
[22-Jun-2013 16:28:51] NOTICE: finished trace of 37463
[22-Jun-2013 16:28:58] WARNING: [pool www] child 37468, script '/data/disk/tn/static/transition-network-d6-p005/index.php' (request: "GET /index.php") executing too slow (30.575101 sec), logging
[22-Jun-2013 16:28:58] WARNING: [pool www] child 37465, script '/data/disk/tn/static/transition-network-d6-p005/index.php' (request: "GET /index.php") executing too slow (32.165764 sec), logging
[22-Jun-2013 16:28:58] WARNING: [pool www] child 37460, script '/data/disk/tn/static/transition-network-d6-p005/index.php' (request: "GET /index.php") executing too slow (30.519804 sec), logging
[22-Jun-2013 16:28:58] WARNING: [pool www] child 37455, script '/data/disk/tn/static/transition-network-d6-p005/index.php' (request: "GET /index.php") executing too slow (33.314712 sec), logging
[22-Jun-2013 16:28:58] NOTICE: child 37455 stopped for tracing
[22-Jun-2013 16:28:58] NOTICE: about to trace 37455
[22-Jun-2013 16:28:58] NOTICE: finished trace of 37455
[22-Jun-2013 16:28:58] NOTICE: child 37468 stopped for tracing
[22-Jun-2013 16:28:58] NOTICE: about to trace 37468
[22-Jun-2013 16:28:58] NOTICE: finished trace of 37468
[22-Jun-2013 16:28:58] NOTICE: child 37465 stopped for tracing
[22-Jun-2013 16:28:58] NOTICE: about to trace 37465
[22-Jun-2013 16:28:58] NOTICE: finished trace of 37465
[22-Jun-2013 16:28:58] NOTICE: child 37460 stopped for tracing
[22-Jun-2013 16:28:58] NOTICE: about to trace 37460
[22-Jun-2013 16:28:58] NOTICE: finished trace of 37460
[22-Jun-2013 16:29:08] WARNING: [pool www] child 27935, script '/data/disk/tn/static/transition-network-d6-p005/index.php' (request: "GET /index.php") executing too slow (32.151806 sec), logging
[22-Jun-2013 16:29:08] WARNING: [pool www] child 37457, script '/data/disk/tn/static/transition-network-d6-p005/index.php' (request: "HEAD /index.php") executing too slow (35.993879 sec), logging
[22-Jun-2013 16:29:08] WARNING: [pool www] child 37452, script '/data/disk/tn/static/transition-network-d6-p005/index.php' (request: "HEAD /index.php") executing too slow (35.808820 sec), logging
[22-Jun-2013 16:29:08] WARNING: [pool www] child 37449, script '/data/disk/tn/static/transition-network-d6-p005/index.php' (request: "GET /index.php") executing too slow (32.840217 sec), logging
[22-Jun-2013 16:29:08] NOTICE: child 37449 stopped for tracing
[22-Jun-2013 16:29:08] NOTICE: about to trace 37449
[22-Jun-2013 16:29:08] NOTICE: finished trace of 37449
[22-Jun-2013 16:29:08] NOTICE: child 37457 stopped for tracing
[22-Jun-2013 16:29:08] NOTICE: about to trace 37457
[22-Jun-2013 16:29:08] NOTICE: finished trace of 37457
[22-Jun-2013 16:29:08] NOTICE: child 27935 stopped for tracing
[22-Jun-2013 16:29:08] NOTICE: about to trace 27935
[22-Jun-2013 16:29:08] NOTICE: finished trace of 27935
[22-Jun-2013 16:29:08] NOTICE: child 37452 stopped for tracing
[22-Jun-2013 16:29:08] NOTICE: about to trace 37452
[22-Jun-2013 16:29:08] NOTICE: finished trace of 37452
[22-Jun-2013 16:29:18] WARNING: [pool www] child 27938, script '/data/disk/tn/static/transition-network-d6-p005/index.php' (request: "GET /index.php") executing too slow (38.701855 sec), logging
[22-Jun-2013 16:29:19] NOTICE: child 27938 stopped for tracing
[22-Jun-2013 16:29:19] NOTICE: about to trace 27938
[22-Jun-2013 16:29:19] NOTICE: finished trace of 27938
[22-Jun-2013 16:29:28] WARNING: [pool www] child 28270, script '/data/disk/tn/static/transition-network-d6-p005/index.php' (request: "GET /index.php") executing too slow (35.445436 sec), logging
[22-Jun-2013 16:29:28] WARNING: [pool www] child 28124, script '/data/disk/tn/static/transition-network-d6-p005/index.php' (request: "GET /index.php") executing too slow (34.018885 sec), logging
[22-Jun-2013 16:29:28] WARNING: [pool www] child 28122, script '/data/disk/tn/static/transition-network-d6-p005/index.php' (request: "GET /index.php") executing too slow (35.779858 sec), logging
[22-Jun-2013 16:29:28] WARNING: [pool www] child 28119, script '/data/disk/tn/static/transition-network-d6-p005/index.php' (request: "GET /index.php") executing too slow (38.116857 sec), logging
[22-Jun-2013 16:29:28] WARNING: [pool www] child 27939, script '/data/disk/tn/static/transition-network-d6-p005/index.php' (request: "GET /index.php") executing too slow (39.816647 sec), logging
[22-Jun-2013 16:29:28] NOTICE: child 27939 stopped for tracing
[22-Jun-2013 16:29:28] NOTICE: about to trace 27939
[22-Jun-2013 16:29:28] NOTICE: finished trace of 27939
[22-Jun-2013 16:29:28] NOTICE: child 28119 stopped for tracing
[22-Jun-2013 16:29:28] NOTICE: about to trace 28119
[22-Jun-2013 16:29:28] NOTICE: finished trace of 28119
[22-Jun-2013 16:29:28] NOTICE: child 28122 stopped for tracing
[22-Jun-2013 16:29:28] NOTICE: about to trace 28122
[22-Jun-2013 16:29:28] NOTICE: finished trace of 28122
[22-Jun-2013 16:29:28] NOTICE: child 28270 stopped for tracing
[22-Jun-2013 16:29:28] NOTICE: about to trace 28270
[22-Jun-2013 16:29:28] NOTICE: finished trace of 28270
[22-Jun-2013 16:29:28] NOTICE: child 28124 stopped for tracing
[22-Jun-2013 16:29:28] NOTICE: about to trace 28124
[22-Jun-2013 16:29:28] NOTICE: finished trace of 28124
[22-Jun-2013 16:29:48] WARNING: [pool www] child 28172, script '/data/disk/tn/static/transition-network-d6-p005/index.php' (request: "GET /index.php") executing too slow (36.209643 sec), logging
[22-Jun-2013 16:29:48] NOTICE: child 28172 stopped for tracing
[22-Jun-2013 16:29:48] NOTICE: about to trace 28172
[22-Jun-2013 16:29:48] NOTICE: finished trace of 28172
[22-Jun-2013 16:29:58] WARNING: [pool www] child 28179, script '/data/disk/tn/static/transition-network-d6-p005/index.php' (request: "GET /index.php") executing too slow (32.836693 sec), logging
[22-Jun-2013 16:29:58] NOTICE: child 28179 stopped for tracing
[22-Jun-2013 16:29:58] NOTICE: about to trace 28179
[22-Jun-2013 16:29:58] NOTICE: finished trace of 28179
[22-Jun-2013 16:31:19] WARNING: [pool www] child 28274, script '/data/disk/tn/static/transition-network-d6-p005/index.php' (request: "GET /index.php") executing too slow (31.870912 sec), logging
[22-Jun-2013 16:31:19] NOTICE: child 28274 stopped for tracing
[22-Jun-2013 16:31:19] NOTICE: about to trace 28274
[22-Jun-2013 16:31:19] NOTICE: finished trace of 28274
[22-Jun-2013 16:31:29] WARNING: [pool www] child 28585, script '/data/disk/tn/static/transition-network-d6-p005/index.php' (request: "GET /index.php") executing too slow (30.940790 sec), logging
[22-Jun-2013 16:31:29] WARNING: [pool www] child 28330, script '/data/disk/tn/static/transition-network-d6-p005/index.php' (request: "GET /index.php") executing too slow (31.058969 sec), logging
[22-Jun-2013 16:31:29] WARNING: [pool www] child 28319, script '/data/disk/tn/static/transition-network-d6-p005/index.php' (request: "GET /index.php") executing too slow (32.307274 sec), logging
[22-Jun-2013 16:31:29] WARNING: [pool www] child 37456, script '/data/disk/tn/static/transition-network-d6-p005/index.php' (request: "GET /index.php") executing too slow (30.795803 sec), logging
[22-Jun-2013 16:31:29] NOTICE: child 37456 stopped for tracing
[22-Jun-2013 16:31:29] NOTICE: about to trace 37456
[22-Jun-2013 16:31:29] NOTICE: finished trace of 37456
[22-Jun-2013 16:31:29] NOTICE: child 28319 stopped for tracing
[22-Jun-2013 16:31:29] NOTICE: about to trace 28319
[22-Jun-2013 16:31:29] NOTICE: finished trace of 28319
[22-Jun-2013 16:31:29] NOTICE: child 28330 stopped for tracing
[22-Jun-2013 16:31:29] NOTICE: about to trace 28330
[22-Jun-2013 16:31:29] NOTICE: finished trace of 28330
[22-Jun-2013 16:31:29] NOTICE: child 28585 stopped for tracing
[22-Jun-2013 16:31:29] NOTICE: about to trace 28585
[22-Jun-2013 16:31:29] NOTICE: finished trace of 28585
[22-Jun-2013 16:31:39] WARNING: [pool www] child 28149, script '/data/disk/tn/static/transition-network-d6-p005/index.php' (request: "POST /index.php") executing too slow (37.492814 sec), logging
[22-Jun-2013 16:31:39] WARNING: [pool www] child 28133, script '/data/disk/tn/static/transition-network-d6-p005/index.php' (request: "POST /index.php") executing too slow (39.911357 sec), logging
[22-Jun-2013 16:31:39] WARNING: [pool www] child 37462, script '/data/disk/tn/static/transition-network-d6-p005/index.php' (request: "GET /index.php") executing too slow (32.647110 sec), logging
[22-Jun-2013 16:31:39] NOTICE: child 28133 stopped for tracing
[22-Jun-2013 16:31:39] NOTICE: about to trace 28133
[22-Jun-2013 16:31:39] ERROR: failed to ptrace(PEEKDATA) pid 28133: Input/output error (5)
[22-Jun-2013 16:31:39] NOTICE: finished trace of 28133
[22-Jun-2013 16:31:39] NOTICE: child 28149 stopped for tracing
[22-Jun-2013 16:31:39] NOTICE: about to trace 28149
[22-Jun-2013 16:31:39] ERROR: failed to ptrace(PEEKDATA) pid 28149: Input/output error (5)
[22-Jun-2013 16:31:39] NOTICE: finished trace of 28149
[22-Jun-2013 16:31:39] NOTICE: child 37462 stopped for tracing
[22-Jun-2013 16:31:39] NOTICE: about to trace 37462
[22-Jun-2013 16:31:39] ERROR: failed to ptrace(PEEKDATA) pid 37462: Input/output error (5)
[22-Jun-2013 16:31:39] NOTICE: finished trace of 37462
Changed 3 years ago by chris
- Attachment puffin-cpu-day-2013-06-22.png added
Puffin CPU Spikes 2013-06-22
Changed 3 years ago by chris
- Attachment puffin-load-day-2013-06-22.png added
Puffin Load Spikes 2013-06-22
comment:54 Changed 3 years ago by chris
- Add Hours to Ticket changed from 0.0 to 0.1
- Total Hours changed from 20.78 to 20.88
The images that have just been attached which illustrate the spikes:


comment:55 Changed 3 years ago by chris
- Add Hours to Ticket changed from 0.0 to 0.5
- Total Hours changed from 20.88 to 21.38
I have done some more work on configuring awstats, see wiki:AwStatsInstall#Awstatsinstall
comment:56 Changed 3 years ago by chris
- Add Hours to Ticket changed from 0.0 to 0.3
- Total Hours changed from 21.38 to 21.68
The max number of MySQL connections of 75 has been reached again and following is the result of perl /usr/local/bin/mysqltuner.pl:
 >>  MySQLTuner 1.2.0 - Major Hayden <major@mhtx.net>
 >>  Bug reports, feature requests, and downloads at http://mysqltuner.com/
 >>  Run with '--help' for additional options and output filtering
[OK] Logged in using credentials from debian maintenance account.

-------- General Statistics --------------------------------------------------
[--] Skipped version check for MySQLTuner script
[OK] Currently running supported MySQL version 5.5.31-MariaDB-1~squeeze-log
[OK] Operating on 64-bit architecture

-------- Storage Engine Statistics -------------------------------------------
[--] Status: +Archive -BDB +Federated +InnoDB -ISAM -NDBCluster
[--] Data in MyISAM tables: 104M (Tables: 2)
[--] Data in InnoDB tables: 447M (Tables: 1037)
[--] Data in PERFORMANCE_SCHEMA tables: 0B (Tables: 17)
[!!] Total fragmented tables: 99

-------- Security Recommendations  -------------------------------------------
[OK] All database users have passwords assigned

-------- Performance Metrics -------------------------------------------------
[--] Up for: 3d 4h 15m 14s (16M q [60.080 qps], 449K conn, TX: 31B, RX: 2B)
[--] Reads / Writes: 87% / 13%
[--] Total buffers: 1.1G global + 13.4M per thread (75 max threads)
[OK] Maximum possible memory usage: 2.1G (26% of installed RAM)
[OK] Slow queries: 0% (93/16M)
[!!] Highest connection usage: 100%  (76/75)
[OK] Key buffer size / total MyISAM indexes: 509.0M/93.2M
[OK] Key buffer hit rate: 98.3% (32M cached / 568K reads)
[OK] Query cache efficiency: 73.8% (10M cached / 14M selects)
[!!] Query cache prunes per day: 888102
[OK] Sorts requiring temporary tables: 2% (9K temp sorts / 440K sorts)
[!!] Joins performed without indexes: 15445
[!!] Temporary tables created on disk: 30% (157K on disk / 522K total)
[OK] Thread cache hit rate: 99% (76 created / 449K connections)
[!!] Table cache hit rate: 0% (128 open / 118K opened)
[OK] Open file limit used: 0% (4/196K)
[OK] Table locks acquired immediately: 99% (5M immediate / 5M locks)
[OK] InnoDB data size / buffer pool: 447.2M/509.0M

-------- Recommendations -----------------------------------------------------
General recommendations:
    Run OPTIMIZE TABLE to defragment tables for better performance
    Reduce or eliminate persistent connections to reduce connection usage
    Adjust your join queries to always utilize indexes
    When making adjustments, make tmp_table_size/max_heap_table_size equal
    Reduce your SELECT DISTINCT queries without LIMIT clauses
    Increase table_cache gradually to avoid file descriptor limits
Variables to adjust:
    max_connections (> 75)
    wait_timeout (< 3600)
    interactive_timeout (< 28800)
    query_cache_size (> 64M)
    join_buffer_size (> 1.0M, or always use indexes with joins)
    tmp_table_size (> 64M)
    max_heap_table_size (> 128M)
    table_cache (> 128)
These values in /etc/my.cnf have been increased as suggested, but I haven't changed the timeout values as these should also be checked for php-fpm and nginx:
#join_buffer_size        = 1M
join_buffer_size        = 2M

#max_connections         = 75
#max_user_connections    = 75
max_connections         = 100
max_user_connections    = 100

#query_cache_size        = 64M
query_cache_size        = 128M

#table_cache             = 128
table_cache             = 256

#max_heap_table_size     = 128M
max_heap_table_size     = 256M

#tmp_table_size          = 64M
tmp_table_size          = 128M
And mysql has been restarted.
comment:57 Changed 3 years ago by chris
- Add Hours to Ticket changed from 0.0 to 0.25
- Priority changed from critical to major
- Total Hours changed from 21.68 to 21.93
- Description modified (diff)
- Summary changed from Load spikes, ksoftirqd using all the CPU and services stopping for 15 min at a time to Load spikes causing the TN site to be stopped for 15 min at a time
I think there is still potential for performance improvements via mysql tuning, however I'm reluctant to allocate additional RAM to MySQL when I'm not sure if the current allocation of 8GB to puffin (it did have 4GB) is going to be permanent.
Following is the latest result of perl /usr/local/bin/mysqltuner.pl:
 >>  MySQLTuner 1.2.0 - Major Hayden <major@mhtx.net>
 >>  Bug reports, feature requests, and downloads at http://mysqltuner.com/
 >>  Run with '--help' for additional options and output filtering
[OK] Logged in using credentials from debian maintenance account.

-------- General Statistics --------------------------------------------------
[--] Skipped version check for MySQLTuner script
[OK] Currently running supported MySQL version 5.5.31-MariaDB-1~squeeze-log
[OK] Operating on 64-bit architecture

-------- Storage Engine Statistics -------------------------------------------
[--] Status: +Archive -BDB +Federated +InnoDB -ISAM -NDBCluster
[--] Data in MyISAM tables: 104M (Tables: 2)
[--] Data in InnoDB tables: 456M (Tables: 1037)
[--] Data in PERFORMANCE_SCHEMA tables: 0B (Tables: 17)
[!!] Total fragmented tables: 101

-------- Security Recommendations  -------------------------------------------
[OK] All database users have passwords assigned

-------- Performance Metrics -------------------------------------------------
[--] Up for: 20h 55m 18s (5M q [67.881 qps], 130K conn, TX: 9B, RX: 841M)
[--] Reads / Writes: 82% / 18%
[--] Total buffers: 1.3G global + 14.4M per thread (100 max threads)
[OK] Maximum possible memory usage: 2.7G (33% of installed RAM)
[OK] Slow queries: 0% (24/5M)
[OK] Highest usage of available connections: 60% (60/100)
[OK] Key buffer size / total MyISAM indexes: 509.0M/93.9M
[OK] Key buffer hit rate: 98.7% (9M cached / 117K reads)
[OK] Query cache efficiency: 78.3% (3M cached / 4M selects)
[!!] Query cache prunes per day: 486359
[OK] Sorts requiring temporary tables: 2% (3K temp sorts / 109K sorts)
[!!] Joins performed without indexes: 4597
[!!] Temporary tables created on disk: 27% (37K on disk / 136K total)
[OK] Thread cache hit rate: 99% (60 created / 130K connections)
[!!] Table cache hit rate: 0% (256 open / 38K opened)
[OK] Open file limit used: 0% (6/196K)
[OK] Table locks acquired immediately: 99% (1M immediate / 1M locks)
[OK] InnoDB data size / buffer pool: 456.7M/509.0M

-------- Recommendations -----------------------------------------------------
General recommendations:
    Run OPTIMIZE TABLE to defragment tables for better performance
    MySQL started within last 24 hours - recommendations may be inaccurate
    Adjust your join queries to always utilize indexes
    When making adjustments, make tmp_table_size/max_heap_table_size equal
    Reduce your SELECT DISTINCT queries without LIMIT clauses
    Increase table_cache gradually to avoid file descriptor limits
Variables to adjust:
    query_cache_size (> 128M)
    join_buffer_size (> 2.0M, or always use indexes with joins)
    tmp_table_size (> 128M)
    max_heap_table_size (> 256M)
    table_cache (> 256)
And this is the result of the /usr/local/bin/tuning-primer.sh script, found via, http://www.day32.com/MySQL/
        -- MYSQL PERFORMANCE TUNING PRIMER --
             - By: Matthew Montgomery -

MySQL Version 5.5.31-MariaDB-1~squeeze-log x86_64

Uptime = 0 days 20 hrs 57 min 38 sec
Avg. qps = 67
Total Questions = 5123458
Threads Connected = 3

Warning: Server has not been running for at least 48hrs.
It may not be safe to use these recommendations

To find out more information on how each of these
runtime variables effects performance visit:
http://dev.mysql.com/doc/refman/5.5/en/server-system-variables.html
Visit http://www.mysql.com/products/enterprise/advisors.html
for info about MySQL's Enterprise Monitoring and Advisory Service

SLOW QUERIES
The slow query log is enabled.
Current long_query_time = 5.000000 sec.
You have 25 out of 5123512 that take longer than 5.000000 sec. to complete
Your long_query_time seems to be fine

BINARY UPDATE LOG
The binary update log is NOT enabled.
You will not be able to do point in time recovery
See http://dev.mysql.com/doc/refman/5.5/en/point-in-time-recovery.html

WORKER THREADS
Current thread_cache_size = 128
Current threads_cached = 58
Current threads_per_sec = 0
Historic threads_per_sec = 0
Your thread_cache_size is fine

MAX CONNECTIONS
Current max_connections = 100
Current threads_connected = 2
Historic max_used_connections = 60
The number of used connections is 60% of the configured maximum.
Your max_connections variable seems to be fine.

INNODB STATUS
Current InnoDB index space = 177 M
Current InnoDB data space = 457 M
Current InnoDB buffer pool free = 0 %
Current innodb_buffer_pool_size = 509 M
Depending on how much space your innodb indexes take up it may be safe
to increase this value to up to 2 / 3 of total system memory

MEMORY USAGE
Max Memory Ever Allocated : 1.97 G
Configured Max Per-thread Buffers : 1.40 G
Configured Max Global Buffers : 1.13 G
Configured Max Memory Limit : 2.53 G
Physical Memory : 7.98 G
Max memory limit seem to be within acceptable norms

KEY BUFFER
Current MyISAM index space = 93 M
Current key_buffer_size = 509 M
Key cache miss rate is 1 : 78
Key buffer free ratio = 81 %
Your key_buffer_size seems to be fine

QUERY CACHE
Query cache is enabled
Current query_cache_size = 128 M
Current query_cache_used = 78 M
Current query_cache_limit = 128 K
Current Query cache Memory fill ratio = 61.62 %
Current query_cache_min_res_unit = 4 K
MySQL won't cache query results that are larger than query_cache_limit in size

SORT OPERATIONS
Current sort_buffer_size = 128 K
Current read_rnd_buffer_size = 4 M
Sort buffer seems to be fine

JOINS
tuning-primer.sh: line 402: export: `2097152': not a valid identifier
Current join_buffer_size = 2.00 M
You have had 4607 queries where a join could not use an index properly
You should enable "log-queries-not-using-indexes"
Then look for non indexed joins in the slow query log.
If you are unable to optimize your queries you may want to increase your
join_buffer_size to accommodate larger joins in one pass.

Note! This script will still suggest raising the join_buffer_size when
ANY joins not using indexes are found.

OPEN FILES LIMIT
Current open_files_limit = 196608 files
The open_files_limit should typically be set to at least 2x-3x
that of table_cache if you have heavy MyISAM usage.
Your open_files_limit value seems to be fine

TABLE CACHE
Current table_open_cache = 256 tables
Current table_definition_cache = 512 tables
You have a total of 1080 tables
You have 256 open tables.
Current table_cache hit rate is 0%
, while 100% of your table cache is in use
You should probably increase your table_cache
You should probably increase your table_definition_cache value.

TEMP TABLES
Current max_heap_table_size = 256 M
Current tmp_table_size = 128 M
Of 99254 temp tables, 27% were created on disk
Perhaps you should increase your tmp_table_size and/or max_heap_table_size
to reduce the number of disk-based temporary tables
Note! BLOB and TEXT columns are not allow in memory tables.
If you are using these columns raising these values might not impact your
ratio of on disk temp tables.

TABLE SCANS
Current read_buffer_size = 8 M
Current table scan ratio = 92 : 1
read_buffer_size seems to be fine

TABLE LOCKING
Current Lock Wait ratio = 1 : 114280
Your table locking seems to be fine
The description of this ticket has been edited.
comment:58 Changed 3 years ago by chris
- Add Hours to Ticket changed from 0.0 to 0.85
- Total Hours changed from 21.93 to 22.78
Following a chat with Ed these are the things I'm going to work on:
- RAM - document how the additional 4GB has improved performance.
- Finish sorting out the wiki:AwStatsInstall so we have some better data on the site traffic, (wiki:PiwikServer excludes bots).
I also intend to do these things:
- Further tune MySQL
- Script the edits to the MySQL, Nginx and php-fpm config files so they don't take 15 mins to do manually after each BOA upgrade. Perhaps a set of vim scripts for editing the config files would make sense so that each change could be reviewed rather than totally automating it.
- Raise a BOA ticket regarding the thresholds in second.sh which we have had to tweak.
A question for Jim, currently there is enough RAM that we could double the Redis RAM from 512MB to 1GB -- any reason not to do this? The performance drop when we didn't have Redis running was very significant and I expect that giving Redis extra RAM would speed things up.
comment:59 follow-up: ↓ 68 Changed 3 years ago by jim
Chris, check out the variables in .barracuda.cnf as they allow seeing
custom php.ini, my.cnf & others. No need to script most stuff.

The question is around second.sh - ideally we'd supply a patch that allows
tuning of scripts in /var/xdrago to our needs.
On 24 Jun 2013 12:04, "Transiton Technology Trac" <
trac@tech.transitionnetwork.org> wrote:

> #555: Load spikes causing the TN site to be stopped for 15 min at a time
> -------------------------------------+-------------------------------------
>            Reporter:  chris          |                      Owner:  chris
>                Type:  maintenance    |                     Status:  new
>            Priority:  major          |                  Milestone:
>           Component:  Live server    |  Maintenance
>            Keywords:                 |                 Resolution:
> Add Hours to Ticket:  0.85           |  Estimated Number of Hours:  0.25
>         Total Hours:  21.93          |                  Billable?:  1
> -------------------------------------+-------------------------------------
> Changes (by chris):
>
>  * hours:  0.0 => 0.85
>  * totalhours:  21.93 => 22.78
>
>
> Comment:
>
>  Following a chat with Ed these are the things I'm going to work on:
>
>  * RAM - document how the additional 4GB has improved performance.
>  * Finish sorting out the wiki:AwStatsInstall so we have some better data
>  on the site traffic, (wiki:PiwikServer excludes bots).
>
>  I also intend to do these things:
>
>  * Further tune MySQL
>  * Script the edits to the MySQL, Nginx and php-fpm config files so they
>  don't take 15 mins to do manually after each BOA upgrade. Perhaps a set of
>  vim scripts for editing the config files would make sense so that each
>  change could be reviewed rather than totally automating it.
>  * Raise a BOA ticket regarding the thresholds in {{{second.sh}}} which we
>  have had to tweak.
>
>  A question for Jim, currently there is enough RAM that we could double the
>  Redis RAM from 512MB to 1GB -- any reason not to do this? The performance
>  drop when we didn't have Redis running was very significant and I expect
>  that giving Redis extra RAM would speed things up.
>
> --
> Ticket URL: <https://tech.transitionnetwork.org/trac/ticket/555#comment:58
> >
> Transition Technology <https://tech.transitionnetwork.org/trac>
> Support and issues tracking for the Transition Network Web Project.
>
comment:60 Changed 3 years ago by chris
- Add Hours to Ticket changed from 0.0 to 0.3
- Total Hours changed from 22.78 to 23.08
Since we are going to run with the extra 4GB of RAM, for some weeks at least, I have made the following tweaks to /etc/mysql/my.cnf based on suggestions in #comment:57:
#innodb_buffer_pool_size = 509M
innodb_buffer_pool_size = 600M

#query_cache_limit       = 128K
query_cache_limit       = 256K

#query_cache_size        = 64M
query_cache_size        = 512M

#log_queries_not_using_indexes
log_queries_not_using_indexes

#join_buffer_size        = 1M
join_buffer_size        = 6M

#table_cache             = 128
table_cache             = 2048

#tmp_table_size          = 64M
tmp_table_size          = 512M

#max_heap_table_size     = 128M
max_heap_table_size     = 1024M
There is a copy of my.cnf in /root/ just in case all the changes are clobbered.
The tuning scripts should be run again tomorrow to see what they suggest, they already make some more suggested changes but I don't want to restart mysql more than absolutely necessary so these tweaks can wait, plus they are contradictory regarding joins / indexes:
[!!] Joins performed without indexes: 124
[!!] Temporary tables created on disk: 26% (1K on disk / 3K total)

    Adjust your join queries to always utilize indexes

    join_buffer_size (> 6.0M, or always use indexes with joins)
Current join_buffer_size = 6.00 M
You have had 129 queries where a join could not use an index properly
join_buffer_size >= 4 M
This is not advised
You should enable "log-queries-not-using-indexes"
Then look for non indexed joins in the slow query log.

Current table_open_cache = 2048 tables
Current table_definition_cache = 512 tables
You have a total of 1080 tables
You have 1107 open tables.
The table_cache value seems to be fine
You should probably increase your table_definition_cache value.
comment:61 Changed 3 years ago by chris
- Add Hours to Ticket changed from 0.0 to 0.25
- Total Hours changed from 23.08 to 23.33
I have made a start on a page documenting the wiki:RamUsage by wiki:PuffinServer and I'll also add a section to it about wiki:PenguinServer as this machine is currently swapping a fair amount and looks like it would also benefit from some additional RAM, see the munin stats here:
Direct link to the RAM usage page:
The plan for the wiki:RamUsage page being to document the need for additional RAM in order that the cost can be justified.
comment:62 Changed 3 years ago by jim
Further to my last regarding a patch for second.sh...
cat /proc/cpuinfo | grep processor | wc -l returns number of CPUs for any Linux box.
So if we had sensible defaults for 1 cpu, then we should be able to multiply it through by the number of CPUs.
As long as the results match up with the default (which I think expects 4 CPUs) and ours with 14, we're onto a winner and the patch is more likely to be accepted.
Unless there's a load variable in the system that is already aware of the # of cores?
comment:63 Changed 3 years ago by jim
grep -c processor /proc/cpuinfo being a much nicer way of getting the CPU count, and already used in /var/xdrago/proc_num_ctrl.cgi.
comment:64 Changed 3 years ago by jim
- Add Hours to Ticket changed from 0.0 to 0.15
- Total Hours changed from 23.33 to 23.48
comment:65 Changed 3 years ago by chris
- Add Hours to Ticket changed from 0.0 to 1.7
- Total Hours changed from 23.48 to 25.18
We just had another load spike, the high load config was switched on at 10:01:14 am when the load hit 23 and then 8 mins later the load hit 90 and and web server was stopped and it wasn't until 6 mins after that the the load had dropped enough for services to be started up again. Pingdom measured 5 mins of downtime:
www.transitionnetwork.org (www.transitionnetwork.org) is UP again at 25/06/2013 10:12:57, after 5m of downtime.
Following is what was logged when the high load config was switched on:
nginx high load on
ONEX_LOAD = 2182
FIVX_LOAD = 624
uptime :
 10:01:14 up 5 days, 28 min,  1 user,  load average: 23.44, 6.83, 2.61
top :
top - 10:01:22 up 5 days, 28 min,  1 user,  load average: 24.36, 7.30, 2.79
Tasks: 290 total,  23 running, 261 sleeping,   2 stopped,   4 zombie
Cpu0  :  2.4%us,  2.4%sy,  0.0%ni, 91.3%id,  3.2%wa,  0.0%hi,  0.1%si,  0.5%st
Cpu1  :  1.9%us,  2.4%sy,  0.0%ni, 94.9%id,  0.3%wa,  0.0%hi,  0.0%si,  0.5%st
Cpu2  :  1.9%us,  2.1%sy,  0.0%ni, 95.3%id,  0.2%wa,  0.0%hi,  0.0%si,  0.5%st
Cpu3  :  1.2%us,  1.6%sy,  0.0%ni, 96.4%id,  0.2%wa,  0.0%hi,  0.0%si,  0.5%st
Cpu4  :  1.1%us,  1.5%sy,  0.0%ni, 96.9%id,  0.1%wa,  0.0%hi,  0.0%si,  0.5%st
Cpu5  :  0.9%us,  1.4%sy,  0.0%ni, 97.2%id,  0.0%wa,  0.0%hi,  0.0%si,  0.5%st
Cpu6  :  0.8%us,  1.3%sy,  0.0%ni, 97.4%id,  0.0%wa,  0.0%hi,  0.0%si,  0.5%st
Cpu7  :  0.7%us,  1.2%sy,  0.0%ni, 97.5%id,  0.1%wa,  0.0%hi,  0.0%si,  0.5%st
Cpu8  :  0.7%us,  1.2%sy,  0.0%ni, 97.6%id,  0.1%wa,  0.0%hi,  0.0%si,  0.5%st
Cpu9  :  0.7%us,  1.1%sy,  0.0%ni, 97.6%id,  0.1%wa,  0.0%hi,  0.0%si,  0.5%st
Cpu10 :  0.6%us,  1.1%sy,  0.0%ni, 97.7%id,  0.0%wa,  0.0%hi,  0.0%si,  0.5%st
Cpu11 :  0.7%us,  1.1%sy,  0.0%ni, 97.7%id,  0.1%wa,  0.0%hi,  0.0%si,  0.5%st
Cpu12 :  0.6%us,  1.1%sy,  0.0%ni, 97.7%id,  0.0%wa,  0.0%hi,  0.0%si,  0.5%st
Cpu13 :  0.6%us,  1.1%sy,  0.0%ni, 97.7%id,  0.1%wa,  0.0%hi,  0.0%si,  0.5%st
Mem:   8372060k total,  6287004k used,  2085056k free,  1023812k buffers
Swap:  1048568k total,        0k used,  1048568k free,  2230356k cached

  PID USER      PR  NI  VIRT  RES  SHR S %CPU %MEM    TIME+  COMMAND
65172 nobody    20   0     8    4    0 R  177  0.0   0:03.52 munin-node
65080 root      20   0     0    0    0 R  137  0.0   0:13.79 lfd
65168 root      20   0 19200 1396  912 R  128  0.0   0:03.75 top
65115 aegir     20   0  217m  10m 6888 R  103  0.1   0:10.47 drush.php
65134 root      20   0 53504  14m  560 R   95  0.2   0:05.99 lfd
65117 root      20   0 53504  14m  592 R   75  0.2   0:06.34 lfd
64944 root      20   0 13292 3512  452 R   71  0.0   0:38.39 bzip2
64971 tn        20   0  222m  17m 8600 R   62  0.2   0:31.50 php
65175 root      20   0     0    0    0 R   54  0.0   0:00.93 bash
65107 root      20   0 10684 1428 1144 R   47  0.0   0:03.16 bash
65176 root      20   0  5368  568  480 S   40  0.0   0:00.68 sleep
64825 aegir     20   0  234m  25m 8740 R   38  0.3   0:48.37 drush.php
56567 root      20   0  734m 7312 2160 R   27  0.1   0:12.85 php-fpm
30652 redis     20   0  191m  35m  920 R   22  0.4   3:42.47 redis-server
64828 root      20   0 10852 1660 1208 S   21  0.0   0:23.99 backupninja
65153 root      20   0     0    0    0 R   21  0.0   0:00.36 grep
65155 root      20   0     0    0    0 R   19  0.0   0:00.59 awk
28288 www-data  20   0  776m 143m  99m S   14  1.8   3:00.57 php-fpm
65129 root      20   0 10616 1344 1128 R    8  0.0   0:00.86 bash
    1 root      20   0  8356  780  648 S    0  0.0   0:20.22 init
    2 root      20   0     0    0    0 S    0  0.0   0:00.02 kthreadd
Switching to the high load configuration didn't bring the load down this time, 8 mins later the load is at 90 and we have this logged:
php-fpm and nginx about to be killed
ONEX_LOAD = 9086
FIVX_LOAD = 6301
uptime :
 10:09:59 up 5 days, 36 min,  1 user,  load average: 90.86, 63.01, 30.97
top :
top - 10:10:00 up 5 days, 36 min,  1 user,  load average: 87.10, 62.69, 31.04
Tasks: 343 total,  32 running, 311 sleeping,   0 stopped,   0 zombie
Cpu0  :  2.4%us,  2.4%sy,  0.0%ni, 91.3%id,  3.2%wa,  0.0%hi,  0.1%si,  0.6%st
Cpu1  :  1.9%us,  2.4%sy,  0.0%ni, 94.8%id,  0.3%wa,  0.0%hi,  0.0%si,  0.5%st
Cpu2  :  1.9%us,  2.1%sy,  0.0%ni, 95.3%id,  0.2%wa,  0.0%hi,  0.0%si,  0.5%st
Cpu3  :  1.2%us,  1.7%sy,  0.0%ni, 96.4%id,  0.2%wa,  0.0%hi,  0.0%si,  0.5%st
Cpu4  :  1.1%us,  1.5%sy,  0.0%ni, 96.8%id,  0.1%wa,  0.0%hi,  0.0%si,  0.5%st
Cpu5  :  0.9%us,  1.4%sy,  0.0%ni, 97.2%id,  0.0%wa,  0.0%hi,  0.0%si,  0.5%st
Cpu6  :  0.8%us,  1.3%sy,  0.0%ni, 97.4%id,  0.0%wa,  0.0%hi,  0.0%si,  0.5%st
Cpu7  :  0.7%us,  1.2%sy,  0.0%ni, 97.4%id,  0.1%wa,  0.0%hi,  0.0%si,  0.5%st
Cpu8  :  0.7%us,  1.2%sy,  0.0%ni, 97.5%id,  0.1%wa,  0.0%hi,  0.0%si,  0.5%st
Cpu9  :  0.7%us,  1.2%sy,  0.0%ni, 97.5%id,  0.1%wa,  0.0%hi,  0.0%si,  0.5%st
Cpu10 :  0.6%us,  1.1%sy,  0.0%ni, 97.7%id,  0.0%wa,  0.0%hi,  0.0%si,  0.5%st
Cpu11 :  0.7%us,  1.1%sy,  0.0%ni, 97.6%id,  0.1%wa,  0.0%hi,  0.0%si,  0.5%st
Cpu12 :  0.6%us,  1.1%sy,  0.0%ni, 97.7%id,  0.0%wa,  0.0%hi,  0.0%si,  0.5%st
Cpu13 :  0.6%us,  1.1%sy,  0.0%ni, 97.6%id,  0.1%wa,  0.0%hi,  0.0%si,  0.5%st
Mem:   8372060k total,  6081764k used,  2290296k free,  1023892k buffers
Swap:  1048568k total,        0k used,  1048568k free,  2230472k cached

  PID USER      PR  NI  VIRT  RES  SHR S %CPU %MEM    TIME+  COMMAND
 1713 www-data  20   0  740m  21m  10m R   62  0.3   1:07.85 php-fpm
 3326 www-data  20   0  742m  34m  21m R   57  0.4   1:05.02 php-fpm
 4208 www-data  20   0  739m  16m 7400 R   55  0.2   0:57.85 php-fpm
 6065 tn        20   0  258m  49m 9084 R   54  0.6   0:53.65 drush.php
 7825 www-data  20   0  738m  12m 3972 R   46  0.2   0:00.29 php-fpm
 3449 www-data  20   0  739m  17m 7552 R   44  0.2   0:51.53 php-fpm
65185 www-data  20   0  755m  64m  37m R   43  0.8   1:56.78 php-fpm
 9852 aegir     20   0  236m  27m 8936 R   41  0.3   0:00.27 drush.php
 2989 www-data  20   0  744m  39m  24m R   40  0.5   1:09.97 php-fpm
 4207 www-data  20   0  741m  29m  17m R   40  0.4   1:06.60 php-fpm
 4073 www-data  20   0  744m  38m  24m R   38  0.5   1:03.83 php-fpm
65397 www-data  20   0  755m  63m  36m R   38  0.8   1:44.07 php-fpm
 4133 www-data  20   0  743m  35m  22m R   36  0.4   1:08.74 php-fpm
65284 www-data  20   0  745m  50m  33m R   36  0.6   1:58.90 php-fpm
 3517 www-data  20   0  743m  34m  21m R   35  0.4   1:06.83 php-fpm
 7172 www-data  20   0  738m  12m 4064 R   35  0.2   0:16.42 php-fpm
 9615 aegir     20   0  241m  32m 8936 R   30  0.4   0:40.06 drush.php
65252 www-data  20   0  745m  47m  31m R   30  0.6   1:47.14 php-fpm
 3375 www-data  20   0  743m  36m  23m R   27  0.5   1:03.95 php-fpm
28313 www-data  20   0  759m  79m  51m R   27  1.0   3:40.67 php-fpm
 7284 www-data  20   0  738m  12m 3928 R   25  0.2   0:00.16 php-fpm
 8714 www-data  20   0  736m  10m 3892 R   25  0.1   0:00.18 php-fpm
 5018 www-data  20   0  739m  16m 7400 R   24  0.2   0:53.26 php-fpm
  321 www-data  20   0 72336  10m 1836 R   17  0.1   0:02.74 nginx
 8350 www-data  20   0  736m  10m 3896 R   16  0.1   0:00.10 php-fpm
 9849 aegir     20   0  221m  15m 8460 R   14  0.2   0:00.11 drush.php
56567 root      20   0  734m 7316 2160 S   14  0.1   1:11.92 php-fpm
11744 mysql     20   0 2269m 1.3g  10m S    9 15.8  33:09.05 mysqld
28290 www-data  20   0  768m 105m  68m S    9  1.3   4:32.54 php-fpm
 9863 root      20   0 19200 1448  912 R    6  0.0   0:00.04 top
 9840 root      20   0 19340 1476  912 R    5  0.0   0:00.05 top
 9915 www-data  20   0  734m 5984  828 S    5  0.1   0:00.03 php-fpm
 9932 root      20   0 19200 1444  912 S    5  0.0   0:00.03 top
65200 www-data  20   0  747m  47m  29m S    5  0.6   1:42.20 php-fpm
   16 root      20   0     0    0    0 S    2  0.0   7:28.25 ksoftirqd/4
   55 root      20   0     0    0    0 S    2  0.0   0:19.35 events/10
 9608 root      20   0 10628 1368 1144 S    2  0.0   0:01.39 bash
 9846 root      20   0 10620 1356 1136 S    2  0.0   0:00.01 bash
 9871 root      20   0 10684 1428 1148 S    2  0.0   0:00.01 bash
10099 root      20   0     0    0    0 R    2  0.0   0:00.01 mysqladmin
30652 redis     20   0  191m  39m  920 S    2  0.5   4:07.71 redis-server
64822 root      20   0 10624 1372 1148 S    2  0.0   0:10.06 bash
65129 root      20   0 10624 1372 1148 S    2  0.0   0:07.69 bash
65232 www-data  20   0  745m  48m  32m R    2  0.6   1:01.58 php-fpm
65353 root      20   0 10624 1368 1148 S    2  0.0   0:01.99 bash
65488 www-data  20   0 72336  10m 1832 S    2  0.1   0:09.98 nginx
65535 www-data  20   0 72336  10m 1840 S    2  0.1   0:01.15 nginx
    1 root      20   0  8356  780  648 S    0  0.0   0:20.23 init
    2 root      20   0     0    0    0 S    0  0.0   0:00.02 kthreadd
This was a big enough spike to cause a gap in the Munin stats, and php-fpm and nginx were not started again till 6 mins later:
nginx high load off
ONEX_LOAD = 59
FIVX_LOAD = 1922
uptime :
 10:16:11 up 5 days, 43 min,  1 user,  load average: 0.59, 19.22, 21.52
top :
top - 10:16:12 up 5 days, 43 min,  1 user,  load average: 0.59, 19.22, 21.52
Tasks: 244 total,   1 running, 243 sleeping,   0 stopped,   0 zombie
Cpu0  :  2.4%us,  2.4%sy,  0.0%ni, 91.3%id,  3.2%wa,  0.0%hi,  0.1%si,  0.6%st
Cpu1  :  1.9%us,  2.4%sy,  0.0%ni, 94.8%id,  0.3%wa,  0.0%hi,  0.0%si,  0.5%st
Cpu2  :  1.9%us,  2.1%sy,  0.0%ni, 95.3%id,  0.2%wa,  0.0%hi,  0.0%si,  0.5%st
Cpu3  :  1.2%us,  1.7%sy,  0.0%ni, 96.4%id,  0.2%wa,  0.0%hi,  0.0%si,  0.5%st
Cpu4  :  1.1%us,  1.5%sy,  0.0%ni, 96.8%id,  0.1%wa,  0.0%hi,  0.0%si,  0.5%st
Cpu5  :  0.9%us,  1.4%sy,  0.0%ni, 97.2%id,  0.0%wa,  0.0%hi,  0.0%si,  0.5%st
Cpu6  :  0.8%us,  1.3%sy,  0.0%ni, 97.4%id,  0.0%wa,  0.0%hi,  0.0%si,  0.5%st
Cpu7  :  0.7%us,  1.2%sy,  0.0%ni, 97.4%id,  0.1%wa,  0.0%hi,  0.0%si,  0.5%st
Cpu8  :  0.7%us,  1.2%sy,  0.0%ni, 97.5%id,  0.1%wa,  0.0%hi,  0.0%si,  0.5%st
Cpu9  :  0.7%us,  1.2%sy,  0.0%ni, 97.5%id,  0.1%wa,  0.0%hi,  0.0%si,  0.5%st
Cpu10 :  0.6%us,  1.1%sy,  0.0%ni, 97.7%id,  0.0%wa,  0.0%hi,  0.0%si,  0.5%st
Cpu11 :  0.7%us,  1.1%sy,  0.0%ni, 97.6%id,  0.1%wa,  0.0%hi,  0.0%si,  0.5%st
Cpu12 :  0.6%us,  1.1%sy,  0.0%ni, 97.7%id,  0.0%wa,  0.0%hi,  0.0%si,  0.5%st
Cpu13 :  0.6%us,  1.1%sy,  0.0%ni, 97.6%id,  0.1%wa,  0.0%hi,  0.0%si,  0.5%st
Mem:   8372060k total,  5933896k used,  2438164k free,  1024032k buffers
Swap:  1048568k total,        0k used,  1048568k free,  2125704k cached

  PID USER      PR  NI  VIRT  RES  SHR S %CPU %MEM    TIME+  COMMAND
18971 root      20   0 19200 1364  912 R    6  0.0   0:00.05 top
    1 root      20   0  8356  780  648 S    0  0.0   0:20.24 init
    2 root      20   0     0    0    0 S    0  0.0   0:00.02 kthreadd
    3 root      RT   0     0    0    0 S    0  0.0   1:26.39 migration/0
I have looked through all the logs and can't find anything worth noting that hasn't already been noted on other ticket comments.
I have run the mysql tuning scripts again, these are the results:
perl mysqltuner.pl

 >>  MySQLTuner 1.2.0 - Major Hayden <major@mhtx.net>
 >>  Bug reports, feature requests, and downloads at http://mysqltuner.com/
 >>  Run with '--help' for additional options and output filtering
[OK] Logged in using credentials from debian maintenance account.

-------- General Statistics --------------------------------------------------
[--] Skipped version check for MySQLTuner script
[OK] Currently running supported MySQL version 5.5.31-MariaDB-1~squeeze-log
[OK] Operating on 64-bit architecture

-------- Storage Engine Statistics -------------------------------------------
[--] Status: +Archive -BDB +Federated +InnoDB -ISAM -NDBCluster
[--] Data in MyISAM tables: 104M (Tables: 2)
[--] Data in InnoDB tables: 449M (Tables: 1037)
[--] Data in PERFORMANCE_SCHEMA tables: 0B (Tables: 17)
[!!] Total fragmented tables: 96

-------- Security Recommendations  -------------------------------------------
[OK] All database users have passwords assigned

-------- Performance Metrics -------------------------------------------------
[--] Up for: 21h 53m 32s (4M q [59.066 qps], 129K conn, TX: 8B, RX: 760M)
[--] Reads / Writes: 81% / 19%
[--] Total buffers: 2.1G global + 18.4M per thread (100 max threads)
[OK] Maximum possible memory usage: 3.9G (48% of installed RAM)
[OK] Slow queries: 0% (34K/4M)
[!!] Highest connection usage: 100%  (101/100)
[OK] Key buffer size / total MyISAM indexes: 509.0M/94.5M
[OK] Key buffer hit rate: 99.8% (9M cached / 16K reads)
[OK] Query cache efficiency: 83.5% (3M cached / 4M selects)
[OK] Query cache prunes per day: 0
[OK] Sorts requiring temporary tables: 3% (2K temp sorts / 75K sorts)
[!!] Joins performed without indexes: 2320
[!!] Temporary tables created on disk: 27% (28K on disk / 105K total)
[OK] Thread cache hit rate: 99% (101 created / 129K connections)
[OK] Table cache hit rate: 22% (1K open / 8K opened)
[OK] Open file limit used: 0% (58/196K)
[OK] Table locks acquired immediately: 99% (1M immediate / 1M locks)
[OK] InnoDB data size / buffer pool: 449.1M/600.0M

-------- Recommendations -----------------------------------------------------
General recommendations:
    Run OPTIMIZE TABLE to defragment tables for better performance
    MySQL started within last 24 hours - recommendations may be inaccurate
    Reduce or eliminate persistent connections to reduce connection usage
    Adjust your join queries to always utilize indexes
    Temporary table size is already large - reduce result set size
    Reduce your SELECT DISTINCT queries without LIMIT clauses
Variables to adjust:
    max_connections (> 100)
    wait_timeout (< 3600)
    interactive_timeout (< 28800)
    join_buffer_size (> 6.0M, or always use indexes with joins)
bash tuning-primer.sh

        -- MYSQL PERFORMANCE TUNING PRIMER --
             - By: Matthew Montgomery -

MySQL Version 5.5.31-MariaDB-1~squeeze-log x86_64

Uptime = 0 days 21 hrs 35 min 21 sec
Avg. qps = 58
Total Questions = 4559816
Threads Connected = 2

Warning: Server has not been running for at least 48hrs.
It may not be safe to use these recommendations

To find out more information on how each of these
runtime variables effects performance visit:
http://dev.mysql.com/doc/refman/5.5/en/server-system-variables.html
Visit http://www.mysql.com/products/enterprise/advisors.html
for info about MySQL's Enterprise Monitoring and Advisory Service

SLOW QUERIES
The slow query log is enabled.
Current long_query_time = 5.000000 sec.
You have 33837 out of 4559870 that take longer than 5.000000 sec. to complete
Your long_query_time seems to be fine

BINARY UPDATE LOG
The binary update log is NOT enabled.
You will not be able to do point in time recovery
See http://dev.mysql.com/doc/refman/5.5/en/point-in-time-recovery.html

WORKER THREADS
Current thread_cache_size = 128
Current threads_cached = 95
Current threads_per_sec = 0
Historic threads_per_sec = 0
Your thread_cache_size is fine

MAX CONNECTIONS
Current max_connections = 100
Current threads_connected = 6
Historic max_used_connections = 101
The number of used connections is 101% of the configured maximum.
You should raise max_connections

INNODB STATUS
Current InnoDB index space = 178 M
Current InnoDB data space = 449 M
Current InnoDB buffer pool free = 3 %
Current innodb_buffer_pool_size = 600 M
Depending on how much space your innodb indexes take up it may be safe
to increase this value to up to 2 / 3 of total system memory

MEMORY USAGE
Max Memory Ever Allocated : 3.40 G
Configured Max Per-thread Buffers : 1.79 G
Configured Max Global Buffers : 1.59 G
Configured Max Memory Limit : 3.38 G
Physical Memory : 7.98 G
Max memory limit seem to be within acceptable norms

KEY BUFFER
Current MyISAM index space = 94 M
Current key_buffer_size = 509 M
Key cache miss rate is 1 : 589
Key buffer free ratio = 78 %
Your key_buffer_size seems to be fine

QUERY CACHE
Query cache is enabled
Current query_cache_size = 512 M
Current query_cache_used = 109 M
Current query_cache_limit = 256 K
Current Query cache Memory fill ratio = 21.34 %
Current query_cache_min_res_unit = 4 K
Query Cache is 30 % fragmented
Run "FLUSH QUERY CACHE" periodically to defragment the query cache memory
If you have many small queries lower 'query_cache_min_res_unit' to reduce fragmentation.
Your query_cache_size seems to be too high.
Perhaps you can use these resources elsewhere
MySQL won't cache query results that are larger than query_cache_limit in size

SORT OPERATIONS
Current sort_buffer_size = 128 K
Current read_rnd_buffer_size = 4 M
Sort buffer seems to be fine

JOINS
tuning-primer.sh: line 402: export: `2097152': not a valid identifier
Current join_buffer_size = 6.00 M
You have had 2305 queries where a join could not use an index properly
join_buffer_size >= 4 M
This is not advised
You should enable "log-queries-not-using-indexes"
Then look for non indexed joins in the slow query log.

OPEN FILES LIMIT
Current open_files_limit = 196608 files
The open_files_limit should typically be set to at least 2x-3x
that of table_cache if you have heavy MyISAM usage.
Your open_files_limit value seems to be fine

TABLE CACHE
Current table_open_cache = 2048 tables
Current table_definition_cache = 512 tables
You have a total of 1080 tables
You have 1974 open tables.
Current table_cache hit rate is 25%
, while 96% of your table cache is in use
You should probably increase your table_cache
You should probably increase your table_definition_cache value.

TEMP TABLES
Current max_heap_table_size = 1.00 G
Current tmp_table_size = 512 M
Of 74733 temp tables, 27% were created on disk
Perhaps you should increase your tmp_table_size and/or max_heap_table_size
to reduce the number of disk-based temporary tables
Note! BLOB and TEXT columns are not allow in memory tables.
If you are using these columns raising these values might not impact your
ratio of on disk temp tables.

TABLE SCANS
Current read_buffer_size = 8 M
Current table scan ratio = 92 : 1
read_buffer_size seems to be fine

TABLE LOCKING
Current Lock Wait ratio = 1 : 1025630
Your table locking seems to be fine
These values in /etc/mysql/my.cnf have been changed:
max_connections         = 120
max_user_connections    = 120

#table_definition_cache  = 512
table_definition_cache  = 2048

#sort_buffer_size        = 128K
sort_buffer_size        = 512K
#bulk_insert_buffer_size = 128K
bulk_insert_buffer_size = 256K

table_cache             = 4096

#table_open_cache        = 64
table_open_cache        = 2048

#wait_timeout            = 3600
wait_timeout            = 300

max_heap_table_size     = 2048M

tmp_table_size          = 1024M

join_buffer_size        = 8M
And I have restarted MySQL.
Jim, it might be worth looking at the slow query log, these suggestions / notes have been made, I don't know how valid they are:
- Sorts requiring temporary tables: 1% (63 temp sorts / 5K sorts)
- Of 5858 temp tables, 26% were created on disk
- Reduce your SELECT DISTINCT queries without LIMIT clauses
- Adjust your join queries to always utilize indexes
- You have had 81 queries where a join could not use an index properly -- look for non indexed joins in the slow query log.
comment:66 Changed 3 years ago by chris
- Add Hours to Ticket changed from 0.0 to 0.25
- Total Hours changed from 25.18 to 25.43
I have made these additional changes to the my.cnf file:
#key_buffer_size         = 509M
key_buffer_size         = 256M

join_buffer_size        = 32M
And restarted mysql.
comment:67 Changed 3 years ago by chris
- Add Hours to Ticket changed from 0.0 to 0.25
- Total Hours changed from 25.43 to 25.68
Reading this, https://dev.mysql.com/doc/refman/5.1/en/query-cache-configuration.html and looking at these values:
MariaDB [mysql]> SHOW GLOBAL STATUS;
...
| Qcache_free_blocks                       | 31783       |
| Qcache_free_memory                       | 420047440   |
| Qcache_hits                              | 1510058     |
| Qcache_inserts                           | 532864      |
| Qcache_lowmem_prunes                     | 0           |
| Qcache_not_cached                        | 99024       |
| Qcache_queries_in_cache                  | 77218       |
| Qcache_total_blocks                      | 187187      |
| Queries                                  | 2468635     |
...
I have adjusted these variables:
query_cache_limit       = 1M

query_cache_min_res_unit = 2K
And restarted mysql.
comment:68 in reply to: ↑ 59 Changed 3 years ago by chris
- Add Hours to Ticket changed from 0.0 to 0.5
- Total Hours changed from 25.68 to 26.18
Replying to jim:
Chris, check out the variables in .barracuda.cnf as they allow seeing
custom php.ini, my.cnf & others. No need to script most stuff.
Thanks Jim, I have changed these variables in /root/.barracuda.cnf :
_LOAD_LIMIT_ONE=1444
_LOAD_LIMIT_TWO=888

_CUSTOM_CONFIG_SQL=NO

_CUSTOM_CONFIG_PHP_5_3=NO
So they now read:
_LOAD_LIMIT_ONE==7220
_LOAD_LIMIT_TWO=4440

_CUSTOM_CONFIG_SQL=YES

_CUSTOM_CONFIG_PHP_5_3=YES
The question is around second.sh - ideally we'd supply a patch that allows
tuning of scripts in /var/xdrago to our needs.
Do you know if the values for _LOAD_LIMIT_ONE and _LOAD_LIMIT_TWO in /root/.barracuda.cnf are calculated somewhere or are they simply set at standard reasonable defaults?
Re-running the mysql tuning scripts:
 >>  MySQLTuner 1.2.0 - Major Hayden <major@mhtx.net>
 >>  Bug reports, feature requests, and downloads at http://mysqltuner.com/
 >>  Run with '--help' for additional options and output filtering
[OK] Logged in using credentials from debian maintenance account.

-------- General Statistics --------------------------------------------------
[--] Skipped version check for MySQLTuner script
[OK] Currently running supported MySQL version 5.5.31-MariaDB-1~squeeze-log
[OK] Operating on 64-bit architecture

-------- Storage Engine Statistics -------------------------------------------
[--] Status: +Archive -BDB +Federated +InnoDB -ISAM -NDBCluster
[--] Data in MyISAM tables: 105M (Tables: 2)
[--] Data in InnoDB tables: 453M (Tables: 1039)
[--] Data in PERFORMANCE_SCHEMA tables: 0B (Tables: 17)
[!!] Total fragmented tables: 101

-------- Security Recommendations  -------------------------------------------
[OK] All database users have passwords assigned

-------- Performance Metrics -------------------------------------------------
[--] Up for: 2d 15h 51m 55s (14M q [61.416 qps], 391K conn, TX: 27B, RX: 2B)
[--] Reads / Writes: 84% / 16%
[--] Total buffers: 2.3G global + 44.8M per thread (120 max threads)
[!!] Maximum possible memory usage: 7.6G (95% of installed RAM)
[OK] Slow queries: 0% (105K/14M)
[!!] Highest connection usage: 100%  (121/120)
[OK] Key buffer size / total MyISAM indexes: 256.0M/96.6M
[OK] Key buffer hit rate: 99.9% (28M cached / 24K reads)
[OK] Query cache efficiency: 81.0% (10M cached / 12M selects)
[OK] Query cache prunes per day: 0
[OK] Sorts requiring temporary tables: 1% (2K temp sorts / 259K sorts)
[!!] Joins performed without indexes: 8000
[OK] Temporary tables created on disk: 25% (100K on disk / 393K total)
[OK] Thread cache hit rate: 99% (121 created / 391K connections)
[!!] Table cache hit rate: 16% (2K open / 12K opened)
[OK] Open file limit used: 0% (80/196K)
[OK] Table locks acquired immediately: 99% (3M immediate / 3M locks)
[OK] InnoDB data size / buffer pool: 453.4M/600.0M

-------- Recommendations -----------------------------------------------------
General recommendations:
    Run OPTIMIZE TABLE to defragment tables for better performance
    Reduce your overall MySQL memory footprint for system stability
    Reduce or eliminate persistent connections to reduce connection usage
    Adjust your join queries to always utilize indexes
    Increase table_cache gradually to avoid file descriptor limits
Variables to adjust:
  *** MySQL's maximum memory usage is dangerously high ***
  *** Add RAM before increasing MySQL buffer variables ***
    max_connections (> 120)
    wait_timeout (< 300)
    interactive_timeout (< 28800)
    join_buffer_size (> 32.0M, or always use indexes with joins)
    table_cache (> 4096)
        -- MYSQL PERFORMANCE TUNING PRIMER --
             - By: Matthew Montgomery -

MySQL Version 5.5.31-MariaDB-1~squeeze-log x86_64

Uptime = 2 days 15 hrs 52 min 41 sec
Avg. qps = 61
Total Questions = 14124710
Threads Connected = 3

Server has been running for over 48hrs.
It should be safe to follow these recommendations

To find out more information on how each of these
runtime variables effects performance visit:
http://dev.mysql.com/doc/refman/5.5/en/server-system-variables.html
Visit http://www.mysql.com/products/enterprise/advisors.html
for info about MySQL's Enterprise Monitoring and Advisory Service

SLOW QUERIES
The slow query log is enabled.
Current long_query_time = 5.000000 sec.
You have 105118 out of 14124819 that take longer than 5.000000 sec. to complete
Your long_query_time seems to be fine

BINARY UPDATE LOG
The binary update log is NOT enabled.
You will not be able to do point in time recovery
See http://dev.mysql.com/doc/refman/5.5/en/point-in-time-recovery.html

WORKER THREADS
Current thread_cache_size = 128
Current threads_cached = 118
Current threads_per_sec = 0
Historic threads_per_sec = 0
Your thread_cache_size is fine

MAX CONNECTIONS
Current max_connections = 120
Current threads_connected = 2
Historic max_used_connections = 121
The number of used connections is 100% of the configured maximum.
You should raise max_connections

INNODB STATUS
Current InnoDB index space = 179 M
Current InnoDB data space = 453 M
Current InnoDB buffer pool free = 1 %
Current innodb_buffer_pool_size = 600 M
Depending on how much space your innodb indexes take up it may be safe
to increase this value to up to 2 / 3 of total system memory

MEMORY USAGE
Max Memory Ever Allocated : 6.63 G
Configured Max Per-thread Buffers : 5.24 G
Configured Max Global Buffers : 1.34 G
Configured Max Memory Limit : 6.59 G
Physical Memory : 7.98 G
Max memory limit seem to be within acceptable norms

KEY BUFFER
Current MyISAM index space = 96 M
Current key_buffer_size = 256 M
Key cache miss rate is 1 : 1148
Key buffer free ratio = 71 %
Your key_buffer_size seems to be fine

QUERY CACHE
Query cache is enabled
Current query_cache_size = 512 M
Current query_cache_used = 287 M
Current query_cache_limit = 1 M
Current Query cache Memory fill ratio = 56.07 %
Current query_cache_min_res_unit = 2 K
MySQL won't cache query results that are larger than query_cache_limit in size

SORT OPERATIONS
Current sort_buffer_size = 512 K
Current read_rnd_buffer_size = 4 M
Sort buffer seems to be fine

JOINS
tuning-primer.sh: line 402: export: `2097152': not a valid identifier
Current join_buffer_size = 32.00 M
You have had 8004 queries where a join could not use an index properly
join_buffer_size >= 4 M
This is not advised
You should enable "log-queries-not-using-indexes"
Then look for non indexed joins in the slow query log.

OPEN FILES LIMIT
Current open_files_limit = 196608 files
The open_files_limit should typically be set to at least 2x-3x
that of table_cache if you have heavy MyISAM usage.
Your open_files_limit value seems to be fine

TABLE CACHE
Current table_open_cache = 4096 tables
Current table_definition_cache = 2048 tables
You have a total of 1082 tables
You have 2089 open tables.
The table_cache value seems to be fine

TEMP TABLES
Current max_heap_table_size = 2.00 G
Current tmp_table_size = 1.00 G
Of 292953 temp tables, 25% were created on disk
Perhaps you should increase your tmp_table_size and/or max_heap_table_size
to reduce the number of disk-based temporary tables
Note! BLOB and TEXT columns are not allow in memory tables.
If you are using these columns raising these values might not impact your
ratio of on disk temp tables.

TABLE SCANS
Current read_buffer_size = 8 M
Current table scan ratio = 96 : 1
read_buffer_size seems to be fine

TABLE LOCKING
Current Lock Wait ratio = 1 : 1239726
Your table locking seems to be fine
These variables in /etc/mysql/my.cnf have been changed:
wait_timeout            = 120

max_connections         = 150
max_user_connections    = 150

query_cache_limit       = 2M
query_cache_min_res_unit = 1K

table_open_cache        = 6144
table_definition_cache  = 6144
table_cache             = 8192

tmp_table_size          = 1024M
max_heap_table_size     = 2048M
max_tmp_tables          = 32768

innodb_buffer_pool_size = 1024M
comment:69 Changed 3 years ago by chris
- Add Hours to Ticket changed from 0.0 to 1.0
- Total Hours changed from 26.18 to 27.18
I have done some work on the awstats config and detailed data is being written to the data file, /var/lib/awstats/awstats062013.www.transitionnetwork.org.txt on penguin but the resulting graph doesn't contain this data, only the total number of hits, https://penguin.transitionnetwork.org/awstats/www.transitionnetwork.org/stats-2013-06/awstats.www.transitionnetwork.org.html
I can't see what I'm doing wrong, I'll revisit this tomorrow.
comment:70 Changed 3 years ago by chris
- Add Hours to Ticket changed from 0.0 to 1.0
- Total Hours changed from 27.18 to 28.18
I have installed Munin nginx_vhost_traffic plugin on puffin from http://www.mygento.net/blog/munin_nginx_vhost_traffic_plugin/
cd /usr/share/munin/plugins
wget http://www.mygento.net/media/nginx_vhost_traffic
chmod 755 nginx_vhost_traffic
cd /etc/munin/plugins/
ln -s /usr/share/munin/plugins/nginx_vhost_traffic
The /etc/munin/plugin-conf.d/munin-node was edited and this section was added:
[nginx_vhost_traffic]
group adm
env.vhosts puffin.webarch.net www.transitionnetwork.org space.transitionnetwork.org cgp.master.puffin.webarch.net newlive.puffin.webarch.net
env.logdir /var/log/nginx
env.logfile access.log
env.aggregate false
And munin-node was restarted.
I'm not sure how useful this will be, or even if it works properly, stats will be generated here https://penguin.transitionnetwork.org/munin/transitionnetwork.org/puffin.transitionnetwork.org/nginx_vhost_traffic.html
I have spent some more time trying to get awstats generate some graphs from the nginx logs but I haven't had any luck with that so I'm going to switch to using Piwik, see http://piwik.org/log-analytics/how-to/
comment:71 Changed 3 years ago by chris
- Add Hours to Ticket changed from 0.0 to 2.0
- Total Hours changed from 28.18 to 30.18
To import the puffin nginx logs this was tried:
python /web/stats.transitionnetwork.org/piwik/misc/log-analytics/import_logs.py --url=https://stats.transitionnetwork.org/ \
       --dry-run --show-progress \
       --idsite=12 --enable-static --enable-bots --enable-http-errors --enable-http-redirect \
       --log-format-regex='"(?P<ip>\S+)" (?P<host>\S+) \[(?P<date>.*?) (?P<timezone>.*?)\] (?P<status>\S+) (?P<length>\S+) \S+ \S+ "(?P<referrer>.*?)" "(?P<user_agent>.*?)" \S+ "\S+"' \
       --recorders=8 \
       /home/puffin/nginx/puffin-nginx-2013-06-22.log
But this resulted in logs of lines being missed:
    34220 requests imported successfully
    3258 requests were downloads
    9157 requests ignored:
        9157 invalid log lines
This is due to Nginx recording HTTPS requests with the IP and proxy IP, eg this Google bot request:
"66.249.75.112, 127.0.0.1"
So the logs need to be run through sed first:
cat puffin-nginx-2013-06-22.log | sed 's/, 127.0.0.1//' > puffin-nginx-2013-06-22.log.fixed
cat puffin-nginx-2013-06-23.log | sed 's/, 127.0.0.1//' > puffin-nginx-2013-06-23.log.fixed
cat puffin-nginx-2013-06-24.log | sed 's/, 127.0.0.1//' > puffin-nginx-2013-06-24.log.fixed
cat puffin-nginx-2013-06-25.log | sed 's/, 127.0.0.1//' > puffin-nginx-2013-06-25.log.fixed
cat puffin-nginx-2013-06-26.log | sed 's/, 127.0.0.1//' > puffin-nginx-2013-06-26.log.fixed
cat puffin-nginx-2013-06-27.log | sed 's/, 127.0.0.1//' > puffin-nginx-2013-06-27.log.fixed
cat puffin-nginx-2013-06-28.log | sed 's/, 127.0.0.1//' > puffin-nginx-2013-06-28.log.fixed
cat puffin-nginx-2013-06-29.log | sed 's/, 127.0.0.1//' > puffin-nginx-2013-06-29.log.fixed
cat puffin-nginx-2013-06-30.log | sed 's/, 127.0.0.1//' > puffin-nginx-2013-06-30.log.fixed
cat puffin-nginx-2013-07-01.log | sed 's/, 127.0.0.1//' > puffin-nginx-2013-07-01.log.fixed
cat puffin-nginx-2013-07-02.log | sed 's/, 127.0.0.1//' > puffin-nginx-2013-07-02.log.fixed
After the dry-run was tested the data was actually imported and a script was written to run via cron, see wiki:PiwikImportScript
Looking at these stats we are getting between 5.5k and 7.5k visitors a day, around 1.2k of these are bots, stats are not generated for the total bandwidth etc, parsing these logs does mean we need to check the privacy policy.
comment:72 Changed 3 years ago by chris
- Add Hours to Ticket changed from 0.0 to 0.5
- Total Hours changed from 30.18 to 30.68
To recap on where we are at with the log analysis:
- AWStats - haven't managed to get this working with the default BOA Nginx log format, it still looks like the best bet for getting stats about total hits, total bandwidth and bots.
- Piwik - I did import several days worth of Nginx logs into Piwik but althouigh is does illustrate how the regular Piwik stats only report a fraction of the traffic it's not that useful as Piwik is designed for reporting on human interactions, not bots.
This is how I suggest I proceed:
- Disable the importing of logs into Piwik -- the data that it produces isn't that great.
- Set up Nginx to write an additional access log in a format that works with AWStats and sort out the remaining issues here wiki:AwStatsInstall
I have installed logstalgia on my local machine, tailing the access log via ssh, see https://code.google.com/p/logstalgia/ this might be good if we wanted to produce a video of the traffic or something... but it's not as exciting the the videos here https://www.youtube.com/user/Logstalgia but this might be because images, css and javascript don't appear to be logged, not sure why.
comment:73 Changed 3 years ago by chris
- Add Hours to Ticket changed from 0.0 to 1.0
- Total Hours changed from 30.68 to 31.68
I really don't understand why I can't get AWStats working, it doesn't generate a data file and the generated graphs are blank.
I have had more luck with http://www.webalizer.org/ and that looks like the best option. I'll finish setting it up tomorrow and document it.
comment:74 Changed 3 years ago by chris
- Add Hours to Ticket changed from 0.0 to 0.9
- Total Hours changed from 31.68 to 32.58
This comment is to record the time spend in a email to the ttech list about the ongoing load spike issues.
comment:75 Changed 3 years ago by chris
I have created a new wiki page to document what tools we have for analysing web server logs, wiki:WebServerLogs this isn't yet complete and there are some oddities with the Webarizer stats and also the goaccess stats which makes me think the log format isn't exactly right, I'll try and resolve this tomorrow and finish documenting how to get a handle on what the web servers are doing.
These tools are only available to people with ssh and sudo, Jim should give them a try when he has a few spare mins:
These stats will be available for everyone with a password when I have them sorted:
comment:76 Changed 3 years ago by chris
- Add Hours to Ticket changed from 0.0 to 1.0
- Total Hours changed from 32.58 to 33.58
Oops I forgot to add the time to that last comment.
comment:77 Changed 3 years ago by chris
- Add Hours to Ticket changed from 0.0 to 1.0
- Total Hours changed from 33.58 to 34.58
Goaccess on Debian Squeeze is version 0.12-1 and this doesn't have features of the newer version in Debian Wheezy, like the ability to generate HTML reports and the ability to specify the log file format in a ~/.goaccessrc file.
I suggest that when we upgrade to Wheezy, see ticket:535 we set up Goaccess to generate a HTML report per day.
I have documented Webalizer, wiki:WebServerLogs#webalizer and sent a password to the ttech list.
Looking at the last few days of Webalizer stats the busiest was yesterday (11th July 2013):
- 7,558 visits (this will be not exact due to Nginx reverse proxying HTTPS connections)
- 59,295 pages
- 65,338 hits
- 1.7GB of files
Contrast to Piwik stats:
- 1,131 visits
- 2,813 page views
I think this difference is mostly due to the bots.
comment:78 Changed 3 years ago by chris
- Add Hours to Ticket changed from 0.0 to 0.25
- Total Hours changed from 34.58 to 34.83
The following might, of might not be related to the issues we have been having, I'd love to know that the kernel issue that causes "random load spikes" is. Looking at the stats for the server that puffin is hosted on I don't think we have a "noisy neighbors" issue.
High load average alerts
Thread on BOA forum, in relation to a far lower spec virtual server, https://groups.drupal.org/node/306518
The advice from omega8cc is:
I would strongly suggest to ask Linode to move your VPS to some other
machine. We have seen this too many times - people wasting hours and days
trying to figure out what the problem could be, only to see it magically
fixed once moved away from noisy neighbors. Note that one migration may be
not enough if you are migrated to another machine with another set of noisy
neighbors.
Only if this will not help, continue with debugging - but since the load
seems to be related to some cron tasks, it is almost for sure disk I/O and/or
CPU power shortage - a typical sign of being hosted on a critically
overloaded machine.
There were no changes on the BOA side which could cause issues like this.
Linux Kernel Upgrade
A notification regarding BOA hosted servers, http://omega8.cc/emergency-linux-kernel-upgrade-nyc-1-274
Omega8.cc has announced the following emergency maintenance:
Start Date: Tuesday, July 9th, 2013 05:30 AM (EDT) End Date: Tuesday, July
9th, 2013 06:30 AM (EDT)
Locations: NYC 1 (New York, US)
During this maintenance window, Omega8.cc engineers will be performing
emergency reboot on all machines affected by random load spikes after recent
Linux kernel security upgrade. Expected downtime depends on the possible
hardware reconfiguration on some machines and may take 5 to 15 minutes on an
average.
comment:79 Changed 3 years ago by chris
- Add Hours to Ticket changed from 0.0 to 2.0
- Total Hours changed from 34.83 to 36.83
When looking at the Puffin Nginx access log via wiki:WebServerLogs#logstalgia it's clear that most the hits are not logged -- there are no records of css, images or js files being served to clients, but, based on the figures from http://tools.pingdom.com/fpt/ the front page has:
- Image 31
- Other 3
- CSS 3
So, tracing all the Nginx config files, starting from /etc/nginx/nginx.conf these files were checked by following the includes, these files were checked:
- /etc/nginx/mime.types
- /etc/nginx/conf.d/*.conf
- /etc/nginx/conf.d/aegir.conf
- /var/aegir/config/server_master/nginx/pre.d/*
- /var/aegir/config/server_master/nginx/pre.d/nginx_speed_purge.conf
- /var/aegir/config/server_master/nginx/pre.d/nginx_wild_ssl.conf
- /var/aegir/config/server_master/nginx/platform.d/*
- /data/disk/tn/config/server_master/nginx/vhost.d/*
- /data/disk/tn/config/server_master/nginx/vhost.d/news.transitionnetwork.org
- /data/disk/tn/config/includes/fastcgi_params.conf
- /data/disk/tn/config/includes/nginx_octopus_include.conf
- /data/disk/tn/config/server_master/nginx/vhost.d/space.transitionnetwork.org
- /data/disk/tn/config/includes/fastcgi_params.conf
- /data/disk/tn/config/includes/nginx_modern_include.conf
- /data/disk/tn/config/server_master/nginx/vhost.d/stg.transitionnetwork.org
- /data/disk/tn/config/includes/fastcgi_params.conf
- /data/disk/tn/config/includes/nginx_octopus_include.conf
- /data/disk/tn/config/server_master/nginx/vhost.d/tn.puffin.webarch.net
- /data/disk/tn/config/includes/fastcgi_params.conf
- /data/disk/tn/config/includes/nginx_modern_include.conf
- /data/disk/tn/config/server_master/nginx/vhost.d/www.transitionnetwork.org
- /data/disk/tn/config/includes/fastcgi_params.conf
- /data/disk/tn/config/includes/nginx_octopus_include.conf
- /data/conf/nginx_high_load.c*
- /data/disk/tn/config/server_master/nginx/post.d/nginx_force_include*
- /data/disk/tn/config/server_master/nginx/post.d/nginx_vhost_include*
- /data/disk/tn/config/server_master/nginx/vhost.d/news.transitionnetwork.org
- /data/disk/tn/config/server_master/nginx/vhost.d/*
- /var/aegir/config/server_master/nginx/vhost.d/*
- /var/aegir/config/server_master/nginx/vhost.d/cgp.master.puffin.webarch.net
- /var/aegir/config/server_master/nginx/vhost.d/chive.master.puffin.webarch.net
- /var/aegir/config/server_master/nginx/vhost.d/master.puffin.webarch.net
- /var/aegir/config/server_master/nginx/post.d/*
- /etc/nginx/sites-enabled/*
And the following resources have access logs disabled, in /etc/nginx/conf.d/aegir.conf, data for Munin stats:
## chris
  location /nginx_status {
    access_log   off;
  }
  location ~ ^/(status|ping)$ {
    access_log off;
  }
Requests for purging the speed cache in /var/aegir/config/server_master/nginx/pre.d/nginx_speed_purge.conf:
  location ~ /purge-([a-z\-]*)(/.*) {
    fastcgi_cache_purge speed $1$host$request_method$2;
    log_not_found off;
  }
The HTTPS reverse proxy, in /var/aegir/config/server_master/nginx/pre.d/nginx_wild_ssl.conf:
  location / {
    access_log                 off;
    log_not_found              off;
  }
This is where Nginx is set to not log images, css, etc etc, in /data/disk/tn/config/includes/nginx_octopus_include.conf:
location ^~ /cdn/farfuture/ {
  access_log    off;
  log_not_found off;
  }

location = /favicon.ico {
  access_log    off;
  log_not_found off;
  }

location = /robots.txt {
  access_log    off;
  log_not_found off;
  }

location = /cron.php {
  access_log   off;
  }

location = /core/cron.php {
  access_log   off;
  }

location ~ (?<upload_form_uri>.*)/x-progress-id:(?<upload_id>\w*) {
  access_log off;
}

location ^~ /progress {
  access_log off;
}

location ^~ /hosting/c/server_master {
  access_log off;
}

location ^~ /hosting/c/server_localhost {
  access_log off;
}

location ^~ /hosting {
  access_log off;
}

location ^~ /admin/settings/performance/cache-backend {
  access_log off;
}

location ^~ /admin {
  access_log off;
}

location ^~ /audio/download {
  location ~* ^/audio/download/.*/.*\.(?:mp3|mp4|m4a|ogg)$ {
    access_log off;
  }
}

location ~* (?:cgi-bin|vti-bin) {
  access_log off;
}

location ~* \.r\.(?:jpe?g|png|gif) {
  access_log off;
}

location ~* /(?:.+)/files/styles/adaptive/(?:.+)$ {
  access_log off;
}

location ~* /(?:external|system|files/imagecache|files/styles)/ {
  access_log off;
}

location ~* ^/sites/.*/files/backup_migrate/ {
  access_log off;
}

location ~* ^/sites/.*/files/config_.* {
  access_log off;
}

location ~* ^/sites/.*/files/private/ {

  access_log off;
}

location ~* ^/sites/.*/private/ {
  access_log off;
}

location ~* wysiwyg_fields/(?:plugins|scripts)/.*\.(?:js|css) {
  access_log off;
  log_not_found off;
}

location ~* files/advagg_(?:css|js)/ {
  access_log off;
}

location ~* \.css$ {
  access_log  off;
}

location ~* \.(?:js|htc)$ {
  access_log  off;
}

location ~* \.json$ {
  access_log  off;
}

location @uncached {
  access_log off;
}

location ~* ^.+\.(?:jpe?g|gif|png|ico|bmp|svg|swf|pdf|docx?|xlsx?|pptx?|tiff?|txt|rtf|cgi|bat|pl|dll|aspx?|class|otf|ttf|woff|eot|less)$ {
  access_log    off;
  log_not_found off;
}

location ~* /(?:cross-?domain)\.xml$ {
  access_log  off;
}

location ~* /(?:modules|libraries)/(?:contrib/)?(?:ad|tinybrowser|f?ckeditor|tinymce|wysiwyg_spellcheck|ecc|civicrm|fbconnect|radioactivity)/.*\.php$ {
  access_log   off;
}

location ~* ^/sites/.*/(?:modules|libraries)/(?:contrib/)?(?:tinybrowser|f?ckeditor|tinymce)/.*\.(?:html?|xml)$ {
  access_log      off;
}

location ~* ^/sites/.*/files/ {
  access_log      off;
}

location ~* \.xml$ {
  access_log off;
}

location ~* ^/(?:.*/)?(?:admin|user|cart|checkout|logout|flag|comment/reply) {
  access_log off;
}

location ~* ^/(?:core/)?(?:boost_stats|update|authorize|rtoc|xmlrpc|js)\.php$ {
  access_log   off;
}
I have tried enabling the access log for everything in /data/disk/tn/config/includes/nginx_octopus_include.conf as an experiment to see how much the Nginx logs then diverge from the Piwik stats. I have run this command on that file using vim and restarted Nginx:
cp /data/disk/tn/config/includes/nginx_octopus_include.conf /root/
vim /data/disk/tn/config/includes/nginx_octopus_include.conf
  :1,$s/access_log\s\+off/access_log on/c
  40 substitutions on 40 lines
/etc/init.d/nginx restart
However we still don't have a record of images, css and js in the log files... and I don't understand why, but it's now very clear that the wiki:WebServerLogs totally under record the actual traffic / hits.
Looking at the Xen bandwidth stats:
 puffin  /  monthly

       month        rx      |     tx      |    total    |   avg. rate
    ------------------------+-------------+-------------+---------------
      Nov '12         0 KiB |       0 KiB |       0 KiB |    0.00 kbit/s
      Dec '12         0 KiB |       0 KiB |       0 KiB |    0.00 kbit/s
      Mar '13     32.26 GiB |    4.20 GiB |   36.46 GiB |  114.19 kbit/s
      Apr '13     68.61 GiB |   14.06 GiB |   82.66 GiB |  267.52 kbit/s
      May '13     65.49 GiB |   22.61 GiB |   88.10 GiB |  275.92 kbit/s
      Jun '13     68.12 GiB |   16.18 GiB |   84.31 GiB |  272.85 kbit/s
      Jul '13     44.54 GiB |   10.87 GiB |   55.41 GiB |  369.55 kbit/s
    ------------------------+-------------+-------------+---------------
    estimated     94.85 GiB |   23.15 GiB |  117.99 GiB |
These are in https://en.wikipedia.org/wiki/GiB (1GiB ≈ 1.074GB) and also in and out are clearly reversed, so we have these stats for data served to clients for these whole months:
- Apr '13 68.61 GiB | 73.69 GB | 2.5 GB / day
- May '13 65.49 GiB | 70.34 GB | 2.3 GB / day
- Jun '13 68.12 GiB | 73.16 GB | 2.4 GB / day
And for the first half of July:
- Jul '13 44.54 GiB | 47.84 GB | 3.2 GB / day
And compared with the starts from Webalizer we have:
- 10th July | 1219928 kB | 1.16 GB
- 11th July | 1740502 kB | 1.66 GB
- 12th July | 1364893 kB | 1.30 GB
- 13th July | 1498118 kB | 1.43 GB
- 14th July | 1645123 kB | 1.57 GB
So it's clear that the Webalizer recorded traffic is roughly about 1/2 the actual traffic (however these stats do include data transfered by ssh -- backups will be included in the Xen stats).
Incidental I noticed puffin had the standard limit of 1024 open files so I multiplied this by 4:
ulimit -n
  1024
ulimit -n 4096
ulimit -n
  4096
comment:80 Changed 3 years ago by chris
Adding in the other server and we served 0.1TB of data to clients in July 2013:
 puffin  /  monthly

       month        rx      |     tx      |    total    |   avg. rate
    ------------------------+-------------+-------------+---------------
      Nov '12         0 KiB |       0 KiB |       0 KiB |    0.00 kbit/s
      Dec '12         0 KiB |       0 KiB |       0 KiB |    0.00 kbit/s
      Mar '13     32.26 GiB |    4.20 GiB |   36.46 GiB |  114.19 kbit/s
      Apr '13     68.61 GiB |   14.06 GiB |   82.66 GiB |  267.52 kbit/s
      May '13     65.49 GiB |   22.61 GiB |   88.10 GiB |  275.92 kbit/s
      Jun '13     68.12 GiB |   16.18 GiB |   84.31 GiB |  272.85 kbit/s
      Jul '13     44.57 GiB |   10.87 GiB |   55.44 GiB |  369.57 kbit/s
    ------------------------+-------------+-------------+---------------
    estimated     94.86 GiB |   23.14 GiB |  118.00 GiB |
 penguin  /  monthly

       month        rx      |     tx      |    total    |   avg. rate
    ------------------------+-------------+-------------+---------------
      Dec '12         0 KiB |       0 KiB |       0 KiB |    0.00 kbit/s
      Mar '13      3.61 GiB |  971.74 MiB |    4.56 GiB |   14.27 kbit/s
      Apr '13      8.56 GiB |    1.84 GiB |   10.40 GiB |   33.65 kbit/s
      May '13      7.28 GiB |    2.51 GiB |    9.79 GiB |   30.67 kbit/s
      Jun '13     10.14 GiB |    3.06 GiB |   13.20 GiB |   42.71 kbit/s
      Jul '13      5.82 GiB |    2.03 GiB |    7.85 GiB |   52.20 kbit/s
    ------------------------+-------------+-------------+---------------
    estimated     12.36 GiB |    4.30 GiB |   16.67 GiB |
 parrot  /  monthly

       month        rx      |     tx      |    total    |   avg. rate
    ------------------------+-------------+-------------+---------------
      Apr '13         0 KiB |       0 KiB |       0 KiB |    0.00 kbit/s
      May '13     23.01 GiB |    3.76 GiB |   26.77 GiB |   83.85 kbit/s
      Jun '13     20.95 GiB |    2.60 GiB |   23.54 GiB |   76.20 kbit/s
      Jul '13     11.37 GiB |    1.40 GiB |   12.76 GiB |   84.91 kbit/s
    ------------------------+-------------+-------------+---------------
    estimated     24.14 GiB |    2.97 GiB |   27.11 GiB |
comment:81 Changed 3 years ago by chris
- Add Hours to Ticket changed from 0.0 to 0.25
- Total Hours changed from 36.83 to 37.08
I have edited all the Nginx config files listed above and changed access_log off; to access_log on;, but still I don't see the hits for images and js and css.
I think there must be some Ngnix config files I haven't managed to find or something...
Changed 3 years ago by chris
- Attachment puffin_2013-07-19_mysql_connections-month.png added
Puffin MySQL Connections by Month for 2013-07-19
Changed 3 years ago by chris
- Attachment puffin_2013-07-19_mysql_qcache_mem-day.png added
Puffin MySQL Query Cache by Day 2013-07-19
comment:82 Changed 3 years ago by chris
- Add Hours to Ticket changed from 0.0 to 0.35
- Total Hours changed from 37.08 to 37.43
The Puffin MySQL query cache, which was set at 512MB filled up last night:

And we are also not seeing the same large number of connections that we had before:

The latest from mysqltuner.pl:
 >>  MySQLTuner 1.2.0 - Major Hayden <major@mhtx.net>
 >>  Bug reports, feature requests, and downloads at http://mysqltuner.com/
 >>  Run with '--help' for additional options and output filtering
[OK] Logged in using credentials from debian maintenance account.

-------- General Statistics --------------------------------------------------
[--] Skipped version check for MySQLTuner script
[OK] Currently running supported MySQL version 5.5.31-MariaDB-1~squeeze-log
[OK] Operating on 64-bit architecture

-------- Storage Engine Statistics -------------------------------------------
[--] Status: +Archive -BDB +Federated +InnoDB -ISAM -NDBCluster
[--] Data in MyISAM tables: 106M (Tables: 2)
[--] Data in InnoDB tables: 451M (Tables: 1039)
[--] Data in PERFORMANCE_SCHEMA tables: 0B (Tables: 17)
[!!] Total fragmented tables: 100

-------- Security Recommendations  -------------------------------------------
[OK] All database users have passwords assigned

-------- Performance Metrics -------------------------------------------------
[--] Up for: 4d 9h 18m 51s (30M q [79.462 qps], 756K conn, TX: 56B, RX: 4B)
[--] Reads / Writes: 77% / 23%
[--] Total buffers: 3.8G global + 44.8M per thread (150 max threads)
[!!] Maximum possible memory usage: 10.3G (129% of installed RAM)
[OK] Slow queries: 0% (151K/30M)
[OK] Highest usage of available connections: 28% (42/150)
[OK] Key buffer size / total MyISAM indexes: 256.0M/100.4M
[OK] Key buffer hit rate: 99.9% (44M cached / 24K reads)
[OK] Query cache efficiency: 87.4% (23M cached / 27M selects)
[!!] Query cache prunes per day: 5291
[OK] Sorts requiring temporary tables: 1% (3K temp sorts / 344K sorts)
[!!] Joins performed without indexes: 6089
[OK] Temporary tables created on disk: 25% (108K on disk / 433K total)
[OK] Thread cache hit rate: 99% (42 created / 756K connections)
[OK] Table cache hit rate: 31% (2K open / 9K opened)
[OK] Open file limit used: 0% (80/196K)
[OK] Table locks acquired immediately: 99% (5M immediate / 5M locks)
[OK] InnoDB data size / buffer pool: 451.7M/1.0G

-------- Recommendations -----------------------------------------------------
General recommendations:
    Run OPTIMIZE TABLE to defragment tables for better performance
    Reduce your overall MySQL memory footprint for system stability
    Increasing the query_cache size over 128M may reduce performance
    Adjust your join queries to always utilize indexes
Variables to adjust:
  *** MySQL's maximum memory usage is dangerously high ***
  *** Add RAM before increasing MySQL buffer variables ***
    query_cache_size (> 512M) [see warning above]
    join_buffer_size (> 32.0M, or always use indexes with joins)
I have changed these values in /etc/my/my.cnf, doubling the memory for the join_buffer_size and halving the number of connections:
join_buffer_size        = 64M
max_connections         = 75
max_user_connections    = 75
I was tempted to increase the size of the query cache but after reading this:
- http://stackoverflow.com/questions/2095614/mysql-query-caching-limited-to-a-maximum-cache-size-of-128-mb
- https://blogs.oracle.com/dlutz/entry/mysql_query_cache_sizing
It might be that we would be better off making it smaller...
Following is the result of the tuning-primer.sh script:
        -- MYSQL PERFORMANCE TUNING PRIMER --
             - By: Matthew Montgomery -

MySQL Version 5.5.31-MariaDB-1~squeeze-log x86_64

Uptime = 4 days 9 hrs 37 min 26 sec
Avg. qps = 79
Total Questions = 30217672
Threads Connected = 2

Server has been running for over 48hrs.
It should be safe to follow these recommendations

To find out more information on how each of these
runtime variables effects performance visit:
http://dev.mysql.com/doc/refman/5.5/en/server-system-variables.html
Visit http://www.mysql.com/products/enterprise/advisors.html
for info about MySQL's Enterprise Monitoring and Advisory Service

SLOW QUERIES
The slow query log is enabled.
Current long_query_time = 5.000000 sec.
You have 151779 out of 30217798 that take longer than 5.000000 sec. to complete
Your long_query_time seems to be fine

BINARY UPDATE LOG
The binary update log is NOT enabled.
You will not be able to do point in time recovery
See http://dev.mysql.com/doc/refman/5.5/en/point-in-time-recovery.html

WORKER THREADS
Current thread_cache_size = 128
Current threads_cached = 41
Current threads_per_sec = 0
Historic threads_per_sec = 0
Your thread_cache_size is fine

MAX CONNECTIONS
Current max_connections = 150
Current threads_connected = 1
Historic max_used_connections = 42
The number of used connections is 28% of the configured maximum.
Your max_connections variable seems to be fine.

INNODB STATUS
Current InnoDB index space = 178 M
Current InnoDB data space = 451 M
Current InnoDB buffer pool free = 42 %
Current innodb_buffer_pool_size = 1.00 G
Depending on how much space your innodb indexes take up it may be safe
to increase this value to up to 2 / 3 of total system memory

MEMORY USAGE
Max Memory Ever Allocated : 3.59 G
Configured Max Per-thread Buffers : 6.55 G
Configured Max Global Buffers : 1.76 G
Configured Max Memory Limit : 8.31 G
Physical Memory : 7.98 G

Max memory limit exceeds 90% of physical memory

KEY BUFFER
Current MyISAM index space = 100 M
Current key_buffer_size = 256 M
Key cache miss rate is 1 : 1857
Key buffer free ratio = 72 %
Your key_buffer_size seems to be fine

QUERY CACHE
Query cache is enabled
Current query_cache_size = 512 M
Current query_cache_used = 326 M
Current query_cache_limit = 2 M
Current Query cache Memory fill ratio = 63.76 %
Current query_cache_min_res_unit = 1 K
Query Cache is 22 % fragmented
Run "FLUSH QUERY CACHE" periodically to defragment the query cache memory
If you have many small queries lower 'query_cache_min_res_unit' to reduce fragmentation.
MySQL won't cache query results that are larger than query_cache_limit in size

SORT OPERATIONS
Current sort_buffer_size = 512 K
Current read_rnd_buffer_size = 4 M
Sort buffer seems to be fine

JOINS
tuning-primer.sh: line 402: export: `2097152': not a valid identifier
Current join_buffer_size = 32.00 M
You have had 6104 queries where a join could not use an index properly
join_buffer_size >= 4 M
This is not advised
You should enable "log-queries-not-using-indexes"
Then look for non indexed joins in the slow query log.

OPEN FILES LIMIT
Current open_files_limit = 196608 files
The open_files_limit should typically be set to at least 2x-3x
that of table_cache if you have heavy MyISAM usage.
Your open_files_limit value seems to be fine

TABLE CACHE
Current table_open_cache = 8192 tables
Current table_definition_cache = 6144 tables
You have a total of 1082 tables
You have 2834 open tables.
The table_cache value seems to be fine

TEMP TABLES
Current max_heap_table_size = 4.00 G
Current tmp_table_size = 2.00 G
Of 326085 temp tables, 25% were created on disk
Perhaps you should increase your tmp_table_size and/or max_heap_table_size
to reduce the number of disk-based temporary tables
Note! BLOB and TEXT columns are not allow in memory tables.
If you are using these columns raising these values might not impact your
ratio of on disk temp tables.

TABLE SCANS
Current read_buffer_size = 8 M
Current table scan ratio = 94 : 1
read_buffer_size seems to be fine

TABLE LOCKING
Current Lock Wait ratio = 1 : 1832134
Your table locking seems to be fine
I'm not going to restart MySQL right now as we have a MySQL update pending, see ticket:573.
Changed 3 years ago by chris
- Attachment puffin_2013-07-19_phpfpm_status-day.png added
Puffin 2013-07-19 PHP-FPM Status
comment:83 Changed 3 years ago by chris
- Add Hours to Ticket changed from 0.0 to 0.25
- Total Hours changed from 37.43 to 37.68
Looking at the mumber of php-fpm processes I think we have too many spare, it seems to be a waste of resources for most of the time:

I had set the number of spare servers high so that there would be lots available at peak time but I'm not sure this is the bast way to do it, BOA has the max spare set to 1 by default, so I have edited these values in /opt/local/etc/php53-fpm.conf:
pm.start_servers = 2
pm.min_spare_servers = 2
pm.max_spare_servers = 6
And restarted php-fpm53.
Changed 3 years ago by chris
- Attachment puffin_2013-07-19_2_phpfpm_status-day.png added
Puffin PHP-FPM 2013-07-19
Changed 3 years ago by chris
- Attachment puffin_2013-07-10_multips_memory-day.png added
Puffin 2013-07-19 Memory Usage
comment:84 Changed 3 years ago by chris
- Add Hours to Ticket changed from 0.0 to 0.1
- Total Hours changed from 37.68 to 37.78
You can see the effect of the changes to php-fpm here:

And the drop in memory usage:

The drop in MySQL memory usage is because of the restart after the upgrade, see ticket:573.
Changed 3 years ago by chris
- Attachment puffin_2013-07-19_fw_packets-day.png added
Puffin 2013-07-19 Firewall Packets
Changed 3 years ago by chris
- Attachment puffin_2013-07-19-2_mysql_queries-day.png added
Puffin 2013-07-19 Mysql Query Cache
comment:85 Changed 3 years ago by chris
- Add Hours to Ticket changed from 0.0 to 0.1
- Total Hours changed from 37.78 to 37.88
One further thought on the mySQL Query cache, when we have a big traffic spike like the one yesterday around noon:

It appears that many of the requests are being served from the MySQL cache:

In fact it's almost impossible to see any inserts or modify queries on this graph so I suspect that for our usage it might make sense to have a massive query cache.
Changed 3 years ago by chris
- Attachment puffin_daily_usage_201307.png added
Puffin Webalizer 2013-07-19
comment:86 Changed 3 years ago by chris
- Add Hours to Ticket changed from 0.0 to 0.25
- Total Hours changed from 37.88 to 38.13
Bandwidth wise we hit a new high yesterday, over 3GB in a day:

Yesterday was a high for the week with the Piwik stats also.
Here are the latest bandwidth stats from Xen:
 puffin  /  monthly

       month        rx      |     tx      |    total    |   avg. rate
    ------------------------+-------------+-------------+---------------
      Nov '12         0 KiB |       0 KiB |       0 KiB |    0.00 kbit/s
      Dec '12         0 KiB |       0 KiB |       0 KiB |    0.00 kbit/s
      Mar '13     32.26 GiB |    4.20 GiB |   36.46 GiB |  114.19 kbit/s
      Apr '13     68.61 GiB |   14.06 GiB |   82.66 GiB |  267.52 kbit/s
      May '13     65.49 GiB |   22.61 GiB |   88.10 GiB |  275.92 kbit/s
      Jun '13     68.12 GiB |   16.18 GiB |   84.31 GiB |  272.85 kbit/s
      Jul '13     62.42 GiB |   14.31 GiB |   76.73 GiB |  401.87 kbit/s
    ------------------------+-------------+-------------+---------------
    estimated    104.39 GiB |   23.92 GiB |  128.31 GiB |
Changed 3 years ago by chris
- Attachment puffin-2013-07-26-load-day.png added
Puffin Load 2013-07-26
comment:87 Changed 3 years ago by chris
- Add Hours to Ticket changed from 0.0 to 0.6
- Total Hours changed from 38.13 to 38.73
There was a massive load spike today that resulted in BOA shutting down Nginx and PHP-FPM.

The issue started around 2:20pm:
uptime :
 14:21:15 up 36 days,  5:38,  0 users,  load average: 93.68, 71.10, 37.93
Twenty mins later the load was approaching 200:
uptime :
 14:41:00 up 36 days,  5:57,  0 users,  load average: 189.37, 169.22, 118.81
With this load the dumping of the output of top into a log file is pointless and it doesn't work, so I have edited this from the /var/xdrago/second.sh script.
Looking at the logs I noticed a FTP connection that happened around the same time (which is probably unrelated), this is from var/log/messages:
Jul 26 14:29:06 puffin pure-ftpd: (?@50.192.103.201) [INFO] New connection from 50.192.103.201
Jul 26 14:41:00 puffin pure-ftpd: (?@50.192.103.201) [INFO] Logout.
Jim, does anyone need FTP access, can we simply uninstall the pure-ftp server?
Looking in the /var/log/php/php53-fpm-error.log php-fpm wasn't running for about 8 mins:
[26-Jul-2013 14:41:08] NOTICE: Finishing ...
[26-Jul-2013 14:41:08] NOTICE: exiting, bye-bye!
[26-Jul-2013 14:49:00] NOTICE: fpm is running, pid 44718
[26-Jul-2013 14:49:00] NOTICE: ready to handle connections
I have done some grepping but haven't found anything else of note in the logs.
comment:88 Changed 3 years ago by chris
- Add Hours to Ticket changed from 0.0 to 0.25
- Total Hours changed from 38.73 to 38.98
This issue is very much ongoing, for example this is a list of all the recent load alert emails from lfd (there are a _lot_ less of these than the 5min munin alert emails that are sent when the load is over 4, see https://penguin.transitionnetwork.org/munin/transitionnetwork.org/puffin.transitionnetwork.org/load.html).
Aug 04 High 5 minute load average alert - 7.20
Aug 04 High 5 minute load average alert - 17.31
Aug 04 High 5 minute load average alert - 18.88
Aug 05 High 5 minute load average alert - 8.47
Aug 05 High 5 minute load average alert - 7.95
Aug 05 High 5 minute load average alert - 29.18
Aug 05 High 5 minute load average alert - 9.16
Aug 06 High 5 minute load average alert - 7.52
Aug 06 High 5 minute load average alert - 8.95
Aug 06 High 5 minute load average alert - 7.60
Aug 06 High 5 minute load average alert - 7.03
Aug 06 High 5 minute load average alert - 6.92
Aug 06 High 5 minute load average alert - 6.18
Aug 06 High 5 minute load average alert - 6.64
Aug 06 High 5 minute load average alert - 8.55
Aug 07 High 5 minute load average alert - 6.02
Aug 07 High 5 minute load average alert - 6.58
Aug 07 High 5 minute load average alert - 6.19
Aug 07 High 5 minute load average alert - 7.26
Aug 07 High 5 minute load average alert - 6.43
Aug 07 High 5 minute load average alert - 6.59
Aug 07 High 5 minute load average alert - 7.67
Aug 07 High 5 minute load average alert - 8.17
Aug 07 High 5 minute load average alert - 6.25
Aug 07 High 5 minute load average alert - 8.29
Aug 07 High 5 minute load average alert - 6.74
Aug 07 High 5 minute load average alert - 7.62
Aug 08 High 5 minute load average alert - 6.07
Aug 08 High 5 minute load average alert - 27.59
Aug 08 High 5 minute load average alert - 11.33
Aug 08 High 5 minute load average alert - 7.89
Aug 08 High 5 minute load average alert - 7.43
Aug 08 High 5 minute load average alert - 6.06
Aug 08 High 5 minute load average alert - 7.47
Aug 09 High 5 minute load average alert - 7.94
Aug 09 High 5 minute load average alert - 6.62
Aug 09 High 5 minute load average alert - 6.14
Aug 09 High 5 minute load average alert - 12.39
Aug 09 High 5 minute load average alert - 6.81
Aug 09 High 5 minute load average alert - 6.82
Aug 09 High 5 minute load average alert - 11.91
Aug 09 High 5 minute load average alert - 9.55
Aug 09 High 5 minute load average alert - 6.96
Aug 09 High 5 minute load average alert - 6.19
Aug 09 High 5 minute load average alert - 7.54
Aug 10 High 5 minute load average alert - 7.05
Aug 10 High 5 minute load average alert - 6.28
Aug 10 High 5 minute load average alert - 7.46
Aug 10 High 5 minute load average alert - 7.24
Aug 10 High 5 minute load average alert - 12.92
Aug 10 High 5 minute load average alert - 6.72
Aug 11 High 5 minute load average alert - 7.22
Aug 11 High 5 minute load average alert - 6.22
Aug 11 High 5 minute load average alert - 10.06
Aug 11 High 5 minute load average alert - 7.39
Aug 12 High 5 minute load average alert - 6.22
Aug 12 High 5 minute load average alert - 7.39
Aug 12 High 5 minute load average alert - 9.60
Aug 12 High 5 minute load average alert - 6.86
Aug 12 High 5 minute load average alert - 11.38
Aug 12 High 5 minute load average alert - 7.61
Aug 12 High 5 minute load average alert - 6.11
Aug 13 High 5 minute load average alert - 13.65
Aug 13 High 5 minute load average alert - 9.53
Aug 13 High 5 minute load average alert - 23.08
Aug 13 High 5 minute load average alert - 6.66
Aug 13 High 5 minute load average alert - 8.62
Aug 13 High 5 minute load average alert - 10.84
Aug 13 High 5 minute load average alert - 6.78
Aug 13 High 5 minute load average alert - 7.84
Aug 14 High 5 minute load average alert - 6.59
Aug 14 High 5 minute load average alert - 7.25
Aug 14 High 5 minute load average alert - 6.74
Aug 14 High 5 minute load average alert - 6.77
Aug 14 High 5 minute load average alert - 6.90
Aug 15 High 5 minute load average alert - 6.63
Aug 15 High 5 minute load average alert - 10.86
Aug 15 High 5 minute load average alert - 6.72
Aug 15 High 5 minute load average alert - 6.85
Aug 15 High 5 minute load average alert - 7.58
Aug 15 High 5 minute load average alert - 6.08
Aug 15 High 5 minute load average alert - 11.27
Aug 16 High 5 minute load average alert - 6.38
Aug 16 High 5 minute load average alert - 6.10
Aug 16 High 5 minute load average alert - 7.14
Aug 16 High 5 minute load average alert - 7.31
Aug 16 High 5 minute load average alert - 7.39
Aug 16 High 5 minute load average alert - 6.32
Aug 16 High 5 minute load average alert - 18.47
Aug 16 High 5 minute load average alert - 18.47
Aug 16 High 5 minute load average alert - 18.47
Aug 16 High 5 minute load average alert - 7.61
Aug 16 High 5 minute load average alert - 6.38
Aug 17 High 5 minute load average alert - 8.68
Aug 18 High 5 minute load average alert - 9.78
Aug 18 High 5 minute load average alert - 7.21
Aug 18 High 5 minute load average alert - 6.13
Aug 18 High 5 minute load average alert - 7.18
Aug 19 High 5 minute load average alert - 12.06
Aug 19 High 5 minute load average alert - 7.05
Aug 19 High 5 minute load average alert - 8.62
Aug 19 High 5 minute load average alert - 6.71
Aug 19 High 5 minute load average alert - 7.32
Aug 19 High 5 minute load average alert - 9.75
Aug 20 High 5 minute load average alert - 13.68
Aug 20 High 5 minute load average alert - 13.62
Aug 20 High 5 minute load average alert - 11.06
Aug 20 High 5 minute load average alert - 6.77
Aug 20 High 5 minute load average alert - 10.87
Aug 21 High 5 minute load average alert - 8.23
Aug 21 High 5 minute load average alert - 8.92
Aug 21 High 5 minute load average alert - 6.69
Aug 21 High 5 minute load average alert - 6.79
Aug 22 High 5 minute load average alert - 6.11
Aug 22 High 5 minute load average alert - 8.87
Aug 22 High 5 minute load average alert - 6.16
Aug 22 High 5 minute load average alert - 6.17
Aug 23 High 5 minute load average alert - 6.93
Aug 23 High 5 minute load average alert - 10.37
Aug 23 High 5 minute load average alert - 6.00
Aug 23 High 5 minute load average alert - 7.09
Aug 23 High 5 minute load average alert - 14.06
Aug 23 High 5 minute load average alert - 6.72
Aug 23 High 5 minute load average alert - 7.86
Aug 23 High 5 minute load average alert - 7.69
Aug 24 High 5 minute load average alert - 6.27
Aug 24 High 5 minute load average alert - 6.97
Aug 24 High 5 minute load average alert - 6.44
Aug 24 High 5 minute load average alert - 6.63
Aug 24 High 5 minute load average alert - 8.20
Aug 24 High 5 minute load average alert - 6.99
Aug 25 High 5 minute load average alert - 7.16
Aug 25 High 5 minute load average alert - 7.88
Aug 25 High 5 minute load average alert - 16.66
Aug 25 High 5 minute load average alert - 7.27
Aug 26 High 5 minute load average alert - 6.87
Aug 26 High 5 minute load average alert - 6.81
Aug 26 High 5 minute load average alert - 11.00                                                                                                                 4566 O + Aug 26 root@puffi lfd on puffin.webarch.net: High 5 minute load average alert - 7.23
Aug 26 High 5 minute load average alert - 8.68
Aug 26 High 5 minute load average alert - 6.44
Aug 26 High 5 minute load average alert - 6.15
Aug 27 High 5 minute load average alert - 6.31
Aug 27 High 5 minute load average alert - 11.43
Aug 27 High 5 minute load average alert - 11.61
Aug 27 High 5 minute load average alert - 7.18
Aug 27 High 5 minute load average alert - 6.05
Aug 27 High 5 minute load average alert - 41.91
Aug 27 High 5 minute load average alert - 17.85
Aug 27 High 5 minute load average alert - 6.61
Aug 28 High 5 minute load average alert - 6.33
Aug 28 High 5 minute load average alert - 6.70
Aug 28 High 5 minute load average alert - 6.86
Aug 28 High 5 minute load average alert - 13.35
Aug 28 High 5 minute load average alert - 17.06
Aug 28 High 5 minute load average alert - 31.46
Aug 28 High 5 minute load average alert - 6.64
Aug 28 High 5 minute load average alert - 6.15
Aug 28 High 5 minute load average alert - 7.15
Aug 29 High 5 minute load average alert - 9.57
Aug 29 High 5 minute load average alert - 7.41
Aug 29 High 5 minute load average alert - 7.03
Aug 29 High 5 minute load average alert - 7.40
Aug 29 High 5 minute load average alert - 8.42
Aug 29 High 5 minute load average alert - 6.56
Aug 29 High 5 minute load average alert - 8.52
Aug 29 High 5 minute load average alert - 8.37
Aug 30 High 5 minute load average alert - 7.52
Aug 30 High 5 minute load average alert - 8.78
Aug 30 High 5 minute load average alert - 6.87
Aug 30 High 5 minute load average alert - 8.27
Aug 30 High 5 minute load average alert - 9.88
Aug 30 High 5 minute load average alert - 7.89
Aug 31 High 5 minute load average alert - 6.16
Aug 31 High 5 minute load average alert - 7.59
Aug 31 High 5 minute load average alert - 7.05
Aug 31 High 5 minute load average alert - 7.95
Sep 01 High 5 minute load average alert - 7.33
Sep 01 High 5 minute load average alert - 7.09
Sep 01 High 5 minute load average alert - 6.82
Sep 02 High 5 minute load average alert - 8.23
Sep 02 High 5 minute load average alert - 6.16
Sep 02 High 5 minute load average alert - 7.51
Sep 02 High 5 minute load average alert - 7.04
Sep 02 High 5 minute load average alert - 7.57
Sep 02 High 5 minute load average alert - 6.08
Sep 03 High 5 minute load average alert - 13.18
Sep 03 High 5 minute load average alert - 8.05
Sep 03 High 5 minute load average alert - 7.75
Sep 03 High 5 minute load average alert - 6.86
Sep 03 High 5 minute load average alert - 6.08
Sep 03 High 5 minute load average alert - 19.09
Sep 03 High 5 minute load average alert - 8.56
Sep 03 High 5 minute load average alert - 7.01
Sep 03 High 5 minute load average alert - 7.29
Sep 03 High 5 minute load average alert - 6.32
Sep 03 High 5 minute load average alert - 6.64
Sep 04 High 5 minute load average alert - 20.16
Sep 04 High 5 minute load average alert - 9.14
Sep 04 High 5 minute load average alert - 7.35
Sep 04 High 5 minute load average alert - 6.50
Sep 04 High 5 minute load average alert - 9.07
Sep 04 High 5 minute load average alert - 6.63
Sep 05 High 5 minute load average alert - 8.44
Sep 05 High 5 minute load average alert - 6.43
Changed 3 years ago by jim
- Attachment mem-9sept2013-after-extra-drupal-caching.png added
9 sept 2013 - mem usage after more Drupal caching enabled
comment:89 Changed 3 years ago by jim
- Add Hours to Ticket changed from 0.0 to 0.25
- Total Hours changed from 38.98 to 39.23
It looks to me like since I've upped the use of Redis caches (which stores cache_view, cache_block etc) we're now getting short of memory, which is crippling the server's IO.
I restarted php53-fpm, redis and nginx as part of a little debug moment for work in #590, and after that we were short of memory.
I think we could drop some from MySQL so that more is spare/available to Redis.
See attached memory chart (https://tech.transitionnetwork.org/trac/attachment/ticket/555/mem-9sept2013-after-extra-drupal-caching.png) for the current situation.
comment:90 follow-up: ↓ 92 Changed 3 years ago by jim
- Add Hours to Ticket changed from 0.0 to 0.25
- Total Hours changed from 39.23 to 39.48
I could be wrong, but having looked around Drupal and done some improvements, I have a hunch that a lot of what makes the server's load spike is IO contention -- when disk activity is higher, load spikes quickly.. Hence my suggestion over on #591.
Also, and this is just me wondering out loud now, does Redis-server has enough memory? I see its utilisation is stuck low -- around 200-400Mb with occasional moves towards 1Gb and back down again -- which well might be ok, but in an ideal world it would have lots of things in it as what it contains is post-processed goodies like query results, rendered views output, blocks and whole pages etc.
So two questions, Chris:
- Do you think disk IO speed/latency is an issue? You suggested a move to a ZFS/SSD thingy recently which implies you might...
- Do you think Redis has enough memory? (or if it 'takes what's left' does MySQL have too much?)
comment:91 Changed 3 years ago by jim
Aha.. 2 things about redis:
- I had my readings or by a factor of 5 - peaks in past being 200Mb,not 1Gb.
- The work I have done on cron in #590 (around comment 33) have massively improved Redis utilisation by stopping it being wiped hourly... I plan to move system_cron to run once a day at ~5am from every 3 hours which should give us a really big boost. Am monitoring effects first though.
comment:92 in reply to: ↑ 90 Changed 3 years ago by chris
- Add Hours to Ticket changed from 0.0 to 0.1
- Total Hours changed from 39.48 to 39.58
Replying to jim:
does Redis-server has enough memory?
I was also wondering this some months back:
Replying to chris:
A question for Jim, currently there is enough RAM that we could double the Redis RAM from 512MB to 1GB -- any reason not to do this? The performance drop when we didn't have Redis running was very significant and I expect that giving Redis extra RAM would speed things up.
If we do this I think we should also consider reducing the RAM usage of MySQL.
comment:93 Changed 3 years ago by chris
- Add Hours to Ticket changed from 0.0 to 0.25
- Total Hours changed from 39.58 to 39.83
We had a two week period, which appears to have equated with the time that New Relic was running, ticket:586, without the frequent load spikes, but since midnight on the 29th September they have returned:
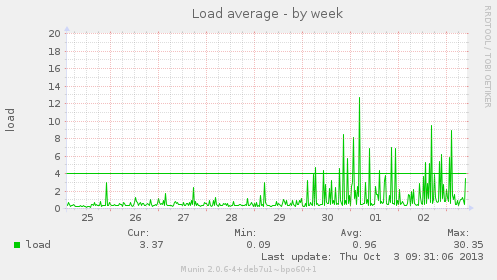
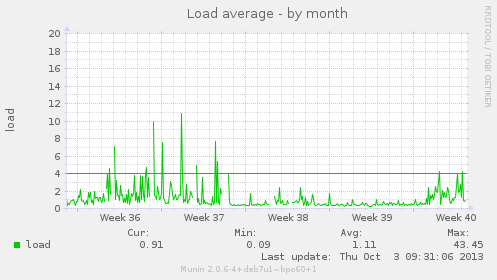
I suspect that it is coincidental that the spikes dropped off while New Relic was running, but I don't have a good explanation for the change in the pattern, there isn't anything noticeable on the webalizer stats.
comment:94 Changed 3 years ago by chris
Following the discussion on ticket:601#comment:4 the changes to dump data when the high load trigger is tripped, see ticket:555#comment:48 have been revisited, first the old log file was moved:
mv /var/log/high-load.log /var/log/high-load.log.1
And the following changes were made to /var/xdrago/:
nginx_high_load_on()
{
  mv -f /data/conf/nginx_high_load_off.conf /data/conf/nginx_high_load.conf
  /etc/init.d/nginx reload

  # start additions
  echo "====================" >> /var/log/high-load.log
  echo "nginx high load on" >> /var/log/high-load.log
  echo "ONEX_LOAD = $ONEX_LOAD" >> /var/log/high-load.log
  echo "FIVX_LOAD = $FIVX_LOAD" >> /var/log/high-load.log
  echo "uptime : " >> /var/log/high-load.log
  uptime >> /var/log/high-load.log
  echo "vmstat : " >> /var/log/high-load.log
  vmstat -S M -s >> /var/log/high-load.log
  vmstat -S M -d >> /var/log/high-load.log
  echo "top : " >> /var/log/high-load.log
  top -n 1 -b >> /var/log/high-load.log
  echo "====================" >> /var/log/high-load.log
  # end additions

}
comment:95 Changed 3 years ago by chris
- Add Hours to Ticket changed from 0.0 to 0.25
- Total Hours changed from 39.83 to 40.08
Ooops forgot to add the time to make the above changes.
comment:96 Changed 3 years ago by chris
- Add Hours to Ticket changed from 0.0 to 0.1
- Total Hours changed from 40.08 to 40.18
15 mins ago there was a load spike, this is what was written to /var/log/high-load.log:
====================
nginx high load on
ONEX_LOAD = 1283
FIVX_LOAD = 395
uptime :
13:16:36 up 11 days, 3:58, 2 users, load average: 14.28, 4.39, 2.11
vmstat :
8175 M total memory
7638 M used memory
4913 M active memory
2048 M inactive memory
537 M free memory
700 M buffer memory
2904 M swap cache
1023 M total swap
0 M used swap
1023 M free swap
30401331 non-nice user cpu ticks
15 nice user cpu ticks
45313222 system cpu ticks
2530109095 idle cpu ticks
4701595 IO-wait cpu ticks
536 IRQ cpu ticks
644384 softirq cpu ticks
6274220 stolen cpu ticks
7029105 pages paged in
362477344 pages paged out
0 pages swapped in
0 pages swapped out
1026236759 interrupts
786785317 CPU context switches
1379837901 boot time
20612641 forks
disk- ------------reads------------ ------------writes----------- -----IO------
total merged sectors ms total merged sectors ms cur sec
xvda2 391011 2506 13647722 2073724 17869827 49729737 724954688 952865084 0 29399
xvda1 26909 24402 410488 114452 0 0 0 0 0 19
top :
top - 13:16:37 up 11 days, 3:58, 2 users, load average: 14.28, 4.39, 2.11
Tasks: 318 total, 47 running, 268 sleeping, 0 stopped, 3 zombie
Cpu0 : 2.6%us, 2.3%sy, 0.0%ni, 92.2%id, 2.2%wa, 0.0%hi, 0.3%si, 0.3%st
Cpu1 : 1.7%us, 2.3%sy, 0.0%ni, 95.6%id, 0.1%wa, 0.0%hi, 0.0%si, 0.2%st
Cpu2 : 1.7%us, 2.2%sy, 0.0%ni, 95.8%id, 0.0%wa, 0.0%hi, 0.0%si, 0.2%st
Cpu3 : 1.3%us, 1.9%sy, 0.0%ni, 96.6%id, 0.0%wa, 0.0%hi, 0.0%si, 0.2%st
Cpu4 : 1.2%us, 1.8%sy, 0.0%ni, 96.7%id, 0.0%wa, 0.0%hi, 0.0%si, 0.2%st
Cpu5 : 1.0%us, 1.7%sy, 0.0%ni, 97.1%id, 0.0%wa, 0.0%hi, 0.0%si, 0.2%st
Cpu6 : 0.9%us, 1.6%sy, 0.0%ni, 97.2%id, 0.0%wa, 0.0%hi, 0.0%si, 0.2%st
Cpu7 : 0.9%us, 1.6%sy, 0.0%ni, 97.3%id, 0.0%wa, 0.0%hi, 0.0%si, 0.2%st
Cpu8 : 0.9%us, 1.5%sy, 0.0%ni, 97.3%id, 0.0%wa, 0.0%hi, 0.0%si, 0.2%st
Cpu9 : 0.8%us, 1.5%sy, 0.0%ni, 97.4%id, 0.0%wa, 0.0%hi, 0.0%si, 0.2%st
Cpu10 : 0.8%us, 1.5%sy, 0.0%ni, 97.4%id, 0.0%wa, 0.0%hi, 0.0%si, 0.2%st
Cpu11 : 0.8%us, 1.5%sy, 0.0%ni, 97.5%id, 0.0%wa, 0.0%hi, 0.0%si, 0.2%st
Cpu12 : 0.8%us, 1.4%sy, 0.0%ni, 97.5%id, 0.0%wa, 0.0%hi, 0.0%si, 0.2%st
Cpu13 : 0.8%us, 1.4%sy, 0.0%ni, 97.5%id, 0.0%wa, 0.0%hi, 0.0%si, 0.2%st
Mem: 8372060k total, 7801800k used, 570260k free, 717156k buffers
Swap: 1048568k total, 0k used, 1048568k free, 2973932k cached
PID USER PR NI VIRT RES SHR S %CPU %MEM TIME+ COMMAND
4125 mysql 20 0 2782m 2.0g 10m S 104 25.3 145:37.28 mysqld
41336 tn 20 0 250m 40m 8960 R 65 0.5 0:09.07 drush.php
30570 www-data 20 0 791m 116m 56m S 63 1.4 0:29.94 php-fpm
30585 www-data 20 0 759m 73m 45m R 56 0.9 0:28.39 php-fpm
30577 www-data 20 0 770m 83m 43m R 52 1.0 0:29.00 php-fpm
39927 www-data 20 0 779m 82m 33m R 50 1.0 0:20.49 php-fpm
30587 www-data 20 0 769m 78m 42m R 47 1.0 0:26.04 php-fpm
30575 www-data 20 0 759m 74m 45m R 45 0.9 0:34.82 php-fpm
30584 www-data 20 0 754m 66m 43m R 45 0.8 0:28.25 php-fpm
30586 www-data 20 0 778m 90m 43m R 45 1.1 0:29.98 php-fpm
39848 www-data 20 0 772m 79m 35m R 45 1.0 0:18.66 php-fpm
30588 www-data 20 0 777m 90m 43m S 43 1.1 0:29.14 php-fpm
30589 www-data 20 0 753m 66m 43m R 43 0.8 0:32.59 php-fpm
41542 tn 20 0 240m 31m 9004 R 43 0.4 0:07.38 drush.php
30573 www-data 20 0 782m 94m 42m R 41 1.2 0:27.88 php-fpm
39831 www-data 20 0 762m 69m 35m R 41 0.8 0:20.34 php-fpm
30578 www-data 20 0 781m 90m 41m R 39 1.1 0:37.33 php-fpm
40034 www-data 20 0 780m 83m 33m R 39 1.0 0:17.34 php-fpm
30572 www-data 20 0 778m 91m 43m R 38 1.1 0:30.43 php-fpm
30581 www-data 20 0 791m 103m 43m R 38 1.3 0:28.55 php-fpm
30582 www-data 20 0 783m 97m 45m R 38 1.2 0:28.15 php-fpm
30579 www-data 20 0 782m 93m 41m R 34 1.1 0:30.45 php-fpm
26795 root 20 0 72968 10m 1764 R 32 0.1 0:07.78 nginx
30569 www-data 20 0 781m 95m 45m S 32 1.2 0:31.14 php-fpm
30568 www-data 20 0 802m 134m 59m S 31 1.6 0:26.51 php-fpm
30576 www-data 20 0 782m 96m 45m S 25 1.2 0:29.96 php-fpm
58401 redis 20 0 475m 75m 928 S 11 0.9 5:09.65 redis-server
41953 root 20 0 19200 1400 912 R 4 0.0 0:00.06 top
39554 root 20 0 10624 1372 1148 S 2 0.0 0:00.17 bash
39607 root 20 0 10624 1368 1148 S 2 0.0 0:00.38 bash
40013 www-data 20 0 0 0 0 R 2 0.0 0:03.96 nginx
40032 www-data 20 0 0 0 0 R 2 0.0 0:02.72 nginx
40047 www-data 20 0 69868 8396 1972 R 2 0.1 0:01.58 nginx
40048 www-data 20 0 72968 11m 1928 S 2 0.1 0:01.81 nginx
1 root 20 0 8356 768 636 S 0 0.0 0:55.98 init
2 root 20 0 0 0 0 S 0 0.0 0:00.02 kthreadd
3 root RT 0 0 0 0 S 0 0.0 1:13.56 migration/0
4 root 20 0 0 0 0 S 0 0.0 0:55.15 ksoftirqd/0
5 root RT 0 0 0 0 S 0 0.0 0:00.00 watchdog/0
6 root RT 0 0 0 0 S 0 0.0 1:16.81 migration/1
7 root 20 0 0 0 0 S 0 0.0 1:23.90 ksoftirqd/1
8 root RT 0 0 0 0 S 0 0.0 0:00.00 watchdog/1
9 root RT 0 0 0 0 S 0 0.0 1:06.91 migration/2
10 root 20 0 0 0 0 S 0 0.0 1:16.97 ksoftirqd/2
11 root RT 0 0 0 0 S 0 0.0 0:00.00 watchdog/2
12 root RT 0 0 0 0 S 0 0.0 1:08.80 migration/3
13 root 20 0 0 0 0 R 0 0.0 1:45.13 ksoftirqd/3
14 root RT 0 0 0 0 S 0 0.0 0:00.00 watchdog/3
15 root RT 0 0 0 0 S 0 0.0 1:05.97 migration/4
16 root 20 0 0 0 0 S 0 0.0 1:37.83 ksoftirqd/4
17 root RT 0 0 0 0 S 0 0.0 0:00.00 watchdog/4
18 root RT 0 0 0 0 S 0 0.0 1:06.23 migration/5
19 root 20 0 0 0 0 S 0 0.0 1:45.94 ksoftirqd/5
20 root RT 0 0 0 0 S 0 0.0 0:00.00 watchdog/5
21 root RT 0 0 0 0 S 0 0.0 1:08.04 migration/6
22 root 20 0 0 0 0 S 0 0.0 1:35.66 ksoftirqd/6
23 root RT 0 0 0 0 S 0 0.0 0:00.02 watchdog/6
24 root RT 0 0 0 0 S 0 0.0 1:00.92 migration/7
25 root 20 0 0 0 0 S 0 0.0 1:39.80 ksoftirqd/7
26 root RT 0 0 0 0 S 0 0.0 0:00.00 watchdog/7
27 root RT 0 0 0 0 S 0 0.0 1:02.56 migration/8
28 root 20 0 0 0 0 S 0 0.0 1:39.21 ksoftirqd/8
29 root RT 0 0 0 0 S 0 0.0 0:00.00 watchdog/8
30 root RT 0 0 0 0 S 0 0.0 1:06.20 migration/9
31 root 20 0 0 0 0 S 0 0.0 1:40.45 ksoftirqd/9
32 root RT 0 0 0 0 S 0 0.0 0:00.01 watchdog/9
33 root RT 0 0 0 0 S 0 0.0 1:05.33 migration/10
34 root 20 0 0 0 0 S 0 0.0 1:52.43 ksoftirqd/10
35 root RT 0 0 0 0 S 0 0.0 0:00.00 watchdog/10
36 root RT 0 0 0 0 S 0 0.0 1:03.28 migration/11
37 root 20 0 0 0 0 S 0 0.0 1:39.61 ksoftirqd/11
38 root RT 0 0 0 0 S 0 0.0 0:00.00 watchdog/11
39 root RT 0 0 0 0 S 0 0.0 1:04.47 migration/12
40 root 20 0 0 0 0 S 0 0.0 1:27.33 ksoftirqd/12
41 root RT 0 0 0 0 S 0 0.0 0:00.03 watchdog/12
42 root RT 0 0 0 0 S 0 0.0 1:08.44 migration/13
43 root 20 0 0 0 0 S 0 0.0 0:20.49 ksoftirqd/13
44 root RT 0 0 0 0 S 0 0.0 0:00.00 watchdog/13
45 root 20 0 0 0 0 S 0 0.0 0:15.25 events/0
46 root 20 0 0 0 0 S 0 0.0 0:17.27 events/1
47 root 20 0 0 0 0 S 0 0.0 0:15.69 events/2
48 root 20 0 0 0 0 S 0 0.0 0:12.99 events/3
49 root 20 0 0 0 0 S 0 0.0 0:14.55 events/4
50 root 20 0 0 0 0 S 0 0.0 0:18.10 events/5
51 root 20 0 0 0 0 S 0 0.0 0:13.79 events/6
52 root 20 0 0 0 0 S 0 0.0 0:14.06 events/7
53 root 20 0 0 0 0 S 0 0.0 0:14.13 events/8
54 root 20 0 0 0 0 S 0 0.0 0:13.40 events/9
55 root 20 0 0 0 0 S 0 0.0 0:10.96 events/10
56 root 20 0 0 0 0 S 0 0.0 0:11.43 events/11
57 root 20 0 0 0 0 S 0 0.0 0:14.11 events/12
58 root 20 0 0 0 0 S 0 0.0 0:18.72 events/13
59 root 20 0 0 0 0 S 0 0.0 0:00.00 cpuset
60 root 20 0 0 0 0 S 0 0.0 0:00.00 khelper
61 root 20 0 0 0 0 S 0 0.0 0:00.00 netns
62 root 20 0 0 0 0 S 0 0.0 0:00.00 async/mgr
63 root 20 0 0 0 0 S 0 0.0 0:00.00 pm
64 root 20 0 0 0 0 S 0 0.0 0:00.00 xenwatch
65 root 20 0 0 0 0 S 0 0.0 0:00.00 xenbus
66 root 20 0 0 0 0 S 0 0.0 0:02.06 sync_supers
67 root 20 0 0 0 0 S 0 0.0 0:12.14 bdi-default
68 root 20 0 0 0 0 S 0 0.0 0:00.00 kintegrityd/0
69 root 20 0 0 0 0 S 0 0.0 0:00.00 kintegrityd/1
70 root 20 0 0 0 0 S 0 0.0 0:00.00 kintegrityd/2
71 root 20 0 0 0 0 S 0 0.0 0:00.00 kintegrityd/3
72 root 20 0 0 0 0 S 0 0.0 0:00.00 kintegrityd/4
73 root 20 0 0 0 0 S 0 0.0 0:00.00 kintegrityd/5
74 root 20 0 0 0 0 S 0 0.0 0:00.00 kintegrityd/6
75 root 20 0 0 0 0 S 0 0.0 0:00.00 kintegrityd/7
76 root 20 0 0 0 0 S 0 0.0 0:00.00 kintegrityd/8
77 root 20 0 0 0 0 S 0 0.0 0:00.00 kintegrityd/9
78 root 20 0 0 0 0 S 0 0.0 0:00.00 kintegrityd/10
79 root 20 0 0 0 0 S 0 0.0 0:00.00 kintegrityd/11
80 root 20 0 0 0 0 S 0 0.0 0:00.00 kintegrityd/12
81 root 20 0 0 0 0 S 0 0.0 0:00.00 kintegrityd/13
82 root 20 0 0 0 0 S 0 0.0 0:11.48 kblockd/0
83 root 20 0 0 0 0 S 0 0.0 0:00.03 kblockd/1
84 root 20 0 0 0 0 S 0 0.0 0:00.01 kblockd/2
85 root 20 0 0 0 0 S 0 0.0 0:00.01 kblockd/3
86 root 20 0 0 0 0 S 0 0.0 0:00.00 kblockd/4
87 root 20 0 0 0 0 S 0 0.0 0:00.00 kblockd/5
88 root 20 0 0 0 0 S 0 0.0 0:00.00 kblockd/6
89 root 20 0 0 0 0 S 0 0.0 0:00.00 kblockd/7
90 root 20 0 0 0 0 S 0 0.0 0:00.00 kblockd/8
91 root 20 0 0 0 0 S 0 0.0 0:00.00 kblockd/9
92 root 20 0 0 0 0 S 0 0.0 0:00.00 kblockd/10
93 root 20 0 0 0 0 S 0 0.0 0:00.00 kblockd/11
94 root 20 0 0 0 0 S 0 0.0 0:00.00 kblockd/12
95 root 20 0 0 0 0 S 0 0.0 0:00.00 kblockd/13
96 root 20 0 0 0 0 S 0 0.0 0:00.00 kseriod
111 root 20 0 0 0 0 S 0 0.0 0:00.00 kondemand/0
112 root 20 0 0 0 0 S 0 0.0 0:00.00 kondemand/1
113 root 20 0 0 0 0 S 0 0.0 0:00.00 kondemand/2
114 root 20 0 0 0 0 S 0 0.0 0:00.00 kondemand/3
115 root 20 0 0 0 0 S 0 0.0 0:00.00 kondemand/4
116 root 20 0 0 0 0 S 0 0.0 0:00.00 kondemand/5
117 root 20 0 0 0 0 S 0 0.0 0:00.00 kondemand/6
118 root 20 0 0 0 0 S 0 0.0 0:00.00 kondemand/7
119 root 20 0 0 0 0 S 0 0.0 0:00.00 kondemand/8
120 root 20 0 0 0 0 S 0 0.0 0:00.00 kondemand/9
121 root 20 0 0 0 0 S 0 0.0 0:00.00 kondemand/10
122 root 20 0 0 0 0 S 0 0.0 0:00.00 kondemand/11
123 root 20 0 0 0 0 S 0 0.0 0:00.00 kondemand/12
124 root 20 0 0 0 0 S 0 0.0 0:00.00 kondemand/13
125 root 20 0 0 0 0 S 0 0.0 0:00.66 khungtaskd
126 root 20 0 0 0 0 S 0 0.0 0:04.11 kswapd0
127 root 25 5 0 0 0 S 0 0.0 0:00.00 ksmd
128 root 20 0 0 0 0 S 0 0.0 0:00.00 aio/0
129 root 20 0 0 0 0 S 0 0.0 0:00.00 aio/1
130 root 20 0 0 0 0 S 0 0.0 0:00.00 aio/2
131 root 20 0 0 0 0 S 0 0.0 0:00.00 aio/3
132 root 20 0 0 0 0 S 0 0.0 0:00.00 aio/4
133 root 20 0 0 0 0 S 0 0.0 0:00.00 aio/5
134 root 20 0 0 0 0 S 0 0.0 0:00.00 aio/6
135 root 20 0 0 0 0 S 0 0.0 0:00.00 aio/7
136 root 20 0 0 0 0 S 0 0.0 0:00.00 aio/8
137 root 20 0 0 0 0 S 0 0.0 0:00.00 aio/9
138 root 20 0 0 0 0 S 0 0.0 0:00.00 aio/10
139 root 20 0 0 0 0 S 0 0.0 0:00.00 aio/11
140 root 20 0 0 0 0 S 0 0.0 0:00.00 aio/12
141 root 20 0 0 0 0 S 0 0.0 0:00.00 aio/13
142 root 20 0 0 0 0 S 0 0.0 0:00.00 crypto/0
143 root 20 0 0 0 0 S 0 0.0 0:00.00 crypto/1
144 root 20 0 0 0 0 S 0 0.0 0:00.00 crypto/2
145 root 20 0 0 0 0 S 0 0.0 0:00.00 crypto/3
146 root 20 0 0 0 0 S 0 0.0 0:00.00 crypto/4
147 root 20 0 0 0 0 S 0 0.0 0:00.00 crypto/5
148 root 20 0 0 0 0 S 0 0.0 0:00.00 crypto/6
149 root 20 0 0 0 0 S 0 0.0 0:00.00 crypto/7
150 root 20 0 0 0 0 S 0 0.0 0:00.00 crypto/8
151 root 20 0 0 0 0 S 0 0.0 0:00.00 crypto/9
152 root 20 0 0 0 0 S 0 0.0 0:00.00 crypto/10
153 root 20 0 0 0 0 S 0 0.0 0:00.00 crypto/11
154 root 20 0 0 0 0 S 0 0.0 0:00.00 crypto/12
155 root 20 0 0 0 0 S 0 0.0 0:00.00 crypto/13
158 root 20 0 0 0 0 S 0 0.0 0:00.00 khvcd
211 root 20 0 0 0 0 S 0 0.0 0:00.00 kstriped
220 root 20 0 0 0 0 S 0 0.0 3:11.03 kjournald
266 root 16 -4 16744 744 372 S 0 0.0 0:00.21 udevd
304 root 18 -2 16740 724 348 S 0 0.0 0:01.55 udevd
368 root 20 0 0 0 0 S 0 0.0 0:59.37 flush-202:2
720 root 20 0 6468 604 480 S 0 0.0 10:55.47 vnstatd
745 root 20 0 0 0 0 S 0 0.0 0:00.00 kauditd
3233 root 20 0 19164 1716 1332 S 0 0.0 0:00.25 mysqld_safe
4126 root 20 0 5352 688 584 S 0 0.0 0:00.02 logger
4581 root 20 0 49176 1140 584 S 0 0.0 0:05.95 sshd
4708 root 16 -4 45180 964 612 S 0 0.0 0:00.31 auditd
4710 root 12 -8 14296 780 648 S 0 0.0 0:00.73 audispd
4739 root 20 0 22432 1060 796 S 0 0.0 7:57.74 cron
5897 root 20 0 117m 1676 1068 S 0 0.0 2:45.63 rsyslogd
5961 daemon 20 0 18716 448 284 S 0 0.0 0:00.01 atd
5987 pdnsd 20 0 207m 1984 632 S 0 0.0 2:55.65 pdnsd
6010 messageb 20 0 23268 788 564 S 0 0.0 0:00.01 dbus-daemon
6631 root 20 0 70480 3184 2492 S 0 0.0 0:00.03 sshd
6979 chris 20 0 70480 1584 876 S 0 0.0 0:00.50 sshd
6980 chris 20 0 25736 8528 1544 S 0 0.1 0:00.59 bash
7542 root 20 0 24572 1244 992 S 0 0.0 0:00.00 sudo
7543 root 20 0 22156 5036 1632 S 0 0.1 0:01.14 bash
7621 root 20 0 41872 8756 1820 S 0 0.1 2:24.25 munin-node
7651 root 20 0 5932 612 516 S 0 0.0 0:00.00 getty
9389 root 20 0 37176 2384 1868 S 0 0.0 2:09.26 master
9393 postfix 20 0 39472 2644 1984 S 0 0.0 0:19.09 qmgr
9394 root 20 0 28712 1736 1224 S 0 0.0 0:02.12 pure-ftpd
13773 root 20 0 56612 17m 1544 S 0 0.2 10:06.22 lfd
14843 postfix 20 0 39240 2420 1912 S 0 0.0 0:00.01 pickup
18931 postfix 20 0 42176 3708 2440 S 0 0.0 0:11.16 tlsmgr
20232 root 18 -2 16740 596 228 S 0 0.0 0:00.00 udevd
30567 root 20 0 734m 6976 1828 S 0 0.1 0:00.18 php-fpm
36953 postfix 20 0 39252 2396 1908 S 0 0.0 0:00.01 trivial-rewrite
36954 postfix 20 0 43660 3244 2568 S 0 0.0 0:00.01 smtp
36955 postfix 20 0 43660 3244 2568 S 0 0.0 0:00.00 smtp
36960 postfix 20 0 39272 2416 1924 S 0 0.0 0:00.01 bounce
36961 postfix 20 0 39272 2364 1888 S 0 0.0 0:00.00 bounce
39541 root 20 0 32812 1080 776 S 0 0.0 0:00.00 cron
39542 root 20 0 32812 1080 776 S 0 0.0 0:00.00 cron
39543 root 20 0 32812 1080 776 S 0 0.0 0:00.00 cron
39546 root 20 0 3956 576 484 S 0 0.0 0:00.00 sh
39548 root 20 0 3956 576 484 S 0 0.0 0:00.00 sh
39549 root 20 0 3956 576 484 S 0 0.0 0:00.00 sh
39551 root 20 0 10612 1356 1148 S 0 0.0 0:00.00 bash
39552 root 20 0 10660 1412 1156 S 0 0.0 0:00.15 bash
39581 root 20 0 32812 1080 776 S 0 0.0 0:00.00 cron
39582 root 20 0 32812 1080 776 S 0 0.0 0:00.00 cron
39585 root 20 0 32812 1080 776 S 0 0.0 0:00.00 cron
39594 root 20 0 3956 580 484 S 0 0.0 0:00.00 sh
39598 root 20 0 3956 576 484 S 0 0.0 0:00.00 sh
39601 root 20 0 3956 576 484 S 0 0.0 0:00.00 sh
39605 root 20 0 10612 1352 1148 S 0 0.0 0:00.01 bash
39610 root 20 0 10660 1408 1156 S 0 0.0 0:00.12 bash
39671 root 20 0 70480 3180 2492 S 0 0.0 0:00.02 sshd
39758 chris 20 0 70480 1580 876 S 0 0.0 0:00.13 sshd
39759 chris 20 0 25736 8524 1544 S 0 0.1 0:00.54 bash
39800 root 20 0 24572 1244 992 S 0 0.0 0:00.00 sudo
39801 root 20 0 22104 4920 1568 S 0 0.1 0:00.33 bash
39802 root 20 0 41872 8016 1080 S 0 0.1 0:01.43 munin-node
39851 root 20 0 32812 1080 776 S 0 0.0 0:00.00 cron
39855 root 20 0 32812 1080 776 S 0 0.0 0:00.00 cron
39856 root 20 0 32812 1080 776 S 0 0.0 0:00.01 cron
39858 root 20 0 3956 580 484 S 0 0.0 0:00.00 sh
39860 root 20 0 3956 580 484 S 0 0.0 0:00.00 sh
39862 root 20 0 10624 1372 1148 S 0 0.0 0:00.21 bash
39865 root 20 0 3956 576 484 S 0 0.0 0:00.00 sh
39866 root 20 0 10644 1368 1124 S 0 0.0 0:00.05 bash
39876 root 20 0 10672 1436 1168 S 0 0.0 0:00.04 bash
40018 www-data 20 0 72968 11m 1952 R 0 0.1 0:08.89 nginx
40021 www-data 20 0 72968 11m 1916 R 0 0.1 0:02.40 nginx
40025 www-data 20 0 0 0 0 R 0 0.0 0:02.95 nginx
40027 www-data 20 0 0 0 0 R 0 0.0 0:02.15 nginx
40028 www-data 20 0 72968 11m 1940 R 0 0.1 0:02.54 nginx
40030 www-data 20 0 72968 11m 1940 R 0 0.1 0:01.67 nginx
40031 www-data 20 0 72968 11m 1948 R 0 0.1 0:02.55 nginx
40033 www-data 20 0 0 0 0 Z 0 0.0 0:01.72 nginx <defunct>
40035 www-data 20 0 72968 11m 1932 S 0 0.1 0:02.22 nginx
40036 www-data 20 0 0 0 0 Z 0 0.0 0:01.46 nginx <defunct>
40037 www-data 20 0 69868 8392 1968 R 0 0.1 0:01.30 nginx
40038 www-data 20 0 72968 11m 1928 R 0 0.1 0:01.20 nginx
40039 www-data 20 0 72968 11m 1928 R 0 0.1 0:01.24 nginx
40040 www-data 20 0 72968 11m 1948 R 0 0.1 0:01.66 nginx
40041 www-data 20 0 72968 11m 1940 R 0 0.1 0:01.87 nginx
40042 www-data 20 0 72968 11m 1928 R 0 0.1 0:03.00 nginx
40043 www-data 20 0 72968 11m 1948 R 0 0.1 0:02.97 nginx
40045 www-data 20 0 72968 11m 1944 S 0 0.1 0:02.72 nginx
40046 www-data 20 0 72968 11m 1936 S 0 0.1 0:02.87 nginx
40049 www-data 20 0 72968 11m 1928 S 0 0.1 0:01.80 nginx
40226 root 20 0 10612 1348 1136 S 0 0.0 0:00.00 bash
40238 tn 20 0 36888 1236 968 S 0 0.0 0:00.00 su
40245 tn 20 0 10592 1304 1112 S 0 0.0 0:00.00 bash
40249 tn 20 0 255m 46m 9168 S 0 0.6 0:08.76 php
40439 root 20 0 10612 1344 1136 S 0 0.0 0:00.00 bash
40442 tn 20 0 36888 1232 968 S 0 0.0 0:00.18 su
40474 tn 20 0 10592 1304 1112 S 0 0.0 0:00.27 bash
40526 tn 20 0 252m 44m 9156 S 0 0.5 0:07.16 php
41328 tn 20 0 3956 580 484 S 0 0.0 0:00.00 sh
41540 tn 20 0 3956 576 484 S 0 0.0 0:00.05 sh
41644 nobody 20 0 0 0 0 Z 0 0.0 0:00.18 phpfpm_st <defunct>
41911 root 20 0 5368 568 480 S 0 0.0 0:00.00 sleep
41913 root 20 0 5368 560 480 S 0 0.0 0:00.00 sleep
41914 root 20 0 18320 2296 1624 S 0 0.0 0:00.01 perl
41972 www-data 20 0 72968 9424 504 R 0 0.1 0:00.00 nginx
41985 www-data 20 0 72968 9424 504 R 0 0.1 0:00.00 nginx
41986 www-data 20 0 72968 9424 504 R 0 0.1 0:00.00 nginx
41988 www-data 20 0 72968 9424 504 R 0 0.1 0:00.00 nginx
41993 www-data 20 0 72968 9424 504 R 0 0.1 0:00.00 nginx
41994 www-data 20 0 72968 9424 504 R 0 0.1 0:00.00 nginx
41995 www-data 20 0 72968 9424 504 R 0 0.1 0:00.00 nginx
41997 root 20 0 3956 608 492 S 0 0.0 0:00.00 newrelic-daemon
42005 www-data 20 0 72968 9424 504 S 0 0.1 0:00.00 nginx
42007 www-data 20 0 72968 9424 504 S 0 0.1 0:00.00 nginx
42008 www-data 20 0 72968 9424 504 S 0 0.1 0:00.00 nginx
42013 www-data 20 0 72968 9424 504 S 0 0.1 0:00.00 nginx
42020 www-data 20 0 72968 9424 504 S 0 0.1 0:00.00 nginx
42022 www-data 20 0 72968 9424 504 S 0 0.1 0:00.00 nginx
42025 www-data 20 0 72968 9424 504 S 0 0.1 0:00.00 nginx
42026 www-data 20 0 72968 9424 504 S 0 0.1 0:00.00 nginx
42028 www-data 20 0 72968 9424 504 S 0 0.1 0:00.00 nginx
42031 www-data 20 0 72968 9424 504 S 0 0.1 0:00.00 nginx
42036 www-data 20 0 72968 9424 504 S 0 0.1 0:00.00 nginx
42039 www-data 20 0 72968 9424 504 S 0 0.1 0:00.00 nginx
42041 www-data 20 0 72968 9424 504 S 0 0.1 0:00.00 nginx
42044 www-data 20 0 72968 9424 504 S 0 0.1 0:00.00 nginx
42045 www-data 20 0 72968 9424 504 S 0 0.1 0:00.00 nginx
42046 www-data 20 0 72968 9424 504 S 0 0.1 0:00.00 nginx
42047 www-data 20 0 72968 9424 504 S 0 0.1 0:00.00 nginx
42048 www-data 20 0 72968 9424 504 S 0 0.1 0:00.00 nginx
42050 www-data 20 0 72968 9424 504 S 0 0.1 0:00.00 nginx
42055 www-data 20 0 72968 9424 504 S 0 0.1 0:00.00 nginx
42056 www-data 20 0 72968 9424 504 S 0 0.1 0:00.00 nginx
42057 www-data 20 0 72968 9436 516 S 0 0.1 0:00.00 nginx
42060 root 20 0 3872 500 416 S 0 0.0 0:00.00 sleep
42062 root 20 0 5368 564 480 S 0 0.0 0:00.00 sleep
42066 root 20 0 10624 528 304 S 0 0.0 0:00.00 bash
42069 root 20 0 39852 2380 1860 R 0 0.0 0:00.00 mysqladmin
42071 root 20 0 10376 912 768 S 0 0.0 0:00.00 awk
42072 root 20 0 7552 820 704 S 0 0.0 0:00.00 grep
42073 root 20 0 10376 916 768 S 0 0.0 0:00.00 awk
44174 ntp 20 0 38340 2180 1592 S 0 0.0 2:01.49 ntpd
45625 root 20 0 10352 1596 876 S 0 0.0 0:00.04 man
45719 root 20 0 9884 992 800 S 0 0.0 0:00.05 pager
====================
comment:97 Changed 3 years ago by chris
- Add Hours to Ticket changed from 0.0 to 0.1
- Total Hours changed from 40.18 to 40.28
The load spiked up to 70, the following has been written to /var/log/high-load.log since the above was added:
====================
nginx high load on
ONEX_LOAD = 1000
FIVX_LOAD = 527
uptime :
13:56:21 up 11 days, 4:40, 2 users, load average: 32.23, 10.49, 4.28
vmstat :
8175 M total memory
7352 M used memory
4637 M active memory
2035 M inactive memory
822 M free memory
702 M buffer memory
2943 M swap cache
1023 M total swap
0 M used swap
1023 M free swap
30507990 non-nice user cpu ticks
15 nice user cpu ticks
45545416 system cpu ticks
2536353958 idle cpu ticks
4714177 IO-wait cpu ticks
536 IRQ cpu ticks
647216 softirq cpu ticks
6359171 stolen cpu ticks
7042505 pages paged in
363318888 pages paged out
0 pages swapped in
0 pages swapped out
1029974210 interrupts
789452439 CPU context switches
1379837755 boot time
20691756 forks
disk- ------------reads------------ ------------writes----------- -----IO------
total merged sectors ms total merged sectors ms cur sec
xvda2 391625 2507 13674530 2078048 17916830 49812579 726637776 954473156 0 29479
xvda1 26909 24402 410488 114452 0 0 0 0 0 19
top :
top - 13:56:21 up 11 days, 4:40, 2 users, load average: 32.23, 10.49, 4.28
Tasks: 325 total, 23 running, 297 sleeping, 0 stopped, 5 zombie
Cpu0 : 2.6%us, 2.4%sy, 0.0%ni, 92.2%id, 2.2%wa, 0.0%hi, 0.3%si, 0.3%st
Cpu1 : 1.7%us, 2.3%sy, 0.0%ni, 95.6%id, 0.1%wa, 0.0%hi, 0.0%si, 0.3%st
Cpu2 : 1.7%us, 2.2%sy, 0.0%ni, 95.8%id, 0.0%wa, 0.0%hi, 0.0%si, 0.2%st
Cpu3 : 1.3%us, 1.9%sy, 0.0%ni, 96.6%id, 0.0%wa, 0.0%hi, 0.0%si, 0.2%st
Cpu4 : 1.2%us, 1.8%sy, 0.0%ni, 96.7%id, 0.0%wa, 0.0%hi, 0.0%si, 0.2%st
Cpu5 : 1.0%us, 1.7%sy, 0.0%ni, 97.1%id, 0.0%wa, 0.0%hi, 0.0%si, 0.2%st
Cpu6 : 0.9%us, 1.6%sy, 0.0%ni, 97.2%id, 0.0%wa, 0.0%hi, 0.0%si, 0.2%st
Cpu7 : 0.9%us, 1.6%sy, 0.0%ni, 97.3%id, 0.0%wa, 0.0%hi, 0.0%si, 0.2%st
Cpu8 : 0.9%us, 1.5%sy, 0.0%ni, 97.3%id, 0.0%wa, 0.0%hi, 0.0%si, 0.2%st
Cpu9 : 0.8%us, 1.5%sy, 0.0%ni, 97.4%id, 0.0%wa, 0.0%hi, 0.0%si, 0.2%st
Cpu10 : 0.8%us, 1.5%sy, 0.0%ni, 97.4%id, 0.0%wa, 0.0%hi, 0.0%si, 0.2%st
Cpu11 : 0.8%us, 1.5%sy, 0.0%ni, 97.5%id, 0.0%wa, 0.0%hi, 0.0%si, 0.2%st
Cpu12 : 0.8%us, 1.4%sy, 0.0%ni, 97.5%id, 0.0%wa, 0.0%hi, 0.0%si, 0.2%st
Cpu13 : 0.8%us, 1.4%sy, 0.0%ni, 97.5%id, 0.0%wa, 0.0%hi, 0.0%si, 0.2%st
Mem: 8372060k total, 7502616k used, 869444k free, 718960k buffers
Swap: 1048568k total, 0k used, 1048568k free, 3014180k cached
PID USER PR NI VIRT RES SHR S %CPU %MEM TIME+ COMMAND
30588 www-data 20 0 770m 90m 50m R 65 1.1 2:10.47 php-fpm
30579 www-data 20 0 765m 87m 52m S 55 1.1 2:11.09 php-fpm
30584 www-data 20 0 771m 94m 54m S 53 1.2 2:12.63 php-fpm
55858 www-data 20 0 739m 17m 7864 R 53 0.2 0:01.64 php-fpm
30575 www-data 20 0 758m 80m 52m R 52 1.0 2:04.57 php-fpm
40034 www-data 20 0 775m 96m 51m R 52 1.2 1:47.48 php-fpm
39927 www-data 20 0 759m 80m 51m R 50 1.0 1:49.42 php-fpm
30585 www-data 20 0 759m 81m 52m R 46 1.0 1:54.97 php-fpm
30581 www-data 20 0 761m 83m 53m R 45 1.0 2:04.42 php-fpm
39848 www-data 20 0 775m 96m 51m R 45 1.2 1:56.80 php-fpm
30587 www-data 20 0 760m 86m 57m R 43 1.1 2:04.33 php-fpm
30589 www-data 20 0 794m 117m 53m R 43 1.4 2:04.99 php-fpm
30577 www-data 20 0 770m 88m 49m R 40 1.1 2:06.27 php-fpm
39831 www-data 20 0 771m 92m 51m R 40 1.1 2:16.28 php-fpm
30573 www-data 20 0 785m 113m 58m R 38 1.4 1:58.50 php-fpm
30578 www-data 20 0 761m 82m 52m R 38 1.0 2:30.05 php-fpm
55854 www-data 20 0 739m 18m 8012 R 38 0.2 0:01.36 php-fpm
30576 www-data 20 0 773m 94m 52m R 36 1.2 1:40.62 php-fpm
30582 www-data 20 0 772m 95m 54m R 34 1.2 1:58.82 php-fpm
30586 www-data 20 0 772m 93m 51m R 34 1.1 2:10.08 php-fpm
55977 www-data 20 0 739m 17m 7872 R 34 0.2 0:00.25 php-fpm
55857 www-data 20 0 739m 18m 8068 R 29 0.2 0:01.28 php-fpm
26795 root 20 0 72952 10m 1764 S 28 0.1 0:08.25 nginx
49887 www-data 20 0 73000 10m 1944 S 21 0.1 0:13.44 nginx
4125 mysql 20 0 2782m 2.0g 10m S 7 25.3 147:23.31 mysqld
55383 root 20 0 41872 8016 1080 S 7 0.1 0:06.21 munin-node
56011 root 20 0 19200 1396 912 R 5 0.0 0:00.05 top
56252 nobody 20 0 22244 3616 1792 R 5 0.0 0:00.03 diskstats
55193 root 20 0 10752 1584 1228 S 3 0.0 0:02.34 bash
55650 root 20 0 10752 1588 1228 S 3 0.0 0:08.28 bash
56049 root 20 0 18320 2296 1624 S 3 0.0 0:00.02 perl
58401 redis 20 0 475m 79m 928 R 3 1.0 5:29.48 redis-server
5897 root 20 0 117m 1676 1068 S 2 0.0 2:46.25 rsyslogd
49896 www-data 20 0 73000 10m 1944 S 2 0.1 0:05.12 nginx
49897 www-data 20 0 73000 10m 1896 S 2 0.1 0:00.45 nginx
49901 www-data 20 0 73000 10m 1928 S 2 0.1 0:01.14 nginx
49906 www-data 20 0 73000 10m 1936 S 2 0.1 0:00.81 nginx
49907 www-data 20 0 73000 10m 1916 S 2 0.1 0:14.72 nginx
55910 root 20 0 10624 1368 1144 S 2 0.0 0:00.01 bash
56105 postfix 20 0 39340 2524 2004 S 2 0.0 0:00.01 cleanup
56149 postfix 20 0 39500 3080 2336 S 2 0.0 0:00.01 local
56164 postfix 20 0 39500 2940 2224 S 2 0.0 0:00.01 local
1 root 20 0 8356 768 636 S 0 0.0 0:56.02 init
2 root 20 0 0 0 0 S 0 0.0 0:00.02 kthreadd
3 root RT 0 0 0 0 S 0 0.0 1:13.87 migration/0
4 root 20 0 0 0 0 S 0 0.0 0:55.23 ksoftirqd/0
5 root RT 0 0 0 0 S 0 0.0 0:00.00 watchdog/0
6 root RT 0 0 0 0 S 0 0.0 1:17.61 migration/1
7 root 20 0 0 0 0 S 0 0.0 1:25.39 ksoftirqd/1
8 root RT 0 0 0 0 S 0 0.0 0:00.00 watchdog/1
9 root RT 0 0 0 0 S 0 0.0 1:07.32 migration/2
10 root 20 0 0 0 0 S 0 0.0 1:19.50 ksoftirqd/2
11 root RT 0 0 0 0 S 0 0.0 0:00.00 watchdog/2
12 root RT 0 0 0 0 S 0 0.0 1:09.32 migration/3
13 root 20 0 0 0 0 S 0 0.0 1:45.18 ksoftirqd/3
14 root RT 0 0 0 0 S 0 0.0 0:00.00 watchdog/3
15 root RT 0 0 0 0 S 0 0.0 1:06.28 migration/4
16 root 20 0 0 0 0 S 0 0.0 1:38.55 ksoftirqd/4
17 root RT 0 0 0 0 S 0 0.0 0:00.00 watchdog/4
18 root RT 0 0 0 0 S 0 0.0 1:07.12 migration/5
19 root 20 0 0 0 0 S 0 0.0 1:47.44 ksoftirqd/5
20 root RT 0 0 0 0 S 0 0.0 0:00.00 watchdog/5
21 root RT 0 0 0 0 S 0 0.0 1:08.42 migration/6
22 root 20 0 0 0 0 S 0 0.0 1:37.52 ksoftirqd/6
23 root RT 0 0 0 0 S 0 0.0 0:00.02 watchdog/6
24 root RT 0 0 0 0 S 0 0.0 1:01.27 migration/7
25 root 20 0 0 0 0 S 0 0.0 1:41.68 ksoftirqd/7
26 root RT 0 0 0 0 S 0 0.0 0:00.00 watchdog/7
27 root RT 0 0 0 0 S 0 0.0 1:03.10 migration/8
28 root 20 0 0 0 0 S 0 0.0 1:40.43 ksoftirqd/8
29 root RT 0 0 0 0 S 0 0.0 0:00.00 watchdog/8
30 root RT 0 0 0 0 S 0 0.0 1:06.53 migration/9
31 root 20 0 0 0 0 S 0 0.0 1:42.21 ksoftirqd/9
32 root RT 0 0 0 0 S 0 0.0 0:00.01 watchdog/9
33 root RT 0 0 0 0 S 0 0.0 1:05.54 migration/10
34 root 20 0 0 0 0 S 0 0.0 1:53.28 ksoftirqd/10
35 root RT 0 0 0 0 S 0 0.0 0:00.00 watchdog/10
36 root RT 0 0 0 0 S 0 0.0 1:03.77 migration/11
37 root 20 0 0 0 0 S 0 0.0 1:41.66 ksoftirqd/11
38 root RT 0 0 0 0 S 0 0.0 0:00.00 watchdog/11
39 root RT 0 0 0 0 S 0 0.0 1:04.98 migration/12
40 root 20 0 0 0 0 S 0 0.0 1:28.28 ksoftirqd/12
41 root RT 0 0 0 0 S 0 0.0 0:00.03 watchdog/12
42 root RT 0 0 0 0 S 0 0.0 1:08.80 migration/13
43 root 20 0 0 0 0 S 0 0.0 0:20.57 ksoftirqd/13
44 root RT 0 0 0 0 S 0 0.0 0:00.00 watchdog/13
45 root 20 0 0 0 0 S 0 0.0 0:15.28 events/0
46 root 20 0 0 0 0 S 0 0.0 0:17.31 events/1
47 root 20 0 0 0 0 S 0 0.0 0:15.72 events/2
48 root 20 0 0 0 0 S 0 0.0 0:13.02 events/3
49 root 20 0 0 0 0 S 0 0.0 0:14.59 events/4
50 root 20 0 0 0 0 S 0 0.0 0:18.14 events/5
51 root 20 0 0 0 0 S 0 0.0 0:13.82 events/6
52 root 20 0 0 0 0 S 0 0.0 0:14.09 events/7
53 root 20 0 0 0 0 S 0 0.0 0:14.16 events/8
54 root 20 0 0 0 0 S 0 0.0 0:13.43 events/9
55 root 20 0 0 0 0 S 0 0.0 0:10.98 events/10
56 root 20 0 0 0 0 S 0 0.0 0:11.46 events/11
57 root 20 0 0 0 0 S 0 0.0 0:14.47 events/12
58 root 20 0 0 0 0 S 0 0.0 0:18.77 events/13
59 root 20 0 0 0 0 S 0 0.0 0:00.00 cpuset
60 root 20 0 0 0 0 S 0 0.0 0:00.00 khelper
61 root 20 0 0 0 0 S 0 0.0 0:00.00 netns
62 root 20 0 0 0 0 S 0 0.0 0:00.00 async/mgr
63 root 20 0 0 0 0 S 0 0.0 0:00.00 pm
64 root 20 0 0 0 0 S 0 0.0 0:00.00 xenwatch
65 root 20 0 0 0 0 S 0 0.0 0:00.00 xenbus
66 root 20 0 0 0 0 S 0 0.0 0:02.12 sync_supers
67 root 20 0 0 0 0 S 0 0.0 0:12.14 bdi-default
68 root 20 0 0 0 0 S 0 0.0 0:00.00 kintegrityd/0
69 root 20 0 0 0 0 S 0 0.0 0:00.00 kintegrityd/1
70 root 20 0 0 0 0 S 0 0.0 0:00.00 kintegrityd/2
71 root 20 0 0 0 0 S 0 0.0 0:00.00 kintegrityd/3
72 root 20 0 0 0 0 S 0 0.0 0:00.00 kintegrityd/4
73 root 20 0 0 0 0 S 0 0.0 0:00.00 kintegrityd/5
74 root 20 0 0 0 0 S 0 0.0 0:00.00 kintegrityd/6
75 root 20 0 0 0 0 S 0 0.0 0:00.00 kintegrityd/7
76 root 20 0 0 0 0 S 0 0.0 0:00.00 kintegrityd/8
77 root 20 0 0 0 0 S 0 0.0 0:00.00 kintegrityd/9
78 root 20 0 0 0 0 S 0 0.0 0:00.00 kintegrityd/10
79 root 20 0 0 0 0 S 0 0.0 0:00.00 kintegrityd/11
80 root 20 0 0 0 0 S 0 0.0 0:00.00 kintegrityd/12
81 root 20 0 0 0 0 S 0 0.0 0:00.00 kintegrityd/13
82 root 20 0 0 0 0 S 0 0.0 0:11.51 kblockd/0
83 root 20 0 0 0 0 S 0 0.0 0:00.03 kblockd/1
84 root 20 0 0 0 0 S 0 0.0 0:00.01 kblockd/2
85 root 20 0 0 0 0 S 0 0.0 0:00.01 kblockd/3
86 root 20 0 0 0 0 S 0 0.0 0:00.00 kblockd/4
87 root 20 0 0 0 0 S 0 0.0 0:00.00 kblockd/5
88 root 20 0 0 0 0 S 0 0.0 0:00.00 kblockd/6
89 root 20 0 0 0 0 S 0 0.0 0:00.00 kblockd/7
90 root 20 0 0 0 0 S 0 0.0 0:00.00 kblockd/8
91 root 20 0 0 0 0 S 0 0.0 0:00.00 kblockd/9
92 root 20 0 0 0 0 S 0 0.0 0:00.00 kblockd/10
93 root 20 0 0 0 0 S 0 0.0 0:00.00 kblockd/11
94 root 20 0 0 0 0 S 0 0.0 0:00.00 kblockd/12
95 root 20 0 0 0 0 S 0 0.0 0:00.00 kblockd/13
96 root 20 0 0 0 0 S 0 0.0 0:00.00 kseriod
111 root 20 0 0 0 0 S 0 0.0 0:00.00 kondemand/0
112 root 20 0 0 0 0 S 0 0.0 0:00.00 kondemand/1
113 root 20 0 0 0 0 S 0 0.0 0:00.00 kondemand/2
114 root 20 0 0 0 0 S 0 0.0 0:00.00 kondemand/3
115 root 20 0 0 0 0 S 0 0.0 0:00.00 kondemand/4
116 root 20 0 0 0 0 S 0 0.0 0:00.00 kondemand/5
117 root 20 0 0 0 0 S 0 0.0 0:00.00 kondemand/6
118 root 20 0 0 0 0 S 0 0.0 0:00.00 kondemand/7
119 root 20 0 0 0 0 S 0 0.0 0:00.00 kondemand/8
120 root 20 0 0 0 0 S 0 0.0 0:00.00 kondemand/9
121 root 20 0 0 0 0 S 0 0.0 0:00.00 kondemand/10
122 root 20 0 0 0 0 S 0 0.0 0:00.00 kondemand/11
123 root 20 0 0 0 0 S 0 0.0 0:00.00 kondemand/12
124 root 20 0 0 0 0 S 0 0.0 0:00.00 kondemand/13
125 root 20 0 0 0 0 S 0 0.0 0:00.66 khungtaskd
126 root 20 0 0 0 0 S 0 0.0 0:04.11 kswapd0
127 root 25 5 0 0 0 S 0 0.0 0:00.00 ksmd
128 root 20 0 0 0 0 S 0 0.0 0:00.00 aio/0
129 root 20 0 0 0 0 S 0 0.0 0:00.00 aio/1
130 root 20 0 0 0 0 S 0 0.0 0:00.00 aio/2
131 root 20 0 0 0 0 S 0 0.0 0:00.00 aio/3
132 root 20 0 0 0 0 S 0 0.0 0:00.00 aio/4
133 root 20 0 0 0 0 S 0 0.0 0:00.00 aio/5
134 root 20 0 0 0 0 S 0 0.0 0:00.00 aio/6
135 root 20 0 0 0 0 S 0 0.0 0:00.00 aio/7
136 root 20 0 0 0 0 S 0 0.0 0:00.00 aio/8
137 root 20 0 0 0 0 S 0 0.0 0:00.00 aio/9
138 root 20 0 0 0 0 S 0 0.0 0:00.00 aio/10
139 root 20 0 0 0 0 S 0 0.0 0:00.00 aio/11
140 root 20 0 0 0 0 S 0 0.0 0:00.00 aio/12
141 root 20 0 0 0 0 S 0 0.0 0:00.00 aio/13
142 root 20 0 0 0 0 S 0 0.0 0:00.00 crypto/0
143 root 20 0 0 0 0 S 0 0.0 0:00.00 crypto/1
144 root 20 0 0 0 0 S 0 0.0 0:00.00 crypto/2
145 root 20 0 0 0 0 S 0 0.0 0:00.00 crypto/3
146 root 20 0 0 0 0 S 0 0.0 0:00.00 crypto/4
147 root 20 0 0 0 0 S 0 0.0 0:00.00 crypto/5
148 root 20 0 0 0 0 S 0 0.0 0:00.00 crypto/6
149 root 20 0 0 0 0 S 0 0.0 0:00.00 crypto/7
150 root 20 0 0 0 0 S 0 0.0 0:00.00 crypto/8
151 root 20 0 0 0 0 S 0 0.0 0:00.00 crypto/9
152 root 20 0 0 0 0 S 0 0.0 0:00.00 crypto/10
153 root 20 0 0 0 0 S 0 0.0 0:00.00 crypto/11
154 root 20 0 0 0 0 S 0 0.0 0:00.00 crypto/12
155 root 20 0 0 0 0 S 0 0.0 0:00.00 crypto/13
158 root 20 0 0 0 0 S 0 0.0 0:00.00 khvcd
211 root 20 0 0 0 0 S 0 0.0 0:00.00 kstriped
220 root 20 0 0 0 0 S 0 0.0 3:12.40 kjournald
266 root 16 -4 16744 744 372 S 0 0.0 0:00.21 udevd
304 root 18 -2 16740 724 348 S 0 0.0 0:01.55 udevd
368 root 20 0 0 0 0 S 0 0.0 0:59.54 flush-202:2
720 root 20 0 6468 604 480 S 0 0.0 11:19.83 vnstatd
745 root 20 0 0 0 0 S 0 0.0 0:00.00 kauditd
3233 root 20 0 19164 1716 1332 S 0 0.0 0:00.25 mysqld_safe
4126 root 20 0 5352 688 584 S 0 0.0 0:00.02 logger
4581 root 20 0 49176 1140 584 S 0 0.0 0:05.97 sshd
4708 root 16 -4 45180 964 612 S 0 0.0 0:00.31 auditd
4710 root 12 -8 14296 780 648 S 0 0.0 0:00.73 audispd
4739 root 20 0 22432 1060 796 S 0 0.0 8:11.61 cron
5961 daemon 20 0 18716 448 284 S 0 0.0 0:00.01 atd
5987 pdnsd 20 0 207m 1984 632 S 0 0.0 2:56.16 pdnsd
6010 messageb 20 0 23268 788 564 S 0 0.0 0:00.01 dbus-daemon
6631 root 20 0 70480 3184 2492 S 0 0.0 0:00.03 sshd
6979 chris 20 0 70480 1584 876 S 0 0.0 0:00.53 sshd
6980 chris 20 0 25736 8528 1544 S 0 0.1 0:00.59 bash
7542 root 20 0 24572 1244 992 S 0 0.0 0:00.00 sudo
7543 root 20 0 22156 5040 1636 S 0 0.1 0:01.15 bash
7621 root 20 0 41872 8756 1820 S 0 0.1 2:24.60 munin-node
7651 root 20 0 5932 612 516 S 0 0.0 0:00.00 getty
9389 root 20 0 37176 2384 1868 S 0 0.0 2:09.38 master
9393 postfix 20 0 39472 2644 1984 S 0 0.0 0:19.11 qmgr
9394 root 20 0 28712 1736 1224 S 0 0.0 0:02.12 pure-ftpd
13773 root 20 0 56612 17m 1544 S 0 0.2 10:28.80 lfd
14843 postfix 20 0 39240 2420 1912 S 0 0.0 0:00.02 pickup
18931 postfix 20 0 42176 3708 2440 S 0 0.0 0:11.17 tlsmgr
20232 root 18 -2 16740 596 228 S 0 0.0 0:00.00 udevd
30567 root 20 0 734m 7040 1888 S 0 0.1 0:04.30 php-fpm
39671 root 20 0 70480 3180 2492 S 0 0.0 0:00.02 sshd
39758 chris 20 0 70480 1580 876 S 0 0.0 0:00.13 sshd
39759 chris 20 0 25736 8524 1544 S 0 0.1 0:00.54 bash
39800 root 20 0 24572 1244 992 S 0 0.0 0:00.00 sudo
39801 root 20 0 22104 4920 1568 S 0 0.1 0:00.33 bash
44174 ntp 20 0 38340 2180 1592 S 0 0.0 2:05.58 ntpd
45625 root 20 0 10352 1596 876 S 0 0.0 0:00.04 man
45719 root 20 0 9884 992 800 S 0 0.0 0:00.05 pager
48232 root 20 0 32992 4572 2080 S 0 0.1 0:00.06 vi
49873 www-data 20 0 73000 10m 1940 S 0 0.1 0:00.91 nginx
49874 www-data 20 0 73000 10m 1944 S 0 0.1 0:13.47 nginx
49876 www-data 20 0 73000 10m 1920 S 0 0.1 0:00.50 nginx
49878 www-data 20 0 73000 10m 1896 S 0 0.1 0:00.96 nginx
49880 www-data 20 0 73000 10m 1964 S 0 0.1 0:04.36 nginx
49884 www-data 20 0 73000 10m 1960 S 0 0.1 0:01.18 nginx
49888 www-data 20 0 73000 10m 1940 S 0 0.1 0:00.99 nginx
49889 www-data 20 0 73000 10m 1936 S 0 0.1 0:00.79 nginx
49890 www-data 20 0 73000 10m 1920 S 0 0.1 0:02.53 nginx
49891 www-data 20 0 73000 10m 1924 S 0 0.1 0:00.78 nginx
49892 www-data 20 0 73000 10m 1924 S 0 0.1 0:00.74 nginx
49893 www-data 20 0 73000 10m 1920 S 0 0.1 0:03.38 nginx
49894 www-data 20 0 73000 10m 1920 S 0 0.1 0:04.42 nginx
49898 www-data 20 0 73000 10m 1924 S 0 0.1 0:08.21 nginx
49899 www-data 20 0 73000 10m 1916 S 0 0.1 0:00.57 nginx
49900 www-data 20 0 73000 10m 1924 S 0 0.1 0:00.78 nginx
49902 www-data 20 0 73000 10m 1932 S 0 0.1 0:01.13 nginx
49903 www-data 20 0 73000 10m 1936 S 0 0.1 0:01.09 nginx
49904 www-data 20 0 73000 10m 1924 S 0 0.1 0:05.91 nginx
49905 www-data 20 0 73000 10m 1960 S 0 0.1 0:10.76 nginx
49908 www-data 20 0 73000 10m 1932 S 0 0.1 0:01.19 nginx
49909 www-data 20 0 73000 10m 1936 S 0 0.1 0:17.92 nginx
49910 www-data 20 0 73000 9488 568 S 0 0.1 0:09.91 nginx
55173 root 20 0 32812 1080 776 S 0 0.0 0:00.00 cron
55177 root 20 0 32812 1080 776 S 0 0.0 0:00.00 cron
55179 root 20 0 32812 1080 776 S 0 0.0 0:00.00 cron
55184 root 20 0 3956 576 484 S 0 0.0 0:00.00 sh
55188 root 20 0 3956 580 484 S 0 0.0 0:00.00 sh
55190 root 20 0 3956 576 484 S 0 0.0 0:00.00 sh
55195 root 20 0 10620 1364 1148 S 0 0.0 0:04.04 bash
55197 root 20 0 10660 1416 1156 S 0 0.0 0:06.56 bash
55225 root 20 0 32812 1080 776 S 0 0.0 0:00.00 cron
55226 root 20 0 32812 1080 776 S 0 0.0 0:00.01 cron
55230 root 20 0 3956 580 484 S 0 0.0 0:00.09 sh
55233 root 20 0 3956 576 484 S 0 0.0 0:00.10 sh
55239 root 20 0 10620 1368 1148 S 0 0.0 0:04.06 bash
55243 root 20 0 10672 1432 1168 S 0 0.0 0:08.08 bash
55632 root 20 0 32812 1080 776 S 0 0.0 0:00.00 cron
55635 root 20 0 32812 1080 776 S 0 0.0 0:00.00 cron
55636 root 20 0 32812 1080 776 S 0 0.0 0:00.00 cron
55643 root 20 0 3956 580 484 S 0 0.0 0:00.00 sh
55645 root 20 0 3956 576 484 S 0 0.0 0:00.00 sh
55646 root 20 0 3956 580 484 S 0 0.0 0:00.03 sh
55654 root 20 0 10620 1368 1148 S 0 0.0 0:01.03 bash
55677 root 20 0 10660 1416 1156 S 0 0.0 0:00.04 bash
55709 root 20 0 18320 2296 1624 S 0 0.0 0:00.06 perl
55737 root 20 0 3956 612 492 S 0 0.0 0:00.15 newrelic-daemon
55774 nobody 20 0 0 0 0 Z 0 0.0 0:07.09 df_inode <defunct>
55802 root 20 0 0 0 0 Z 0 0.0 0:04.78 mysql_que <defunct>
55830 root 20 0 0 0 0 Z 0 0.0 0:04.67 mysql_que <defunct>
55853 nobody 20 0 0 0 0 Z 0 0.0 0:02.80 nginx_req <defunct>
55864 nobody 20 0 0 0 0 Z 0 0.0 0:05.41 nginx_req <defunct>
55868 root 20 0 18320 2304 1624 S 0 0.0 0:04.59 perl
55890 root 20 0 32812 1080 776 S 0 0.0 0:00.00 cron
55897 root 20 0 32812 1080 776 S 0 0.0 0:00.00 cron
55898 root 20 0 32812 1080 776 S 0 0.0 0:00.00 cron
55903 root 20 0 3872 500 416 S 0 0.0 0:00.00 sleep
55906 root 20 0 3956 580 484 S 0 0.0 0:00.00 sh
55915 root 20 0 3956 580 484 S 0 0.0 0:00.00 sh
55916 root 20 0 5368 564 480 S 0 0.0 0:00.00 sleep
55932 root 20 0 10644 1356 1116 S 0 0.0 0:00.00 bash
55936 root 20 0 3956 576 484 S 0 0.0 0:00.00 sh
55946 root 20 0 10660 1416 1156 S 0 0.0 0:00.01 bash
55950 root 20 0 5368 560 480 S 0 0.0 0:00.00 sleep
56044 root 20 0 3956 612 492 S 0 0.0 0:00.00 newrelic-daemon
56125 root 20 0 5368 564 480 S 0 0.0 0:00.00 sleep
56129 www-data 20 0 72952 9404 476 S 0 0.1 0:00.00 nginx
56130 www-data 20 0 72952 9404 476 S 0 0.1 0:00.00 nginx
56132 root 20 0 5368 568 480 S 0 0.0 0:00.00 sleep
56134 www-data 20 0 72952 9404 476 S 0 0.1 0:00.00 nginx
56136 postfix 20 0 39252 2400 1908 S 0 0.0 0:00.00 trivial-rewrite
56139 www-data 20 0 72952 9404 476 S 0 0.1 0:00.00 nginx
56146 www-data 20 0 72952 9404 476 S 0 0.1 0:00.00 nginx
56147 root 20 0 3872 500 416 S 0 0.0 0:00.00 sleep
56148 www-data 20 0 72952 9404 476 S 0 0.1 0:00.00 nginx
56155 www-data 20 0 72952 9404 476 S 0 0.1 0:00.00 nginx
56158 www-data 20 0 72952 9404 476 S 0 0.1 0:00.00 nginx
56166 www-data 20 0 72952 9404 476 S 0 0.1 0:00.00 nginx
56169 www-data 20 0 72952 9404 476 S 0 0.1 0:00.00 nginx
56174 www-data 20 0 72952 9404 476 S 0 0.1 0:00.00 nginx
56177 www-data 20 0 72952 9404 476 S 0 0.1 0:00.00 nginx
56178 root 20 0 3956 612 492 S 0 0.0 0:00.00 newrelic-daemon
56185 www-data 20 0 72952 9404 476 S 0 0.1 0:00.00 nginx
56190 www-data 20 0 72952 9404 476 S 0 0.1 0:00.00 nginx
56193 www-data 20 0 72952 9404 476 S 0 0.1 0:00.00 nginx
56196 www-data 20 0 72952 9404 476 S 0 0.1 0:00.00 nginx
56209 www-data 20 0 72952 9404 476 S 0 0.1 0:00.00 nginx
56211 www-data 20 0 72952 9404 476 S 0 0.1 0:00.00 nginx
56216 www-data 20 0 72952 9404 476 S 0 0.1 0:00.00 nginx
56219 www-data 20 0 72952 9404 476 S 0 0.1 0:00.00 nginx
56221 www-data 20 0 72952 9404 476 S 0 0.1 0:00.00 nginx
56229 www-data 20 0 72952 9404 476 S 0 0.1 0:00.00 nginx
56232 www-data 20 0 72952 9404 476 S 0 0.1 0:00.00 nginx
56238 www-data 20 0 72952 9404 476 S 0 0.1 0:00.00 nginx
56244 www-data 20 0 72952 9404 476 S 0 0.1 0:00.00 nginx
56246 www-data 20 0 72952 9404 476 S 0 0.1 0:00.00 nginx
56249 www-data 20 0 72952 9404 476 S 0 0.1 0:00.00 nginx
56250 root 20 0 3872 500 416 S 0 0.0 0:00.00 sleep
56254 www-data 20 0 72952 9404 476 S 0 0.1 0:00.00 nginx
56256 www-data 20 0 72952 9400 472 S 0 0.1 0:00.00 nginx
56269 root 20 0 10624 532 304 S 0 0.0 0:00.00 bash
====================
And:
====================
nginx high load on
ONEX_LOAD = 2348
FIVX_LOAD = 830
uptime :
14:08:33 up 11 days, 4:53, 2 users, load average: 38.70, 14.25, 6.83
vmstat :
8175 M total memory
7214 M used memory
4514 M active memory
2026 M inactive memory
961 M free memory
702 M buffer memory
2949 M swap cache
1023 M total swap
0 M used swap
1023 M free swap
30545673 non-nice user cpu ticks
15 nice user cpu ticks
45732405 system cpu ticks
2538005325 idle cpu ticks
4718092 IO-wait cpu ticks
536 IRQ cpu ticks
647908 softirq cpu ticks
6407733 stolen cpu ticks
7046089 pages paged in
363616780 pages paged out
0 pages swapped in
0 pages swapped out
1031704229 interrupts
790432564 CPU context switches
1379837710 boot time
20727741 forks
disk- ------------reads------------ ------------writes----------- -----IO------
total merged sectors ms total merged sectors ms cur sec
xvda2 391902 2507 13681690 2079772 17933984 49837492 727233752 954914288 0 29503
xvda1 26909 24402 410488 114452 0 0 0 0 0 19
top :
top - 14:08:34 up 11 days, 4:53, 2 users, load average: 38.70, 14.25, 6.83
Tasks: 301 total, 27 running, 274 sleeping, 0 stopped, 0 zombie
Cpu0 : 2.6%us, 2.4%sy, 0.0%ni, 92.2%id, 2.2%wa, 0.0%hi, 0.3%si, 0.3%st
Cpu1 : 1.7%us, 2.3%sy, 0.0%ni, 95.6%id, 0.1%wa, 0.0%hi, 0.0%si, 0.3%st
Cpu2 : 1.7%us, 2.2%sy, 0.0%ni, 95.8%id, 0.0%wa, 0.0%hi, 0.0%si, 0.2%st
Cpu3 : 1.3%us, 1.9%sy, 0.0%ni, 96.6%id, 0.0%wa, 0.0%hi, 0.0%si, 0.2%st
Cpu4 : 1.2%us, 1.8%sy, 0.0%ni, 96.7%id, 0.0%wa, 0.0%hi, 0.0%si, 0.2%st
Cpu5 : 1.0%us, 1.7%sy, 0.0%ni, 97.1%id, 0.0%wa, 0.0%hi, 0.0%si, 0.2%st
Cpu6 : 0.9%us, 1.6%sy, 0.0%ni, 97.2%id, 0.0%wa, 0.0%hi, 0.0%si, 0.2%st
Cpu7 : 0.9%us, 1.6%sy, 0.0%ni, 97.3%id, 0.0%wa, 0.0%hi, 0.0%si, 0.2%st
Cpu8 : 0.9%us, 1.6%sy, 0.0%ni, 97.3%id, 0.0%wa, 0.0%hi, 0.0%si, 0.2%st
Cpu9 : 0.8%us, 1.5%sy, 0.0%ni, 97.4%id, 0.0%wa, 0.0%hi, 0.0%si, 0.2%st
Cpu10 : 0.8%us, 1.5%sy, 0.0%ni, 97.4%id, 0.0%wa, 0.0%hi, 0.0%si, 0.2%st
Cpu11 : 0.8%us, 1.5%sy, 0.0%ni, 97.4%id, 0.0%wa, 0.0%hi, 0.0%si, 0.2%st
Cpu12 : 0.8%us, 1.5%sy, 0.0%ni, 97.5%id, 0.0%wa, 0.0%hi, 0.0%si, 0.2%st
Cpu13 : 0.8%us, 1.5%sy, 0.0%ni, 97.5%id, 0.0%wa, 0.0%hi, 0.0%si, 0.2%st
Mem: 8372060k total, 7404988k used, 967072k free, 719500k buffers
Swap: 1048568k total, 0k used, 1048568k free, 3019864k cached
PID USER PR NI VIRT RES SHR S %CPU %MEM TIME+ COMMAND
30581 www-data 20 0 759m 85m 55m R 86 1.0 3:08.44 php-fpm
30584 www-data 20 0 769m 94m 55m R 80 1.2 3:06.66 php-fpm
30589 www-data 20 0 794m 117m 53m R 80 1.4 2:51.56 php-fpm
39927 www-data 20 0 758m 80m 52m R 69 1.0 2:32.86 php-fpm
30586 www-data 20 0 773m 94m 52m R 57 1.2 3:13.68 php-fpm
55858 www-data 20 0 759m 76m 47m R 48 0.9 0:58.81 php-fpm
26630 www-data 20 0 739m 16m 6132 R 46 0.2 0:19.78 php-fpm
26659 www-data 20 0 739m 17m 7852 R 46 0.2 0:18.24 php-fpm
30579 www-data 20 0 765m 89m 54m R 46 1.1 2:52.85 php-fpm
30582 www-data 20 0 770m 95m 55m R 46 1.2 3:03.82 php-fpm
30587 www-data 20 0 759m 86m 58m R 46 1.1 2:49.60 php-fpm
55854 www-data 20 0 761m 78m 48m R 46 1.0 1:08.47 php-fpm
55857 www-data 20 0 763m 80m 47m R 46 1.0 0:44.35 php-fpm
55977 www-data 20 0 750m 73m 53m R 46 0.9 0:56.27 php-fpm
26651 www-data 20 0 739m 17m 7856 R 45 0.2 0:19.76 php-fpm
40034 www-data 20 0 776m 98m 52m R 45 1.2 2:54.24 php-fpm
30578 www-data 20 0 761m 83m 52m R 43 1.0 3:37.15 php-fpm
30585 www-data 20 0 759m 83m 54m R 43 1.0 2:48.34 php-fpm
30588 www-data 20 0 773m 94m 51m R 43 1.2 3:15.86 php-fpm
26667 www-data 20 0 739m 17m 7856 R 41 0.2 0:16.89 php-fpm
39831 www-data 20 0 769m 89m 51m R 39 1.1 3:01.63 php-fpm
39848 www-data 20 0 775m 97m 52m R 32 1.2 3:03.99 php-fpm
26795 root 20 0 72968 10m 1764 S 23 0.1 0:08.68 nginx
15293 root 20 0 31072 9124 1948 S 4 0.1 0:38.27 csf
26815 root 20 0 18320 2292 1624 S 4 0.0 0:00.02 perl
26867 root 20 0 19200 1376 912 R 4 0.0 0:00.04 top
8213 www-data 20 0 72984 10m 1868 S 2 0.1 0:05.11 nginx
9389 root 20 0 37176 2384 1868 S 2 0.0 2:09.41 master
26874 postfix 20 0 39500 3084 2336 S 2 0.0 0:00.01 local
26889 aegir 20 0 39500 3052 2312 S 2 0.0 0:00.01 local
26908 postfix 20 0 39500 2940 2224 S 2 0.0 0:00.01 local
26979 root 20 0 16072 1660 552 R 2 0.0 0:00.01 iptables
58401 redis 20 0 475m 82m 928 S 2 1.0 5:37.49 redis-server
1 root 20 0 8356 768 636 S 0 0.0 0:56.04 init
2 root 20 0 0 0 0 S 0 0.0 0:00.02 kthreadd
3 root RT 0 0 0 0 S 0 0.0 1:14.48 migration/0
4 root 20 0 0 0 0 S 0 0.0 0:55.26 ksoftirqd/0
5 root RT 0 0 0 0 S 0 0.0 0:00.00 watchdog/0
6 root RT 0 0 0 0 S 0 0.0 1:18.02 migration/1
7 root 20 0 0 0 0 S 0 0.0 1:25.40 ksoftirqd/1
8 root RT 0 0 0 0 S 0 0.0 0:00.00 watchdog/1
9 root RT 0 0 0 0 S 0 0.0 1:07.62 migration/2
10 root 20 0 0 0 0 S 0 0.0 1:19.51 ksoftirqd/2
11 root RT 0 0 0 0 S 0 0.0 0:00.00 watchdog/2
12 root RT 0 0 0 0 S 0 0.0 1:09.78 migration/3
13 root 20 0 0 0 0 S 0 0.0 1:45.20 ksoftirqd/3
14 root RT 0 0 0 0 S 0 0.0 0:00.00 watchdog/3
15 root RT 0 0 0 0 S 0 0.0 1:06.49 migration/4
16 root 20 0 0 0 0 S 0 0.0 1:38.57 ksoftirqd/4
17 root RT 0 0 0 0 S 0 0.0 0:00.00 watchdog/4
18 root RT 0 0 0 0 S 0 0.0 1:07.36 migration/5
19 root 20 0 0 0 0 S 0 0.0 1:47.46 ksoftirqd/5
20 root RT 0 0 0 0 S 0 0.0 0:00.00 watchdog/5
21 root RT 0 0 0 0 S 0 0.0 1:08.66 migration/6
22 root 20 0 0 0 0 S 0 0.0 1:37.54 ksoftirqd/6
23 root RT 0 0 0 0 S 0 0.0 0:00.02 watchdog/6
24 root RT 0 0 0 0 S 0 0.0 1:01.51 migration/7
25 root 20 0 0 0 0 S 0 0.0 1:41.70 ksoftirqd/7
26 root RT 0 0 0 0 S 0 0.0 0:00.00 watchdog/7
27 root RT 0 0 0 0 S 0 0.0 1:03.38 migration/8
28 root 20 0 0 0 0 S 0 0.0 1:40.45 ksoftirqd/8
29 root RT 0 0 0 0 S 0 0.0 0:00.00 watchdog/8
30 root RT 0 0 0 0 S 0 0.0 1:06.63 migration/9
31 root 20 0 0 0 0 S 0 0.0 1:42.39 ksoftirqd/9
32 root RT 0 0 0 0 S 0 0.0 0:00.01 watchdog/9
33 root RT 0 0 0 0 S 0 0.0 1:05.88 migration/10
34 root 20 0 0 0 0 S 0 0.0 1:53.30 ksoftirqd/10
35 root RT 0 0 0 0 S 0 0.0 0:00.00 watchdog/10
36 root RT 0 0 0 0 S 0 0.0 1:04.08 migration/11
37 root 20 0 0 0 0 S 0 0.0 1:41.68 ksoftirqd/11
38 root RT 0 0 0 0 S 0 0.0 0:00.02 watchdog/11
39 root RT 0 0 0 0 S 0 0.0 1:05.40 migration/12
40 root 20 0 0 0 0 S 0 0.0 1:28.30 ksoftirqd/12
41 root RT 0 0 0 0 S 0 0.0 0:00.03 watchdog/12
42 root RT 0 0 0 0 S 0 0.0 1:09.22 migration/13
43 root 20 0 0 0 0 S 0 0.0 0:20.76 ksoftirqd/13
44 root RT 0 0 0 0 S 0 0.0 0:00.00 watchdog/13
45 root 20 0 0 0 0 S 0 0.0 0:15.30 events/0
46 root 20 0 0 0 0 S 0 0.0 0:17.32 events/1
47 root 20 0 0 0 0 S 0 0.0 0:15.73 events/2
48 root 20 0 0 0 0 S 0 0.0 0:13.05 events/3
49 root 20 0 0 0 0 S 0 0.0 0:14.60 events/4
50 root 20 0 0 0 0 S 0 0.0 0:18.15 events/5
51 root 20 0 0 0 0 S 0 0.0 0:13.85 events/6
52 root 20 0 0 0 0 S 0 0.0 0:14.09 events/7
53 root 20 0 0 0 0 S 0 0.0 0:14.18 events/8
54 root 20 0 0 0 0 S 0 0.0 0:13.44 events/9
55 root 20 0 0 0 0 S 0 0.0 0:11.03 events/10
56 root 20 0 0 0 0 S 0 0.0 0:11.50 events/11
57 root 20 0 0 0 0 S 0 0.0 0:14.53 events/12
58 root 20 0 0 0 0 S 0 0.0 0:18.80 events/13
59 root 20 0 0 0 0 S 0 0.0 0:00.00 cpuset
60 root 20 0 0 0 0 S 0 0.0 0:00.00 khelper
61 root 20 0 0 0 0 S 0 0.0 0:00.00 netns
62 root 20 0 0 0 0 S 0 0.0 0:00.00 async/mgr
63 root 20 0 0 0 0 S 0 0.0 0:00.00 pm
64 root 20 0 0 0 0 S 0 0.0 0:00.00 xenwatch
65 root 20 0 0 0 0 S 0 0.0 0:00.00 xenbus
66 root 20 0 0 0 0 S 0 0.0 0:02.12 sync_supers
67 root 20 0 0 0 0 S 0 0.0 0:12.14 bdi-default
68 root 20 0 0 0 0 S 0 0.0 0:00.00 kintegrityd/0
69 root 20 0 0 0 0 S 0 0.0 0:00.00 kintegrityd/1
70 root 20 0 0 0 0 S 0 0.0 0:00.00 kintegrityd/2
71 root 20 0 0 0 0 S 0 0.0 0:00.00 kintegrityd/3
72 root 20 0 0 0 0 S 0 0.0 0:00.00 kintegrityd/4
73 root 20 0 0 0 0 S 0 0.0 0:00.00 kintegrityd/5
74 root 20 0 0 0 0 S 0 0.0 0:00.00 kintegrityd/6
75 root 20 0 0 0 0 S 0 0.0 0:00.00 kintegrityd/7
76 root 20 0 0 0 0 S 0 0.0 0:00.00 kintegrityd/8
77 root 20 0 0 0 0 S 0 0.0 0:00.00 kintegrityd/9
78 root 20 0 0 0 0 S 0 0.0 0:00.00 kintegrityd/10
79 root 20 0 0 0 0 S 0 0.0 0:00.00 kintegrityd/11
80 root 20 0 0 0 0 S 0 0.0 0:00.00 kintegrityd/12
81 root 20 0 0 0 0 S 0 0.0 0:00.00 kintegrityd/13
82 root 20 0 0 0 0 S 0 0.0 0:11.52 kblockd/0
83 root 20 0 0 0 0 S 0 0.0 0:00.03 kblockd/1
84 root 20 0 0 0 0 S 0 0.0 0:00.01 kblockd/2
85 root 20 0 0 0 0 S 0 0.0 0:00.01 kblockd/3
86 root 20 0 0 0 0 S 0 0.0 0:00.00 kblockd/4
87 root 20 0 0 0 0 S 0 0.0 0:00.00 kblockd/5
88 root 20 0 0 0 0 S 0 0.0 0:00.00 kblockd/6
89 root 20 0 0 0 0 S 0 0.0 0:00.00 kblockd/7
90 root 20 0 0 0 0 S 0 0.0 0:00.00 kblockd/8
91 root 20 0 0 0 0 S 0 0.0 0:00.00 kblockd/9
92 root 20 0 0 0 0 S 0 0.0 0:00.00 kblockd/10
93 root 20 0 0 0 0 S 0 0.0 0:00.00 kblockd/11
94 root 20 0 0 0 0 S 0 0.0 0:00.00 kblockd/12
95 root 20 0 0 0 0 S 0 0.0 0:00.00 kblockd/13
96 root 20 0 0 0 0 S 0 0.0 0:00.00 kseriod
111 root 20 0 0 0 0 S 0 0.0 0:00.00 kondemand/0
112 root 20 0 0 0 0 S 0 0.0 0:00.00 kondemand/1
113 root 20 0 0 0 0 S 0 0.0 0:00.00 kondemand/2
114 root 20 0 0 0 0 S 0 0.0 0:00.00 kondemand/3
115 root 20 0 0 0 0 S 0 0.0 0:00.00 kondemand/4
116 root 20 0 0 0 0 S 0 0.0 0:00.00 kondemand/5
117 root 20 0 0 0 0 S 0 0.0 0:00.00 kondemand/6
118 root 20 0 0 0 0 S 0 0.0 0:00.00 kondemand/7
119 root 20 0 0 0 0 S 0 0.0 0:00.00 kondemand/8
120 root 20 0 0 0 0 S 0 0.0 0:00.00 kondemand/9
121 root 20 0 0 0 0 S 0 0.0 0:00.00 kondemand/10
122 root 20 0 0 0 0 S 0 0.0 0:00.00 kondemand/11
123 root 20 0 0 0 0 S 0 0.0 0:00.00 kondemand/12
124 root 20 0 0 0 0 S 0 0.0 0:00.00 kondemand/13
125 root 20 0 0 0 0 S 0 0.0 0:00.66 khungtaskd
126 root 20 0 0 0 0 S 0 0.0 0:04.11 kswapd0
127 root 25 5 0 0 0 S 0 0.0 0:00.00 ksmd
128 root 20 0 0 0 0 S 0 0.0 0:00.00 aio/0
129 root 20 0 0 0 0 S 0 0.0 0:00.00 aio/1
130 root 20 0 0 0 0 S 0 0.0 0:00.00 aio/2
131 root 20 0 0 0 0 S 0 0.0 0:00.00 aio/3
132 root 20 0 0 0 0 S 0 0.0 0:00.00 aio/4
133 root 20 0 0 0 0 S 0 0.0 0:00.00 aio/5
134 root 20 0 0 0 0 S 0 0.0 0:00.00 aio/6
135 root 20 0 0 0 0 S 0 0.0 0:00.00 aio/7
136 root 20 0 0 0 0 S 0 0.0 0:00.00 aio/8
137 root 20 0 0 0 0 S 0 0.0 0:00.00 aio/9
138 root 20 0 0 0 0 S 0 0.0 0:00.00 aio/10
139 root 20 0 0 0 0 S 0 0.0 0:00.00 aio/11
140 root 20 0 0 0 0 S 0 0.0 0:00.00 aio/12
141 root 20 0 0 0 0 S 0 0.0 0:00.00 aio/13
142 root 20 0 0 0 0 S 0 0.0 0:00.00 crypto/0
143 root 20 0 0 0 0 S 0 0.0 0:00.00 crypto/1
144 root 20 0 0 0 0 S 0 0.0 0:00.00 crypto/2
145 root 20 0 0 0 0 S 0 0.0 0:00.00 crypto/3
146 root 20 0 0 0 0 S 0 0.0 0:00.00 crypto/4
147 root 20 0 0 0 0 S 0 0.0 0:00.00 crypto/5
148 root 20 0 0 0 0 S 0 0.0 0:00.00 crypto/6
149 root 20 0 0 0 0 S 0 0.0 0:00.00 crypto/7
150 root 20 0 0 0 0 S 0 0.0 0:00.00 crypto/8
151 root 20 0 0 0 0 S 0 0.0 0:00.00 crypto/9
152 root 20 0 0 0 0 S 0 0.0 0:00.00 crypto/10
153 root 20 0 0 0 0 S 0 0.0 0:00.00 crypto/11
154 root 20 0 0 0 0 S 0 0.0 0:00.00 crypto/12
155 root 20 0 0 0 0 S 0 0.0 0:00.00 crypto/13
158 root 20 0 0 0 0 S 0 0.0 0:00.00 khvcd
211 root 20 0 0 0 0 S 0 0.0 0:00.00 kstriped
220 root 20 0 0 0 0 S 0 0.0 3:12.56 kjournald
266 root 16 -4 16744 744 372 S 0 0.0 0:00.21 udevd
304 root 18 -2 16740 724 348 S 0 0.0 0:01.55 udevd
368 root 20 0 0 0 0 S 0 0.0 0:59.57 flush-202:2
720 root 20 0 6468 604 480 S 0 0.0 11:32.08 vnstatd
745 root 20 0 0 0 0 S 0 0.0 0:00.00 kauditd
3233 root 20 0 19164 1716 1332 S 0 0.0 0:00.25 mysqld_safe
4125 mysql 20 0 2782m 2.0g 10m S 0 25.3 148:05.64 mysqld
4126 root 20 0 5352 688 584 S 0 0.0 0:00.02 logger
4581 root 20 0 49176 1140 584 S 0 0.0 0:05.97 sshd
4708 root 16 -4 45180 964 612 S 0 0.0 0:00.31 auditd
4710 root 12 -8 14296 780 648 S 0 0.0 0:00.73 audispd
4739 root 20 0 22432 1060 796 S 0 0.0 8:20.01 cron
5897 root 20 0 117m 1676 1068 S 0 0.0 2:46.69 rsyslogd
5961 daemon 20 0 18716 448 284 S 0 0.0 0:00.01 atd
5987 pdnsd 20 0 207m 1984 632 S 0 0.0 2:56.29 pdnsd
6010 messageb 20 0 23268 788 564 S 0 0.0 0:00.01 dbus-daemon
6631 root 20 0 70480 3184 2492 S 0 0.0 0:00.03 sshd
6979 chris 20 0 70480 1584 876 S 0 0.0 0:00.53 sshd
6980 chris 20 0 25736 8528 1544 S 0 0.1 0:00.59 bash
7542 root 20 0 24572 1244 992 S 0 0.0 0:00.00 sudo
7543 root 20 0 22156 5040 1636 S 0 0.1 0:01.15 bash
7621 root 20 0 41872 8756 1820 S 0 0.1 2:24.67 munin-node
7651 root 20 0 5932 612 516 S 0 0.0 0:00.00 getty
8206 www-data 20 0 72984 10m 1796 S 0 0.1 0:05.87 nginx
8219 www-data 20 0 72984 10m 1904 S 0 0.1 0:01.80 nginx
8220 www-data 20 0 72984 10m 1732 S 0 0.1 0:02.48 nginx
8222 www-data 20 0 72984 10m 1904 S 0 0.1 0:02.50 nginx
8223 www-data 20 0 72984 10m 1876 S 0 0.1 0:02.92 nginx
8224 www-data 20 0 72984 9868 936 S 0 0.1 0:01.37 nginx
8225 www-data 20 0 72984 10m 1908 S 0 0.1 0:01.04 nginx
8226 www-data 20 0 72984 10m 1860 S 0 0.1 0:03.13 nginx
8228 www-data 20 0 72984 10m 1904 S 0 0.1 0:01.92 nginx
8229 www-data 20 0 72984 10m 1900 S 0 0.1 0:02.64 nginx
8232 www-data 20 0 72984 10m 1780 S 0 0.1 0:05.38 nginx
8233 www-data 20 0 72984 10m 1856 S 0 0.1 0:01.01 nginx
8234 www-data 20 0 72984 9.8m 1144 S 0 0.1 0:02.47 nginx
8235 www-data 20 0 72984 10m 1916 S 0 0.1 0:02.88 nginx
8237 www-data 20 0 72984 10m 1916 S 0 0.1 0:02.35 nginx
8239 www-data 20 0 72984 9992 1060 S 0 0.1 0:00.43 nginx
8242 www-data 20 0 72984 10m 1916 S 0 0.1 0:02.21 nginx
9393 postfix 20 0 39472 2644 1984 S 0 0.0 0:19.12 qmgr
9394 root 20 0 28712 1736 1224 S 0 0.0 0:02.12 pure-ftpd
13773 root 20 0 56612 17m 1544 S 0 0.2 10:29.66 lfd
14843 postfix 20 0 39240 2420 1912 S 0 0.0 0:00.02 pickup
18931 postfix 20 0 42176 3708 2440 S 0 0.0 0:11.18 tlsmgr
20232 root 18 -2 16740 596 228 S 0 0.0 0:00.00 udevd
26324 root 20 0 32812 1080 776 S 0 0.0 0:00.00 cron
26325 root 20 0 32812 1080 776 S 0 0.0 0:00.00 cron
26330 root 20 0 3956 576 484 S 0 0.0 0:00.00 sh
26331 root 20 0 3956 580 484 S 0 0.0 0:00.00 sh
26335 root 20 0 10624 1368 1148 S 0 0.0 0:01.82 bash
26336 root 20 0 10660 1412 1156 S 0 0.0 0:00.00 bash
26360 root 20 0 32812 1080 776 S 0 0.0 0:00.00 cron
26361 root 20 0 32812 1080 776 S 0 0.0 0:00.00 cron
26368 root 20 0 3956 580 484 S 0 0.0 0:00.00 sh
26371 root 20 0 3956 576 484 S 0 0.0 0:00.00 sh
26373 root 20 0 10624 1368 1148 S 0 0.0 0:01.14 bash
26374 root 20 0 10660 1416 1156 S 0 0.0 0:00.07 bash
26588 root 20 0 32812 1080 776 S 0 0.0 0:02.98 cron
26589 root 20 0 32812 1080 776 S 0 0.0 0:02.69 cron
26603 root 20 0 3956 580 484 S 0 0.0 0:01.76 sh
26609 root 20 0 3956 576 484 S 0 0.0 0:01.74 sh
26629 root 20 0 10672 1436 1168 S 0 0.0 0:04.30 bash
26634 root 20 0 10624 1364 1144 S 0 0.0 0:02.02 bash
26696 root 20 0 32812 1080 776 S 0 0.0 0:02.36 cron
26700 root 20 0 32812 1080 776 S 0 0.0 0:02.60 cron
26701 root 20 0 32812 1080 776 S 0 0.0 0:02.82 cron
26709 root 20 0 3956 576 484 S 0 0.0 0:02.05 sh
26713 root 20 0 3956 580 484 S 0 0.0 0:02.21 sh
26714 root 20 0 3956 576 484 S 0 0.0 0:02.50 sh
26718 root 20 0 10660 1412 1156 S 0 0.0 0:01.31 bash
26723 root 20 0 10644 1368 1124 S 0 0.0 0:02.76 bash
26725 root 20 0 10624 1364 1144 S 0 0.0 0:01.68 bash
26751 root 20 0 5368 568 480 S 0 0.0 0:00.28 sleep
26779 root 20 0 5368 568 480 S 0 0.0 0:00.00 sleep
26824 root 20 0 5368 568 480 S 0 0.0 0:00.00 sleep
26830 postfix 20 0 39340 2528 2004 S 0 0.0 0:00.01 cleanup
26844 root 20 0 5368 564 480 S 0 0.0 0:00.00 sleep
26856 postfix 20 0 39252 2404 1908 S 0 0.0 0:00.01 trivial-rewrite
26873 root 20 0 5368 564 480 S 0 0.0 0:00.00 sleep
26887 www-data 20 0 72968 9440 504 R 0 0.1 0:00.00 nginx
26890 www-data 20 0 72968 9440 504 S 0 0.1 0:00.00 nginx
26892 www-data 20 0 72968 9440 504 S 0 0.1 0:00.00 nginx
26897 root 20 0 3956 612 492 S 0 0.0 0:00.00 newrelic-daemon
26898 www-data 20 0 72968 9440 504 S 0 0.1 0:00.00 nginx
26899 www-data 20 0 72968 9440 504 S 0 0.1 0:00.00 nginx
26902 www-data 20 0 72968 9440 504 S 0 0.1 0:00.00 nginx
26904 www-data 20 0 72968 9440 504 S 0 0.1 0:00.00 nginx
26907 www-data 20 0 72968 9440 504 S 0 0.1 0:00.00 nginx
26909 www-data 20 0 72968 9440 504 S 0 0.1 0:00.00 nginx
26910 www-data 20 0 72968 9440 504 S 0 0.1 0:00.00 nginx
26911 www-data 20 0 72968 9440 504 S 0 0.1 0:00.00 nginx
26916 www-data 20 0 72968 9440 504 S 0 0.1 0:00.00 nginx
26917 www-data 20 0 72968 9440 504 S 0 0.1 0:00.00 nginx
26920 www-data 20 0 72968 9440 504 S 0 0.1 0:00.00 nginx
26926 www-data 20 0 72968 9440 504 S 0 0.1 0:00.00 nginx
26931 www-data 20 0 72968 9440 504 S 0 0.1 0:00.00 nginx
26933 www-data 20 0 72968 9440 504 S 0 0.1 0:00.00 nginx
26934 www-data 20 0 72968 9440 504 S 0 0.1 0:00.00 nginx
26936 www-data 20 0 72968 9440 504 S 0 0.1 0:00.00 nginx
26937 www-data 20 0 72968 9440 504 S 0 0.1 0:00.00 nginx
26938 www-data 20 0 72968 9440 504 S 0 0.1 0:00.00 nginx
26939 www-data 20 0 72968 9440 504 S 0 0.1 0:00.00 nginx
26940 www-data 20 0 72968 9440 504 S 0 0.1 0:00.00 nginx
26941 www-data 20 0 72968 9440 504 S 0 0.1 0:00.00 nginx
26942 www-data 20 0 72968 9440 504 S 0 0.1 0:00.00 nginx
26943 www-data 20 0 72968 9440 504 S 0 0.1 0:00.00 nginx
26944 www-data 20 0 72968 9440 504 S 0 0.1 0:00.00 nginx
26951 www-data 20 0 72968 9440 504 S 0 0.1 0:00.00 nginx
26952 www-data 20 0 72968 9452 516 S 0 0.1 0:00.00 nginx
26953 root 20 0 3872 500 416 S 0 0.0 0:00.00 sleep
26973 root 20 0 10624 528 304 S 0 0.0 0:00.00 bash
26975 root 20 0 10624 224 0 R 0 0.0 0:00.00 bash
26976 root 20 0 7552 816 704 S 0 0.0 0:00.00 grep
26977 root 20 0 10376 908 768 S 0 0.0 0:00.00 awk
26980 root 20 0 10624 220 0 R 0 0.0 0:00.00 bash
30567 root 20 0 734m 7040 1888 S 0 0.1 0:06.84 php-fpm
39671 root 20 0 70480 3180 2492 S 0 0.0 0:00.02 sshd
39758 chris 20 0 70480 1580 876 S 0 0.0 0:00.13 sshd
39759 chris 20 0 25736 8524 1544 S 0 0.1 0:00.54 bash
39800 root 20 0 24572 1244 992 S 0 0.0 0:00.00 sudo
39801 root 20 0 22104 4920 1568 S 0 0.1 0:00.33 bash
44174 ntp 20 0 38340 2180 1592 S 0 0.0 2:06.61 ntpd
48232 root 20 0 32992 4572 2080 S 0 0.1 0:00.06 vi
====================
And:
====================
nginx high load on
ONEX_LOAD = 285
FIVX_LOAD = 412
uptime :
14:16:02 up 11 days, 5:01, 3 users, load average: 5.59, 4.67, 4.94
vmstat :
8175 M total memory
7423 M used memory
4675 M active memory
2067 M inactive memory
752 M free memory
702 M buffer memory
2934 M swap cache
1023 M total swap
0 M used swap
1023 M free swap
30566473 non-nice user cpu ticks
15 nice user cpu ticks
45784546 system cpu ticks
2539162558 idle cpu ticks
4720530 IO-wait cpu ticks
536 IRQ cpu ticks
648323 softirq cpu ticks
6420136 stolen cpu ticks
7048877 pages paged in
363775744 pages paged out
0 pages swapped in
0 pages swapped out
1032427982 interrupts
790941773 CPU context switches
1379837683 boot time
20744047 forks
disk- ------------reads------------ ------------writes----------- -----IO------
total merged sectors ms total merged sectors ms cur sec
xvda2 391989 2508 13684618 2080132 17942725 49855397 727551488 955206856 0 29519
xvda1 27090 24552 413136 114684 0 0 0 0 0 19
top :
top - 14:16:04 up 11 days, 5:01, 3 users, load average: 5.59, 4.67, 4.94
Tasks: 312 total, 29 running, 283 sleeping, 0 stopped, 0 zombie
Cpu0 : 2.6%us, 2.4%sy, 0.0%ni, 92.2%id, 2.2%wa, 0.0%hi, 0.3%si, 0.3%st
Cpu1 : 1.7%us, 2.3%sy, 0.0%ni, 95.6%id, 0.1%wa, 0.0%hi, 0.0%si, 0.3%st
Cpu2 : 1.7%us, 2.2%sy, 0.0%ni, 95.8%id, 0.0%wa, 0.0%hi, 0.0%si, 0.2%st
Cpu3 : 1.3%us, 1.9%sy, 0.0%ni, 96.6%id, 0.0%wa, 0.0%hi, 0.0%si, 0.2%st
Cpu4 : 1.2%us, 1.8%sy, 0.0%ni, 96.7%id, 0.0%wa, 0.0%hi, 0.0%si, 0.2%st
Cpu5 : 1.0%us, 1.7%sy, 0.0%ni, 97.0%id, 0.0%wa, 0.0%hi, 0.0%si, 0.2%st
Cpu6 : 0.9%us, 1.7%sy, 0.0%ni, 97.2%id, 0.0%wa, 0.0%hi, 0.0%si, 0.2%st
Cpu7 : 0.9%us, 1.6%sy, 0.0%ni, 97.3%id, 0.0%wa, 0.0%hi, 0.0%si, 0.2%st
Cpu8 : 0.9%us, 1.6%sy, 0.0%ni, 97.3%id, 0.0%wa, 0.0%hi, 0.0%si, 0.2%st
Cpu9 : 0.8%us, 1.5%sy, 0.0%ni, 97.4%id, 0.0%wa, 0.0%hi, 0.0%si, 0.2%st
Cpu10 : 0.8%us, 1.5%sy, 0.0%ni, 97.4%id, 0.0%wa, 0.0%hi, 0.0%si, 0.2%st
Cpu11 : 0.8%us, 1.5%sy, 0.0%ni, 97.4%id, 0.0%wa, 0.0%hi, 0.0%si, 0.2%st
Cpu12 : 0.8%us, 1.5%sy, 0.0%ni, 97.5%id, 0.0%wa, 0.0%hi, 0.0%si, 0.2%st
Cpu13 : 0.8%us, 1.5%sy, 0.0%ni, 97.5%id, 0.0%wa, 0.0%hi, 0.0%si, 0.2%st
Mem: 8372060k total, 7611296k used, 760764k free, 719808k buffers
Swap: 1048568k total, 0k used, 1048568k free, 3004672k cached
PID USER PR NI VIRT RES SHR S %CPU %MEM TIME+ COMMAND
36093 www-data 20 0 761m 73m 42m R 138 0.9 0:10.58 php-fpm
36100 www-data 20 0 750m 62m 40m R 136 0.8 0:07.99 php-fpm
43007 aegir 20 0 234m 25m 8704 R 136 0.3 0:01.06 drush.php
42850 aegir 20 0 241m 32m 8992 R 135 0.4 0:01.91 drush.php
36082 www-data 20 0 793m 123m 60m R 125 1.5 0:10.47 php-fpm
43200 nobody 20 0 17484 3008 1712 S 125 0.0 0:00.74 irqstats
42894 aegir 20 0 242m 33m 8912 R 116 0.4 0:02.67 drush.php
36083 www-data 20 0 766m 81m 46m R 114 1.0 0:10.25 php-fpm
36096 www-data 20 0 758m 70m 42m R 114 0.9 0:08.66 php-fpm
36102 www-data 20 0 759m 70m 42m R 114 0.9 0:09.12 php-fpm
42801 www-data 20 0 743m 34m 21m R 111 0.4 0:03.28 php-fpm
36090 www-data 20 0 753m 67m 44m R 109 0.8 0:09.08 php-fpm
36103 www-data 20 0 795m 107m 43m R 109 1.3 0:07.24 php-fpm
42922 www-data 20 0 739m 17m 7548 S 109 0.2 0:02.29 php-fpm
36086 www-data 20 0 768m 82m 44m R 108 1.0 0:09.22 php-fpm
36104 www-data 20 0 768m 79m 42m R 106 1.0 0:09.39 php-fpm
42799 www-data 20 0 757m 61m 33m R 106 0.8 0:03.99 php-fpm
36091 www-data 20 0 767m 82m 45m R 104 1.0 0:10.27 php-fpm
36097 www-data 20 0 766m 77m 41m R 103 1.0 0:08.83 php-fpm
43017 tn 20 0 236m 27m 8728 R 103 0.3 0:00.85 php
36088 www-data 20 0 770m 83m 43m R 101 1.0 0:08.75 php-fpm
36101 www-data 20 0 761m 73m 42m R 101 0.9 0:09.71 php-fpm
36106 www-data 20 0 829m 134m 38m R 101 1.6 0:20.20 php-fpm
26795 root 20 0 72984 10m 1764 R 98 0.1 0:09.86 nginx
42800 www-data 20 0 761m 59m 28m R 98 0.7 0:03.44 php-fpm
36092 www-data 20 0 759m 72m 43m R 96 0.9 0:08.10 php-fpm
43016 root 20 0 10644 1364 1124 S 86 0.0 0:00.51 bash
36084 www-data 20 0 769m 85m 46m R 84 1.0 0:08.80 php-fpm
42875 root 20 0 10752 1580 1228 S 82 0.0 0:00.74 bash
43186 root 20 0 19200 1432 912 R 77 0.0 0:00.48 top
43109 root 20 0 16852 1084 868 S 69 0.0 0:00.43 tar
42656 www-data 20 0 73000 10m 1876 S 67 0.1 0:01.95 nginx
36087 www-data 20 0 767m 80m 44m R 66 1.0 0:08.75 php-fpm
43071 root 20 0 3956 616 492 S 64 0.0 0:00.38 newrelic-daemon
43110 root 20 0 13292 7016 448 R 59 0.1 0:00.57 bzip2
43086 root 20 0 3956 612 492 S 47 0.0 0:00.28 newrelic-daemon
42674 www-data 20 0 73000 9472 536 S 25 0.1 0:00.15 nginx
42829 root 20 0 10624 1360 1144 S 13 0.0 0:00.11 bash
42928 root 20 0 10624 1364 1144 S 13 0.0 0:00.43 bash
58401 redis 20 0 475m 87m 928 S 10 1.1 5:42.27 redis-server
4125 mysql 20 0 2782m 2.0g 10m S 8 25.4 148:23.33 mysqld
43207 www-data 20 0 72984 9444 504 S 5 0.1 0:00.03 nginx
42639 www-data 20 0 73000 9980 1044 S 2 0.1 0:00.20 nginx
42802 root 20 0 41872 7972 1036 S 2 0.1 0:00.04 munin-node
1 root 20 0 8356 768 636 S 0 0.0 0:56.05 init
2 root 20 0 0 0 0 S 0 0.0 0:00.02 kthreadd
3 root RT 0 0 0 0 S 0 0.0 1:14.56 migration/0
4 root 20 0 0 0 0 S 0 0.0 0:55.27 ksoftirqd/0
5 root RT 0 0 0 0 S 0 0.0 0:00.00 watchdog/0
6 root RT 0 0 0 0 S 0 0.0 1:18.06 migration/1
7 root 20 0 0 0 0 S 0 0.0 1:25.46 ksoftirqd/1
8 root RT 0 0 0 0 S 0 0.0 0:00.00 watchdog/1
9 root RT 0 0 0 0 S 0 0.0 1:07.72 migration/2
10 root 20 0 0 0 0 S 0 0.0 1:19.52 ksoftirqd/2
11 root RT 0 0 0 0 S 0 0.0 0:00.00 watchdog/2
12 root RT 0 0 0 0 S 0 0.0 1:09.92 migration/3
13 root 20 0 0 0 0 S 0 0.0 1:45.21 ksoftirqd/3
14 root RT 0 0 0 0 S 0 0.0 0:00.00 watchdog/3
15 root RT 0 0 0 0 S 0 0.0 1:06.56 migration/4
16 root 20 0 0 0 0 S 0 0.0 1:38.58 ksoftirqd/4
17 root RT 0 0 0 0 S 0 0.0 0:00.00 watchdog/4
18 root RT 0 0 0 0 S 0 0.0 1:07.41 migration/5
19 root 20 0 0 0 0 S 0 0.0 1:47.48 ksoftirqd/5
20 root RT 0 0 0 0 S 0 0.0 0:00.00 watchdog/5
21 root RT 0 0 0 0 S 0 0.0 1:08.78 migration/6
22 root 20 0 0 0 0 S 0 0.0 1:37.56 ksoftirqd/6
23 root RT 0 0 0 0 S 0 0.0 0:00.02 watchdog/6
24 root RT 0 0 0 0 S 0 0.0 1:01.59 migration/7
25 root 20 0 0 0 0 S 0 0.0 1:41.71 ksoftirqd/7
26 root RT 0 0 0 0 S 0 0.0 0:00.00 watchdog/7
27 root RT 0 0 0 0 S 0 0.0 1:03.53 migration/8
28 root 20 0 0 0 0 S 0 0.0 1:40.46 ksoftirqd/8
29 root RT 0 0 0 0 S 0 0.0 0:00.00 watchdog/8
30 root RT 0 0 0 0 S 0 0.0 1:06.74 migration/9
31 root 20 0 0 0 0 S 0 0.0 1:42.40 ksoftirqd/9
32 root RT 0 0 0 0 S 0 0.0 0:00.01 watchdog/9
33 root RT 0 0 0 0 S 0 0.0 1:05.94 migration/10
34 root 20 0 0 0 0 S 0 0.0 1:53.31 ksoftirqd/10
35 root RT 0 0 0 0 S 0 0.0 0:00.00 watchdog/10
36 root RT 0 0 0 0 S 0 0.0 1:04.12 migration/11
37 root 20 0 0 0 0 S 0 0.0 1:41.69 ksoftirqd/11
38 root RT 0 0 0 0 S 0 0.0 0:00.02 watchdog/11
39 root RT 0 0 0 0 S 0 0.0 1:05.44 migration/12
40 root 20 0 0 0 0 S 0 0.0 1:28.31 ksoftirqd/12
41 root RT 0 0 0 0 S 0 0.0 0:00.03 watchdog/12
42 root RT 0 0 0 0 S 0 0.0 1:09.32 migration/13
43 root 20 0 0 0 0 S 0 0.0 0:20.77 ksoftirqd/13
44 root RT 0 0 0 0 S 0 0.0 0:00.00 watchdog/13
45 root 20 0 0 0 0 S 0 0.0 0:15.31 events/0
46 root 20 0 0 0 0 S 0 0.0 0:17.32 events/1
47 root 20 0 0 0 0 S 0 0.0 0:15.74 events/2
48 root 20 0 0 0 0 S 0 0.0 0:13.05 events/3
49 root 20 0 0 0 0 S 0 0.0 0:14.60 events/4
50 root 20 0 0 0 0 S 0 0.0 0:18.16 events/5
51 root 20 0 0 0 0 S 0 0.0 0:13.86 events/6
52 root 20 0 0 0 0 S 0 0.0 0:14.10 events/7
53 root 20 0 0 0 0 S 0 0.0 0:14.18 events/8
54 root 20 0 0 0 0 S 0 0.0 0:13.44 events/9
55 root 20 0 0 0 0 S 0 0.0 0:11.04 events/10
56 root 20 0 0 0 0 S 0 0.0 0:11.51 events/11
57 root 20 0 0 0 0 S 0 0.0 0:14.53 events/12
58 root 20 0 0 0 0 S 0 0.0 0:18.82 events/13
59 root 20 0 0 0 0 S 0 0.0 0:00.00 cpuset
60 root 20 0 0 0 0 S 0 0.0 0:00.00 khelper
61 root 20 0 0 0 0 S 0 0.0 0:00.00 netns
62 root 20 0 0 0 0 S 0 0.0 0:00.00 async/mgr
63 root 20 0 0 0 0 S 0 0.0 0:00.00 pm
64 root 20 0 0 0 0 S 0 0.0 0:00.00 xenwatch
65 root 20 0 0 0 0 S 0 0.0 0:00.00 xenbus
66 root 20 0 0 0 0 S 0 0.0 0:02.12 sync_supers
67 root 20 0 0 0 0 S 0 0.0 0:12.14 bdi-default
68 root 20 0 0 0 0 S 0 0.0 0:00.00 kintegrityd/0
69 root 20 0 0 0 0 S 0 0.0 0:00.00 kintegrityd/1
70 root 20 0 0 0 0 S 0 0.0 0:00.00 kintegrityd/2
71 root 20 0 0 0 0 S 0 0.0 0:00.00 kintegrityd/3
72 root 20 0 0 0 0 S 0 0.0 0:00.00 kintegrityd/4
73 root 20 0 0 0 0 S 0 0.0 0:00.00 kintegrityd/5
74 root 20 0 0 0 0 S 0 0.0 0:00.00 kintegrityd/6
75 root 20 0 0 0 0 S 0 0.0 0:00.00 kintegrityd/7
76 root 20 0 0 0 0 S 0 0.0 0:00.00 kintegrityd/8
77 root 20 0 0 0 0 S 0 0.0 0:00.00 kintegrityd/9
78 root 20 0 0 0 0 S 0 0.0 0:00.00 kintegrityd/10
79 root 20 0 0 0 0 S 0 0.0 0:00.00 kintegrityd/11
80 root 20 0 0 0 0 S 0 0.0 0:00.00 kintegrityd/12
81 root 20 0 0 0 0 S 0 0.0 0:00.00 kintegrityd/13
82 root 20 0 0 0 0 S 0 0.0 0:11.53 kblockd/0
83 root 20 0 0 0 0 S 0 0.0 0:00.03 kblockd/1
84 root 20 0 0 0 0 S 0 0.0 0:00.01 kblockd/2
85 root 20 0 0 0 0 S 0 0.0 0:00.01 kblockd/3
86 root 20 0 0 0 0 S 0 0.0 0:00.00 kblockd/4
87 root 20 0 0 0 0 S 0 0.0 0:00.00 kblockd/5
88 root 20 0 0 0 0 S 0 0.0 0:00.00 kblockd/6
89 root 20 0 0 0 0 S 0 0.0 0:00.00 kblockd/7
90 root 20 0 0 0 0 S 0 0.0 0:00.00 kblockd/8
91 root 20 0 0 0 0 S 0 0.0 0:00.00 kblockd/9
92 root 20 0 0 0 0 S 0 0.0 0:00.00 kblockd/10
93 root 20 0 0 0 0 S 0 0.0 0:00.00 kblockd/11
94 root 20 0 0 0 0 S 0 0.0 0:00.00 kblockd/12
95 root 20 0 0 0 0 S 0 0.0 0:00.00 kblockd/13
96 root 20 0 0 0 0 S 0 0.0 0:00.00 kseriod
111 root 20 0 0 0 0 S 0 0.0 0:00.00 kondemand/0
112 root 20 0 0 0 0 S 0 0.0 0:00.00 kondemand/1
113 root 20 0 0 0 0 S 0 0.0 0:00.00 kondemand/2
114 root 20 0 0 0 0 S 0 0.0 0:00.00 kondemand/3
115 root 20 0 0 0 0 S 0 0.0 0:00.00 kondemand/4
116 root 20 0 0 0 0 S 0 0.0 0:00.00 kondemand/5
117 root 20 0 0 0 0 S 0 0.0 0:00.00 kondemand/6
118 root 20 0 0 0 0 S 0 0.0 0:00.00 kondemand/7
119 root 20 0 0 0 0 S 0 0.0 0:00.00 kondemand/8
120 root 20 0 0 0 0 S 0 0.0 0:00.00 kondemand/9
121 root 20 0 0 0 0 S 0 0.0 0:00.00 kondemand/10
122 root 20 0 0 0 0 S 0 0.0 0:00.00 kondemand/11
123 root 20 0 0 0 0 S 0 0.0 0:00.00 kondemand/12
124 root 20 0 0 0 0 S 0 0.0 0:00.00 kondemand/13
125 root 20 0 0 0 0 S 0 0.0 0:00.66 khungtaskd
126 root 20 0 0 0 0 S 0 0.0 0:04.11 kswapd0
127 root 25 5 0 0 0 S 0 0.0 0:00.00 ksmd
128 root 20 0 0 0 0 S 0 0.0 0:00.00 aio/0
129 root 20 0 0 0 0 S 0 0.0 0:00.00 aio/1
130 root 20 0 0 0 0 S 0 0.0 0:00.00 aio/2
131 root 20 0 0 0 0 S 0 0.0 0:00.00 aio/3
132 root 20 0 0 0 0 S 0 0.0 0:00.00 aio/4
133 root 20 0 0 0 0 S 0 0.0 0:00.00 aio/5
134 root 20 0 0 0 0 S 0 0.0 0:00.00 aio/6
135 root 20 0 0 0 0 S 0 0.0 0:00.00 aio/7
136 root 20 0 0 0 0 S 0 0.0 0:00.00 aio/8
137 root 20 0 0 0 0 S 0 0.0 0:00.00 aio/9
138 root 20 0 0 0 0 S 0 0.0 0:00.00 aio/10
139 root 20 0 0 0 0 S 0 0.0 0:00.00 aio/11
140 root 20 0 0 0 0 S 0 0.0 0:00.00 aio/12
141 root 20 0 0 0 0 S 0 0.0 0:00.00 aio/13
142 root 20 0 0 0 0 S 0 0.0 0:00.00 crypto/0
143 root 20 0 0 0 0 S 0 0.0 0:00.00 crypto/1
144 root 20 0 0 0 0 S 0 0.0 0:00.00 crypto/2
145 root 20 0 0 0 0 S 0 0.0 0:00.00 crypto/3
146 root 20 0 0 0 0 S 0 0.0 0:00.00 crypto/4
147 root 20 0 0 0 0 S 0 0.0 0:00.00 crypto/5
148 root 20 0 0 0 0 S 0 0.0 0:00.00 crypto/6
149 root 20 0 0 0 0 S 0 0.0 0:00.00 crypto/7
150 root 20 0 0 0 0 S 0 0.0 0:00.00 crypto/8
151 root 20 0 0 0 0 S 0 0.0 0:00.00 crypto/9
152 root 20 0 0 0 0 S 0 0.0 0:00.00 crypto/10
153 root 20 0 0 0 0 S 0 0.0 0:00.00 crypto/11
154 root 20 0 0 0 0 S 0 0.0 0:00.00 crypto/12
155 root 20 0 0 0 0 S 0 0.0 0:00.00 crypto/13
158 root 20 0 0 0 0 S 0 0.0 0:00.00 khvcd
211 root 20 0 0 0 0 S 0 0.0 0:00.00 kstriped
220 root 20 0 0 0 0 S 0 0.0 3:12.64 kjournald
266 root 16 -4 16744 744 372 S 0 0.0 0:00.21 udevd
304 root 18 -2 16740 724 348 S 0 0.0 0:01.56 udevd
368 root 20 0 0 0 0 S 0 0.0 0:59.60 flush-202:2
720 root 20 0 6468 604 480 S 0 0.0 11:32.88 vnstatd
745 root 20 0 0 0 0 S 0 0.0 0:00.00 kauditd
3233 root 20 0 19164 1716 1332 S 0 0.0 0:00.25 mysqld_safe
4126 root 20 0 5352 688 584 S 0 0.0 0:00.02 logger
4581 root 20 0 49176 1140 584 S 0 0.0 0:05.97 sshd
4708 root 16 -4 45180 964 612 S 0 0.0 0:00.31 auditd
4710 root 12 -8 14296 780 648 S 0 0.0 0:00.73 audispd
4739 root 20 0 22432 1060 796 S 0 0.0 8:21.32 cron
5897 root 20 0 117m 1676 1068 S 0 0.0 2:46.84 rsyslogd
5961 daemon 20 0 18716 448 284 S 0 0.0 0:00.01 atd
5987 pdnsd 20 0 207m 1984 632 S 0 0.0 2:56.35 pdnsd
6010 messageb 20 0 23268 788 564 S 0 0.0 0:00.01 dbus-daemon
6631 root 20 0 70480 3184 2492 S 0 0.0 0:00.03 sshd
6979 chris 20 0 70480 1584 876 S 0 0.0 0:00.53 sshd
6980 chris 20 0 25736 8528 1544 S 0 0.1 0:00.59 bash
7542 root 20 0 24572 1244 992 S 0 0.0 0:00.00 sudo
7543 root 20 0 22156 5040 1636 S 0 0.1 0:01.15 bash
7621 root 20 0 41872 8756 1820 S 0 0.1 2:25.36 munin-node
7651 root 20 0 5932 612 516 S 0 0.0 0:00.00 getty
9389 root 20 0 37176 2384 1868 S 0 0.0 2:09.41 master
9393 postfix 20 0 39472 2644 1984 S 0 0.0 0:19.12 qmgr
9394 root 20 0 28712 1736 1224 S 0 0.0 0:02.12 pure-ftpd
13773 root 20 0 56612 17m 1544 S 0 0.2 10:30.02 lfd
14843 postfix 20 0 39240 2420 1912 S 0 0.0 0:00.03 pickup
18931 postfix 20 0 42176 3708 2440 S 0 0.0 0:11.18 tlsmgr
20232 root 18 -2 16740 596 228 S 0 0.0 0:00.00 udevd
26902 www-data 20 0 72968 10m 1892 S 0 0.1 0:00.14 nginx
26942 www-data 20 0 72968 10m 1880 S 0 0.1 0:00.13 nginx
36081 root 20 0 734m 6960 1812 S 0 0.1 0:00.10 php-fpm
39671 root 20 0 70480 3180 2492 S 0 0.0 0:00.02 sshd
39758 chris 20 0 70480 1580 876 S 0 0.0 0:00.13 sshd
39759 chris 20 0 25736 8524 1544 S 0 0.1 0:00.54 bash
39800 root 20 0 24572 1244 992 S 0 0.0 0:00.00 sudo
39801 root 20 0 22104 4920 1568 S 0 0.1 0:00.33 bash
40728 root 20 0 70480 3188 2500 S 0 0.0 0:00.02 sshd
40730 jim 20 0 70480 1568 876 S 0 0.0 0:00.05 sshd
40733 jim 20 0 25652 8444 1544 S 0 0.1 0:00.54 bash
40739 postfix 20 0 39340 2524 2004 S 0 0.0 0:00.01 cleanup
40743 postfix 20 0 39252 2404 1908 S 0 0.0 0:00.00 trivial-rewrite
40744 postfix 20 0 43808 3596 2828 S 0 0.0 0:00.07 smtp
42532 root 20 0 24572 1240 992 S 0 0.0 0:00.00 sudo
42533 root 20 0 22104 4896 1544 S 0 0.1 0:00.27 bash
42571 tn.ftp 20 0 36888 1236 964 S 0 0.0 0:00.00 su
42572 tn.ftp 20 0 19232 1980 1508 S 0 0.0 0:00.04 bash
42641 www-data 20 0 73000 9440 504 S 0 0.1 0:00.00 nginx
42647 www-data 20 0 73000 9440 504 S 0 0.1 0:00.00 nginx
42648 www-data 20 0 73000 9440 504 S 0 0.1 0:00.00 nginx
42649 www-data 20 0 73000 10m 1848 S 0 0.1 0:00.02 nginx
42650 www-data 20 0 73000 9440 504 S 0 0.1 0:00.00 nginx
42651 www-data 20 0 73000 9872 936 S 0 0.1 0:01.08 nginx
42652 www-data 20 0 73000 9440 504 R 0 0.1 0:00.00 nginx
42653 www-data 20 0 73000 9440 504 S 0 0.1 0:00.00 nginx
42654 www-data 20 0 73000 9440 504 S 0 0.1 0:00.02 nginx
42655 www-data 20 0 73000 9440 504 S 0 0.1 0:00.00 nginx
42658 www-data 20 0 73000 9440 504 S 0 0.1 0:00.00 nginx
42659 www-data 20 0 73000 9440 504 S 0 0.1 0:00.00 nginx
42660 www-data 20 0 73000 9860 924 S 0 0.1 0:00.23 nginx
42661 www-data 20 0 73000 9440 504 S 0 0.1 0:00.00 nginx
42662 www-data 20 0 73000 9440 504 S 0 0.1 0:00.00 nginx
42663 www-data 20 0 73000 9440 504 S 0 0.1 0:00.00 nginx
42664 www-data 20 0 73000 9440 504 S 0 0.1 0:00.00 nginx
42665 www-data 20 0 73000 9440 504 S 0 0.1 0:00.00 nginx
42666 www-data 20 0 73000 9728 792 S 0 0.1 0:00.00 nginx
42667 www-data 20 0 73000 9440 504 S 0 0.1 0:00.00 nginx
42668 www-data 20 0 73000 9440 504 S 0 0.1 0:00.00 nginx
42669 www-data 20 0 73000 9440 504 S 0 0.1 0:00.00 nginx
42670 www-data 20 0 73000 9440 504 S 0 0.1 0:00.00 nginx
42671 www-data 20 0 73000 9440 504 S 0 0.1 0:00.00 nginx
42672 www-data 20 0 73000 9440 504 S 0 0.1 0:00.00 nginx
42673 www-data 20 0 73000 9440 504 S 0 0.1 0:00.00 nginx
42804 root 20 0 32812 1080 776 S 0 0.0 0:00.00 cron
42805 root 20 0 32812 1080 776 S 0 0.0 0:00.00 cron
42808 root 20 0 32812 1080 776 S 0 0.0 0:00.00 cron
42809 root 20 0 32812 1080 776 S 0 0.0 0:00.00 cron
42810 root 20 0 32812 1080 776 S 0 0.0 0:00.00 cron
42814 root 20 0 3956 576 484 S 0 0.0 0:00.00 sh
42816 root 20 0 3956 580 484 S 0 0.0 0:00.00 sh
42817 root 20 0 3956 580 484 S 0 0.0 0:00.00 sh
42820 root 20 0 10612 1356 1148 S 0 0.0 0:00.10 bash
42821 root 20 0 3956 576 484 S 0 0.0 0:00.00 sh
42827 root 20 0 10660 1416 1156 S 0 0.0 0:00.01 bash
42836 root 20 0 10644 1360 1124 S 0 0.0 0:00.24 bash
42840 aegir 20 0 10588 1300 1112 S 0 0.0 0:00.00 bash
42852 root 20 0 18320 2300 1624 S 0 0.0 0:00.12 perl
42859 root 20 0 32812 1080 776 S 0 0.0 0:00.01 cron
42863 root 20 0 32812 1080 776 S 0 0.0 0:00.03 cron
42864 root 20 0 32812 1080 776 S 0 0.0 0:00.00 cron
42865 root 20 0 32812 1080 776 S 0 0.0 0:00.00 cron
42867 root 20 0 32812 1080 776 S 0 0.0 0:00.00 cron
42868 root 20 0 32812 1080 776 S 0 0.0 0:00.01 cron
42869 root 20 0 32812 1080 776 S 0 0.0 0:00.00 cron
42870 root 20 0 3956 576 484 S 0 0.0 0:00.00 sh
42872 root 20 0 3956 576 484 S 0 0.0 0:00.00 sh
42874 root 20 0 3956 576 484 S 0 0.0 0:00.00 sh
42876 root 20 0 10644 1368 1124 S 0 0.0 0:00.24 bash
42879 root 20 0 10612 1356 1148 S 0 0.0 0:00.55 bash
42887 aegir 20 0 10588 1300 1112 S 0 0.0 0:00.00 bash
42900 root 20 0 3956 576 484 S 0 0.0 0:00.00 sh
42901 root 20 0 10664 1412 1148 S 0 0.0 0:00.01 bash
42913 root 20 0 3956 584 488 S 0 0.0 0:00.00 sh
42914 root 20 0 10836 1624 1192 S 0 0.0 0:00.36 metche
42918 root 20 0 3956 576 484 S 0 0.0 0:00.14 sh
42942 root 20 0 5368 568 480 S 0 0.0 0:00.17 sleep
42943 root 20 0 5368 564 480 S 0 0.0 0:00.20 sleep
42945 root 20 0 5368 564 480 S 0 0.0 0:00.00 sleep
42947 root 20 0 10612 1348 1136 S 0 0.0 0:00.00 bash
42949 root 20 0 32812 1080 776 S 0 0.0 0:00.02 cron
42950 root 20 0 32812 1080 776 S 0 0.0 0:00.00 cron
42955 root 20 0 32812 1080 776 S 0 0.0 0:00.00 cron
42956 root 20 0 32812 1080 776 S 0 0.0 0:00.00 cron
42961 tn 20 0 36888 1232 968 S 0 0.0 0:00.01 su
42962 root 20 0 3956 576 484 S 0 0.0 0:00.00 sh
42963 root 20 0 3956 576 484 S 0 0.0 0:00.00 sh
42967 root 20 0 10624 1368 1144 S 0 0.0 0:00.00 bash
42973 root 20 0 10660 1416 1156 S 0 0.0 0:00.01 bash
42985 tn 20 0 10592 1304 1112 S 0 0.0 0:00.00 bash
{{{
42989 aegir 20 0 10588 1296 1112 S 0 0.0 0:00.00 bash
43003 root 20 0 18320 2304 1624 S 0 0.0 0:00.02 perl
43005 root 20 0 3956 576 484 S 0 0.0 0:00.00 sh
44174 ntp 20 0 38340 2180 1592 S 0 0.0 2:06.74 ntpd
48232 root 20 0 32992 4572 2080 S 0 0.1 0:00.06 vi
====================
}}}
And:
{{{
====================
nginx high load on
ONEX_LOAD = 881
FIVX_LOAD = 407
uptime :
14:33:07 up 11 days, 5:19, 3 users, load average: 70.52, 32.99, 14.82
vmstat :
8175 M total memory
7501 M used memory
4731 M active memory
2087 M inactive memory
673 M free memory
703 M buffer memory
2969 M swap cache
1023 M total swap
0 M used swap
1023 M free swap
30617854 non-nice user cpu ticks
15 nice user cpu ticks
45889550 system cpu ticks
2541317540 idle cpu ticks
4726769 IO-wait cpu ticks
537 IRQ cpu ticks
649925 softirq cpu ticks
6576532 stolen cpu ticks
7056193 pages paged in
364190220 pages paged out
0 pages swapped in
0 pages swapped out
1033966482 interrupts
792110970 CPU context switches
1379837621 boot time
20775019 forks
disk- ------------reads------------ ------------writes----------- -----IO------
total merged sectors ms total merged sectors ms cur sec
xvda2 392300 2511 13699250 2087468 17964640 49896940 728380448 956223556 0 29584
xvda1 27090 24552 413136 114684 0 0 0 0 0 19
top :
top - 14:33:08 up 11 days, 5:19, 3 users, load average: 70.52, 32.99, 14.82
Tasks: 358 total, 36 running, 322 sleeping, 0 stopped, 0 zombie
Cpu0 : 2.6%us, 2.4%sy, 0.0%ni, 92.2%id, 2.2%wa, 0.0%hi, 0.3%si, 0.3%st
Cpu1 : 1.7%us, 2.3%sy, 0.0%ni, 95.6%id, 0.1%wa, 0.0%hi, 0.0%si, 0.3%st
Cpu2 : 1.7%us, 2.2%sy, 0.0%ni, 95.8%id, 0.0%wa, 0.0%hi, 0.0%si, 0.3%st
Cpu3 : 1.3%us, 1.9%sy, 0.0%ni, 96.6%id, 0.0%wa, 0.0%hi, 0.0%si, 0.3%st
Cpu4 : 1.2%us, 1.8%sy, 0.0%ni, 96.7%id, 0.0%wa, 0.0%hi, 0.0%si, 0.2%st
Cpu5 : 1.0%us, 1.7%sy, 0.0%ni, 97.0%id, 0.0%wa, 0.0%hi, 0.0%si, 0.2%st
Cpu6 : 0.9%us, 1.7%sy, 0.0%ni, 97.1%id, 0.0%wa, 0.0%hi, 0.0%si, 0.2%st
Cpu7 : 0.9%us, 1.6%sy, 0.0%ni, 97.3%id, 0.0%wa, 0.0%hi, 0.0%si, 0.2%st
Cpu8 : 0.9%us, 1.6%sy, 0.0%ni, 97.3%id, 0.0%wa, 0.0%hi, 0.0%si, 0.2%st
Cpu9 : 0.8%us, 1.5%sy, 0.0%ni, 97.4%id, 0.0%wa, 0.0%hi, 0.0%si, 0.2%st
Cpu10 : 0.8%us, 1.5%sy, 0.0%ni, 97.4%id, 0.0%wa, 0.0%hi, 0.0%si, 0.2%st
Cpu11 : 0.8%us, 1.5%sy, 0.0%ni, 97.4%id, 0.0%wa, 0.0%hi, 0.0%si, 0.2%st
Cpu12 : 0.8%us, 1.5%sy, 0.0%ni, 97.5%id, 0.0%wa, 0.0%hi, 0.0%si, 0.2%st
Cpu13 : 0.8%us, 1.5%sy, 0.0%ni, 97.5%id, 0.0%wa, 0.0%hi, 0.0%si, 0.2%st
Mem: 8372060k total, 7750224k used, 621836k free, 720804k buffers
Swap: 1048568k total, 0k used, 1048568k free, 3042316k cached
PID USER PR NI VIRT RES SHR S %CPU %MEM TIME+ COMMAND
8750 root 20 0 13292 7020 448 R 313 0.1 0:15.48 bzip2
3796 www-data 20 0 777m 91m 45m R 109 1.1 0:57.95 php-fpm
8765 root 20 0 0 0 0 R 106 0.0 0:12.03 lfd
9033 root 20 0 0 0 0 R 65 0.0 0:00.42 awk
8608 www-data 20 0 742m 31m 18m R 61 0.4 0:35.34 php-fpm
9032 root 20 0 0 0 0 R 61 0.0 0:00.39 grep
3795 www-data 20 0 767m 79m 41m R 59 1.0 0:57.99 php-fpm
3801 www-data 20 0 784m 97m 43m R 53 1.2 0:49.55 php-fpm
8584 www-data 20 0 742m 29m 17m R 53 0.4 0:38.34 php-fpm
3793 www-data 20 0 769m 82m 44m R 51 1.0 0:56.23 php-fpm
8617 www-data 20 0 740m 21m 10m R 51 0.3 0:31.79 php-fpm
3789 www-data 20 0 791m 122m 61m R 50 1.5 0:18.79 php-fpm
3791 www-data 20 0 782m 97m 45m R 50 1.2 0:38.37 php-fpm
3802 www-data 20 0 790m 106m 46m R 50 1.3 0:36.65 php-fpm
3794 www-data 20 0 777m 91m 45m R 48 1.1 0:50.90 php-fpm
8972 root 20 0 13292 7016 448 R 47 0.1 0:00.37 bzip2
3798 www-data 20 0 767m 79m 42m R 44 1.0 0:48.10 php-fpm
26795 root 20 0 72984 10m 1764 S 44 0.1 0:10.66 nginx
9098 root 20 0 8 4 0 R 42 0.0 0:00.27 bash
8621 www-data 20 0 740m 23m 12m R 41 0.3 0:35.84 php-fpm
9076 root 20 0 8 4 0 R 41 0.0 0:00.26 sh
9096 root 20 0 29420 1732 1280 R 41 0.0 0:00.26 mysqladmin
9099 root 20 0 8 4 0 R 41 0.0 0:00.26 bash
3800 www-data 20 0 772m 88m 47m R 36 1.1 0:51.04 php-fpm
9074 postfix 20 0 39500 3084 2336 S 34 0.0 0:00.22 local
3792 www-data 20 0 760m 74m 44m R 31 0.9 0:42.55 php-fpm
3799 www-data 20 0 760m 73m 43m R 31 0.9 0:48.37 php-fpm
3806 www-data 20 0 824m 140m 48m R 31 1.7 0:44.02 php-fpm
9090 root 20 0 10616 520 304 S 30 0.0 0:00.19 bash
9087 www-data 20 0 72984 9448 504 S 28 0.1 0:00.18 nginx
9095 www-data 20 0 72984 9448 504 S 26 0.1 0:00.17 nginx
9092 www-data 20 0 72984 9448 504 S 25 0.1 0:00.16 nginx
9094 www-data 20 0 72984 9448 504 S 25 0.1 0:00.16 nginx
9089 root 20 0 10616 520 304 S 22 0.0 0:00.14 bash
3805 www-data 20 0 788m 100m 43m R 20 1.2 0:39.67 php-fpm
9034 root 20 0 19200 1444 912 R 20 0.0 0:00.14 top
3804 www-data 20 0 775m 87m 42m R 19 1.1 0:43.48 php-fpm
8555 root 20 0 10752 1580 1228 S 17 0.0 0:04.90 bash
9102 www-data 20 0 72984 9448 504 S 16 0.1 0:00.10 nginx
4125 mysql 20 0 2782m 2.0g 10m S 11 25.4 149:15.28 mysqld
54352 www-data 20 0 73016 10m 1896 S 11 0.1 0:07.75 nginx
9097 root 20 0 10376 908 768 S 9 0.0 0:00.06 awk
9103 www-data 20 0 72984 9448 504 S 9 0.1 0:00.06 nginx
9105 www-data 20 0 72984 9448 504 S 8 0.1 0:00.05 nginx
9106 www-data 20 0 72984 9448 504 S 6 0.1 0:00.04 nginx
54336 www-data 20 0 73016 10m 1888 S 6 0.1 0:00.51 nginx
9108 root 20 0 10376 912 768 S 5 0.0 0:00.03 awk
54350 www-data 20 0 73016 10m 1876 S 5 0.1 0:00.26 nginx
9107 root 20 0 7552 816 704 S 3 0.0 0:00.02 grep
58401 redis 20 0 475m 96m 928 R 3 1.2 5:56.65 redis-server
3790 www-data 20 0 784m 98m 45m R 2 1.2 1:06.53 php-fpm
8435 root 20 0 10752 1584 1228 R 2 0.0 0:00.51 bash
8439 root 20 0 10624 1368 1144 R 2 0.0 0:00.01 bash
9114 root 20 0 39852 2808 2136 R 2 0.0 0:00.01 mysqladmin
54326 www-data 20 0 73016 10m 1920 S 2 0.1 0:00.32 nginx
54335 www-data 20 0 73016 10m 1888 S 2 0.1 0:00.89 nginx
1 root 20 0 8356 768 636 S 0 0.0 0:56.06 init
2 root 20 0 0 0 0 S 0 0.0 0:00.02 kthreadd
3 root RT 0 0 0 0 S 0 0.0 1:14.81 migration/0
4 root 20 0 0 0 0 S 0 0.0 0:55.34 ksoftirqd/0
5 root RT 0 0 0 0 S 0 0.0 0:00.00 watchdog/0
6 root RT 0 0 0 0 S 0 0.0 1:18.11 migration/1
7 root 20 0 0 0 0 S 0 0.0 1:25.48 ksoftirqd/1
8 root RT 0 0 0 0 S 0 0.0 0:00.00 watchdog/1
9 root RT 0 0 0 0 S 0 0.0 1:07.79 migration/2
10 root 20 0 0 0 0 S 0 0.0 1:19.54 ksoftirqd/2
11 root RT 0 0 0 0 S 0 0.0 0:00.00 watchdog/2
12 root RT 0 0 0 0 S 0 0.0 1:10.14 migration/3
13 root 20 0 0 0 0 S 0 0.0 1:45.23 ksoftirqd/3
14 root RT 0 0 0 0 S 0 0.0 0:00.00 watchdog/3
15 root RT 0 0 0 0 S 0 0.0 1:06.61 migration/4
16 root 20 0 0 0 0 S 0 0.0 1:38.65 ksoftirqd/4
17 root RT 0 0 0 0 S 0 0.0 0:00.00 watchdog/4
18 root RT 0 0 0 0 S 0 0.0 1:08.00 migration/5
19 root 20 0 0 0 0 S 0 0.0 1:47.51 ksoftirqd/5
20 root RT 0 0 0 0 S 0 0.0 0:00.00 watchdog/5
21 root RT 0 0 0 0 S 0 0.0 1:09.04 migration/6
22 root 20 0 0 0 0 S 0 0.0 1:37.58 ksoftirqd/6
23 root RT 0 0 0 0 S 0 0.0 0:00.02 watchdog/6
24 root RT 0 0 0 0 S 0 0.0 1:01.77 migration/7
25 root 20 0 0 0 0 S 0 0.0 1:41.73 ksoftirqd/7
26 root RT 0 0 0 0 S 0 0.0 0:00.00 watchdog/7
27 root RT 0 0 0 0 S 0 0.0 1:03.64 migration/8
28 root 20 0 0 0 0 S 0 0.0 1:40.48 ksoftirqd/8
29 root RT 0 0 0 0 S 0 0.0 0:00.00 watchdog/8
30 root RT 0 0 0 0 S 0 0.0 1:07.02 migration/9
31 root 20 0 0 0 0 S 0 0.0 1:42.41 ksoftirqd/9
32 root RT 0 0 0 0 S 0 0.0 0:00.01 watchdog/9
33 root RT 0 0 0 0 S 0 0.0 1:06.05 migration/10
34 root 20 0 0 0 0 S 0 0.0 1:53.33 ksoftirqd/10
35 root RT 0 0 0 0 S 0 0.0 0:00.00 watchdog/10
36 root RT 0 0 0 0 S 0 0.0 1:04.41 migration/11
37 root 20 0 0 0 0 S 0 0.0 1:41.75 ksoftirqd/11
38 root RT 0 0 0 0 S 0 0.0 0:00.02 watchdog/11
39 root RT 0 0 0 0 S 0 0.0 1:05.66 migration/12
40 root 20 0 0 0 0 S 0 0.0 1:28.38 ksoftirqd/12
41 root RT 0 0 0 0 S 0 0.0 0:00.03 watchdog/12
42 root RT 0 0 0 0 S 0 0.0 1:09.50 migration/13
43 root 20 0 0 0 0 S 0 0.0 0:20.79 ksoftirqd/13
44 root RT 0 0 0 0 S 0 0.0 0:00.00 watchdog/13
45 root 20 0 0 0 0 S 0 0.0 0:15.34 events/0
46 root 20 0 0 0 0 S 0 0.0 0:17.34 events/1
47 root 20 0 0 0 0 S 0 0.0 0:15.75 events/2
48 root 20 0 0 0 0 S 0 0.0 0:13.07 events/3
49 root 20 0 0 0 0 S 0 0.0 0:14.61 events/4
50 root 20 0 0 0 0 S 0 0.0 0:18.18 events/5
51 root 20 0 0 0 0 S 0 0.0 0:13.87 events/6
52 root 20 0 0 0 0 S 0 0.0 0:14.11 events/7
53 root 20 0 0 0 0 S 0 0.0 0:14.22 events/8
54 root 20 0 0 0 0 S 0 0.0 0:13.45 events/9
55 root 20 0 0 0 0 S 0 0.0 0:11.05 events/10
56 root 20 0 0 0 0 S 0 0.0 0:11.52 events/11
57 root 20 0 0 0 0 S 0 0.0 0:14.54 events/12
58 root 20 0 0 0 0 S 0 0.0 0:18.84 events/13
59 root 20 0 0 0 0 S 0 0.0 0:00.00 cpuset
60 root 20 0 0 0 0 S 0 0.0 0:00.00 khelper
61 root 20 0 0 0 0 S 0 0.0 0:00.00 netns
62 root 20 0 0 0 0 S 0 0.0 0:00.00 async/mgr
63 root 20 0 0 0 0 S 0 0.0 0:00.00 pm
64 root 20 0 0 0 0 S 0 0.0 0:00.00 xenwatch
65 root 20 0 0 0 0 S 0 0.0 0:00.00 xenbus
66 root 20 0 0 0 0 S 0 0.0 0:02.12 sync_supers
67 root 20 0 0 0 0 S 0 0.0 0:12.15 bdi-default
68 root 20 0 0 0 0 S 0 0.0 0:00.00 kintegrityd/0
69 root 20 0 0 0 0 S 0 0.0 0:00.00 kintegrityd/1
70 root 20 0 0 0 0 S 0 0.0 0:00.00 kintegrityd/2
71 root 20 0 0 0 0 S 0 0.0 0:00.00 kintegrityd/3
72 root 20 0 0 0 0 S 0 0.0 0:00.00 kintegrityd/4
73 root 20 0 0 0 0 S 0 0.0 0:00.00 kintegrityd/5
74 root 20 0 0 0 0 S 0 0.0 0:00.00 kintegrityd/6
75 root 20 0 0 0 0 S 0 0.0 0:00.00 kintegrityd/7
76 root 20 0 0 0 0 S 0 0.0 0:00.00 kintegrityd/8
77 root 20 0 0 0 0 S 0 0.0 0:00.00 kintegrityd/9
78 root 20 0 0 0 0 S 0 0.0 0:00.00 kintegrityd/10
79 root 20 0 0 0 0 S 0 0.0 0:00.00 kintegrityd/11
80 root 20 0 0 0 0 S 0 0.0 0:00.00 kintegrityd/12
81 root 20 0 0 0 0 S 0 0.0 0:00.00 kintegrityd/13
82 root 20 0 0 0 0 S 0 0.0 0:11.55 kblockd/0
83 root 20 0 0 0 0 S 0 0.0 0:00.03 kblockd/1
84 root 20 0 0 0 0 S 0 0.0 0:00.01 kblockd/2
85 root 20 0 0 0 0 S 0 0.0 0:00.01 kblockd/3
86 root 20 0 0 0 0 S 0 0.0 0:00.00 kblockd/4
87 root 20 0 0 0 0 S 0 0.0 0:00.00 kblockd/5
88 root 20 0 0 0 0 S 0 0.0 0:00.00 kblockd/6
89 root 20 0 0 0 0 S 0 0.0 0:00.00 kblockd/7
90 root 20 0 0 0 0 S 0 0.0 0:00.00 kblockd/8
91 root 20 0 0 0 0 S 0 0.0 0:00.00 kblockd/9
92 root 20 0 0 0 0 S 0 0.0 0:00.00 kblockd/10
93 root 20 0 0 0 0 S 0 0.0 0:00.00 kblockd/11
94 root 20 0 0 0 0 S 0 0.0 0:00.00 kblockd/12
95 root 20 0 0 0 0 S 0 0.0 0:00.00 kblockd/13
96 root 20 0 0 0 0 S 0 0.0 0:00.00 kseriod
111 root 20 0 0 0 0 S 0 0.0 0:00.00 kondemand/0
112 root 20 0 0 0 0 S 0 0.0 0:00.00 kondemand/1
113 root 20 0 0 0 0 S 0 0.0 0:00.00 kondemand/2
114 root 20 0 0 0 0 S 0 0.0 0:00.00 kondemand/3
115 root 20 0 0 0 0 S 0 0.0 0:00.00 kondemand/4
116 root 20 0 0 0 0 S 0 0.0 0:00.00 kondemand/5
117 root 20 0 0 0 0 S 0 0.0 0:00.00 kondemand/6
118 root 20 0 0 0 0 S 0 0.0 0:00.00 kondemand/7
119 root 20 0 0 0 0 S 0 0.0 0:00.00 kondemand/8
120 root 20 0 0 0 0 S 0 0.0 0:00.00 kondemand/9
121 root 20 0 0 0 0 S 0 0.0 0:00.00 kondemand/10
122 root 20 0 0 0 0 S 0 0.0 0:00.00 kondemand/11
123 root 20 0 0 0 0 S 0 0.0 0:00.00 kondemand/12
124 root 20 0 0 0 0 S 0 0.0 0:00.00 kondemand/13
125 root 20 0 0 0 0 S 0 0.0 0:00.67 khungtaskd
126 root 20 0 0 0 0 S 0 0.0 0:04.11 kswapd0
127 root 25 5 0 0 0 S 0 0.0 0:00.00 ksmd
128 root 20 0 0 0 0 S 0 0.0 0:00.00 aio/0
129 root 20 0 0 0 0 S 0 0.0 0:00.00 aio/1
130 root 20 0 0 0 0 S 0 0.0 0:00.00 aio/2
131 root 20 0 0 0 0 S 0 0.0 0:00.00 aio/3
132 root 20 0 0 0 0 S 0 0.0 0:00.00 aio/4
133 root 20 0 0 0 0 S 0 0.0 0:00.00 aio/5
134 root 20 0 0 0 0 S 0 0.0 0:00.00 aio/6
135 root 20 0 0 0 0 S 0 0.0 0:00.00 aio/7
136 root 20 0 0 0 0 S 0 0.0 0:00.00 aio/8
137 root 20 0 0 0 0 S 0 0.0 0:00.00 aio/9
138 root 20 0 0 0 0 S 0 0.0 0:00.00 aio/10
139 root 20 0 0 0 0 S 0 0.0 0:00.00 aio/11
140 root 20 0 0 0 0 S 0 0.0 0:00.00 aio/12
141 root 20 0 0 0 0 S 0 0.0 0:00.00 aio/13
142 root 20 0 0 0 0 S 0 0.0 0:00.00 crypto/0
143 root 20 0 0 0 0 S 0 0.0 0:00.00 crypto/1
144 root 20 0 0 0 0 S 0 0.0 0:00.00 crypto/2
145 root 20 0 0 0 0 S 0 0.0 0:00.00 crypto/3
146 root 20 0 0 0 0 S 0 0.0 0:00.00 crypto/4
147 root 20 0 0 0 0 S 0 0.0 0:00.00 crypto/5
148 root 20 0 0 0 0 S 0 0.0 0:00.00 crypto/6
149 root 20 0 0 0 0 S 0 0.0 0:00.00 crypto/7
150 root 20 0 0 0 0 S 0 0.0 0:00.00 crypto/8
151 root 20 0 0 0 0 S 0 0.0 0:00.00 crypto/9
152 root 20 0 0 0 0 S 0 0.0 0:00.00 crypto/10
153 root 20 0 0 0 0 S 0 0.0 0:00.00 crypto/11
154 root 20 0 0 0 0 S 0 0.0 0:00.00 crypto/12
155 root 20 0 0 0 0 S 0 0.0 0:00.00 crypto/13
158 root 20 0 0 0 0 S 0 0.0 0:00.00 khvcd
211 root 20 0 0 0 0 S 0 0.0 0:00.00 kstriped
220 root 20 0 0 0 0 S 0 0.0 3:15.24 kjournald
266 root 16 -4 16744 744 372 S 0 0.0 0:00.21 udevd
304 root 18 -2 16740 724 348 S 0 0.0 0:01.56 udevd
368 root 20 0 0 0 0 S 0 0.0 0:59.78 flush-202:2
720 root 20 0 6468 604 480 S 0 0.0 11:48.57 vnstatd
745 root 20 0 0 0 0 S 0 0.0 0:00.00 kauditd
2933 root 20 0 24572 1240 992 S 0 0.0 0:00.00 sudo
2934 root 20 0 22120 4964 1592 S 0 0.1 0:00.30 bash
3233 root 20 0 19164 1716 1332 S 0 0.0 0:00.25 mysqld_safe
3788 root 20 0 734m 7024 1876 S 0 0.1 0:13.09 php-fpm
3797 www-data 20 0 775m 89m 45m S 0 1.1 0:51.40 php-fpm
3803 www-data 20 0 770m 78m 39m R 0 1.0 0:50.09 php-fpm
4126 root 20 0 5352 688 584 S 0 0.0 0:00.04 logger
4240 tn 20 0 36888 1236 964 S 0 0.0 0:00.00 su
4242 tn 20 0 19312 2036 1480 S 0 0.0 0:00.01 bash
4581 root 20 0 49176 1140 584 S 0 0.0 0:05.97 sshd
4708 root 16 -4 45180 964 612 S 0 0.0 0:00.31 auditd
4710 root 12 -8 14296 780 648 S 0 0.0 0:00.73 audispd
4739 root 20 0 22432 1060 796 S 0 0.0 8:25.19 cron
5897 root 20 0 117m 1676 1068 S 0 0.0 2:47.52 rsyslogd
5961 daemon 20 0 18716 448 284 S 0 0.0 0:00.01 atd
5987 pdnsd 20 0 207m 1984 632 S 0 0.0 2:56.77 pdnsd
6010 messageb 20 0 23268 788 564 S 0 0.0 0:00.01 dbus-daemon
6631 root 20 0 70480 3184 2492 S 0 0.0 0:00.03 sshd
6979 chris 20 0 70480 1584 876 S 0 0.0 0:00.54 sshd
6980 chris 20 0 25736 8528 1544 S 0 0.1 0:00.59 bash
7542 root 20 0 24572 1244 992 S 0 0.0 0:00.00 sudo
7543 root 20 0 22156 5040 1636 S 0 0.1 0:01.79 bash
7621 root 20 0 41872 8756 1820 S 0 0.1 2:25.52 munin-node
7651 root 20 0 5932 612 516 S 0 0.0 0:00.00 getty
8414 root 20 0 32812 1080 776 S 0 0.0 0:00.00 cron
8416 root 20 0 32812 1080 776 S 0 0.0 0:00.00 cron
8419 root 20 0 32812 1080 776 S 0 0.0 0:00.00 cron
8421 root 20 0 32812 1080 776 S 0 0.0 0:00.00 cron
8424 root 20 0 3956 584 488 S 0 0.0 0:00.00 sh
8426 root 20 0 3956 580 484 S 0 0.0 0:00.00 sh
8427 root 20 0 3956 576 484 S 0 0.0 0:00.00 sh
8430 root 20 0 3956 576 484 S 0 0.0 0:00.00 sh
8436 root 20 0 10836 1628 1192 S 0 0.0 0:00.48 metche
8437 root 20 0 10660 1408 1156 S 0 0.0 0:00.00 bash
8477 root 20 0 32812 1080 776 S 0 0.0 0:06.13 cron
8478 root 20 0 32812 1080 776 S 0 0.0 0:01.86 cron
8498 root 20 0 3956 576 484 S 0 0.0 0:03.82 sh
8503 root 20 0 32812 1080 776 S 0 0.0 0:05.74 cron
8505 root 20 0 32812 1080 776 S 0 0.0 0:06.91 cron
8506 root 20 0 3956 580 484 S 0 0.0 0:03.58 sh
8511 root 20 0 32812 1080 776 S 0 0.0 0:07.10 cron
8516 root 20 0 32812 1080 776 S 0 0.0 0:05.77 cron
8520 root 20 0 10672 1436 1168 S 0 0.0 0:03.23 bash
8535 root 20 0 10616 1352 1136 S 0 0.0 0:02.62 bash
8538 root 20 0 3956 580 484 S 0 0.0 0:03.18 sh
8542 root 20 0 3956 580 488 S 0 0.0 0:02.83 sh
8544 root 20 0 3956 580 484 S 0 0.0 0:03.30 sh
8553 root 20 0 10836 1628 1192 S 0 0.0 0:02.57 metche
8557 root 20 0 3956 576 484 S 0 0.0 0:03.26 sh
8560 root 20 0 10660 1416 1156 S 0 0.0 0:04.09 bash
8577 root 20 0 10624 1364 1144 S 0 0.0 0:03.10 bash
8630 root 20 0 32812 1080 776 S 0 0.0 0:06.31 cron
8636 root 20 0 32812 1080 776 S 0 0.0 0:05.83 cron
8637 root 20 0 32812 1080 776 S 0 0.0 0:06.24 cron
8669 root 20 0 3956 576 484 S 0 0.0 0:03.32 sh
8671 root 20 0 3956 576 484 S 0 0.0 0:03.34 sh
8673 root 20 0 3956 580 484 S 0 0.0 0:02.98 sh
8690 root 20 0 10660 1416 1156 S 0 0.0 0:03.71 bash
8692 root 20 0 10616 1348 1136 S 0 0.0 0:02.77 bash
8693 root 20 0 10644 1368 1124 S 0 0.0 0:04.23 bash
8723 root 20 0 32812 1080 776 S 0 0.0 0:05.65 cron
8730 root 20 0 32812 1080 776 S 0 0.0 0:06.05 cron
8736 root 20 0 16852 1080 868 S 0 0.0 0:04.10 tar
8743 root 20 0 32812 1080 776 S 0 0.0 0:06.01 cron
8746 root 20 0 14820 1036 852 D 0 0.0 0:04.12 ps
8749 root 20 0 6028 668 548 S 0 0.0 0:01.04 grep
8751 root 20 0 8172 692 580 S 0 0.0 0:02.43 sed
8752 root 20 0 8852 784 652 S 0 0.0 0:02.86 awk
8759 root 20 0 3956 576 484 S 0 0.0 0:02.64 sh
8762 root 20 0 3956 576 484 S 0 0.0 0:02.69 sh
8781 root 20 0 10624 1368 1144 S 0 0.0 0:02.16 bash
8785 root 20 0 10644 1364 1124 S 0 0.0 0:02.59 bash
8791 root 20 0 3956 580 484 S 0 0.0 0:03.46 sh
8810 root 20 0 8 4 0 R 0 0.0 0:08.50 munin-node
8815 root 20 0 10660 1416 1156 S 0 0.0 0:02.41 bash
8826 root 20 0 32812 1080 776 S 0 0.0 0:01.36 cron
8832 root 20 0 32812 1080 776 S 0 0.0 0:00.57 cron
8833 root 20 0 32812 1080 776 S 0 0.0 0:00.74 cron
8834 root 20 0 5368 560 480 S 0 0.0 0:00.37 sleep
8836 root 20 0 5368 564 480 S 0 0.0 0:00.14 sleep
8857 root 20 0 3956 576 484 S 0 0.0 0:00.00 sh
8868 root 20 0 10616 1348 1136 S 0 0.0 0:00.01 bash
8871 root 20 0 18320 2120 1528 S 0 0.0 0:00.01 perl
8876 root 20 0 3956 576 484 S 0 0.0 0:00.00 sh
8887 root 20 0 10644 1368 1124 S 0 0.0 0:00.00 bash
8894 root 20 0 18320 2120 1528 S 0 0.0 0:00.01 perl
8913 postfix 20 0 39340 2528 2004 S 0 0.0 0:00.01 cleanup
8934 root 20 0 18320 2120 1528 S 0 0.0 0:00.03 perl
8936 postfix 20 0 39252 2400 1908 S 0 0.0 0:00.00 trivial-rewrite
8938 root 20 0 3956 580 484 S 0 0.0 0:00.00 sh
8945 root 20 0 16456 1172 852 D 0 0.0 0:00.02 ps
8946 root 20 0 10660 1412 1156 S 0 0.0 0:00.00 bash
8951 root 20 0 16456 1176 852 D 0 0.0 0:00.02 ps
8963 root 20 0 16852 1080 868 S 0 0.0 0:00.02 tar
8969 postfix 20 0 39500 3084 2336 S 0 0.0 0:00.00 local
8977 root 20 0 16456 1168 852 D 0 0.0 0:00.02 ps
8997 postfix 20 0 39500 3084 2336 S 0 0.0 0:00.01 local
9008 root 20 0 5368 568 480 S 0 0.0 0:00.00 sleep
9020 root 20 0 10616 524 304 S 0 0.0 0:00.00 bash
9046 root 20 0 18320 2100 1508 S 0 0.0 0:00.00 perl
9068 root 20 0 3956 560 468 S 0 0.0 0:00.00 sh
9077 root 20 0 7552 816 704 S 0 0.0 0:00.00 grep
9109 www-data 20 0 72984 9448 504 S 0 0.1 0:00.00 nginx
9111 www-data 20 0 72984 9448 504 S 0 0.1 0:00.00 nginx
9112 root 20 0 10624 528 304 S 0 0.0 0:00.00 bash
9113 www-data 20 0 72984 9448 504 S 0 0.1 0:00.00 nginx
9115 root 20 0 7552 816 704 S 0 0.0 0:00.00 grep
9116 root 20 0 10376 912 768 S 0 0.0 0:00.00 awk
9117 root 20 0 10376 912 768 S 0 0.0 0:00.00 awk
9118 root 20 0 7552 820 704 S 0 0.0 0:00.00 grep
9119 root 20 0 10376 908 768 S 0 0.0 0:00.00 awk
9120 www-data 20 0 72984 9448 504 S 0 0.1 0:00.00 nginx
9121 www-data 20 0 72984 9448 504 S 0 0.1 0:00.00 nginx
9389 root 20 0 37176 2384 1868 S 0 0.0 2:09.44 master
9393 postfix 20 0 39472 2644 1984 S 0 0.0 0:19.14 qmgr
9394 root 20 0 28712 1736 1224 S 0 0.0 0:02.12 pure-ftpd
13773 root 20 0 56612 17m 1544 S 0 0.2 10:44.66 lfd
18931 postfix 20 0 42176 3708 2440 S 0 0.0 0:11.18 tlsmgr
20232 root 18 -2 16740 596 228 S 0 0.0 0:00.00 udevd
39671 root 20 0 70480 3180 2492 S 0 0.0 0:00.02 sshd
39758 chris 20 0 70480 1580 876 S 0 0.0 0:00.13 sshd
39759 chris 20 0 25736 8524 1544 S 0 0.1 0:00.54 bash
39800 root 20 0 24572 1244 992 S 0 0.0 0:00.00 sudo
39801 root 20 0 22104 4920 1568 S 0 0.1 0:00.33 bash
40728 root 20 0 70480 3188 2500 S 0 0.0 0:00.02 sshd
40730 jim 20 0 70480 1592 876 S 0 0.0 0:00.23 sshd
40733 jim 20 0 25652 8452 1552 S 0 0.1 0:01.94 bash
44174 ntp 20 0 38340 2180 1592 S 0 0.0 2:07.16 ntpd
54321 www-data 20 0 73016 10m 1900 S 0 0.1 0:01.90 nginx
54322 www-data 20 0 73016 10m 1904 S 0 0.1 0:00.55 nginx
54324 www-data 20 0 73016 10m 1908 S 0 0.1 0:00.87 nginx
54328 www-data 20 0 73016 10m 1888 S 0 0.1 0:00.17 nginx
54334 www-data 20 0 73016 10m 1892 S 0 0.1 0:03.08 nginx
54337 www-data 20 0 73016 10m 1912 S 0 0.1 0:00.92 nginx
54338 www-data 20 0 73016 10m 1908 S 0 0.1 0:01.37 nginx
54339 www-data 20 0 73016 10m 1888 S 0 0.1 0:00.49 nginx
54340 www-data 20 0 73016 10m 1920 S 0 0.1 0:00.76 nginx
54341 www-data 20 0 73016 10m 1900 S 0 0.1 0:03.03 nginx
54342 www-data 20 0 73016 10m 1888 S 0 0.1 0:00.51 nginx
54343 www-data 20 0 73016 10m 1908 S 0 0.1 0:00.40 nginx
54345 www-data 20 0 73016 10m 1876 S 0 0.1 0:00.27 nginx
54346 www-data 20 0 73016 10m 1880 S 0 0.1 0:11.44 nginx
54347 www-data 20 0 73016 10m 1924 S 0 0.1 0:08.56 nginx
54348 www-data 20 0 73016 10m 1908 S 0 0.1 0:10.32 nginx
54349 www-data 20 0 73016 9448 504 S 0 0.1 0:00.07 nginx
54351 www-data 20 0 73016 10m 1904 S 0 0.1 0:10.71 nginx
54353 www-data 20 0 73016 10m 1912 S 0 0.1 0:03.77 nginx
54354 www-data 20 0 73016 10m 1932 S 0 0.1 0:02.16 nginx
54355 www-data 20 0 73016 10m 1884 S 0 0.1 0:00.61 nginx
54356 www-data 20 0 73016 10m 1896 S 0 0.1 0:00.63 nginx
54357 www-data 20 0 73016 10m 1920 S 0 0.1 0:00.45 nginx
54358 www-data 20 0 73016 9504 560 S 0 0.1 0:06.65 nginx
62065 postfix 20 0 39240 2416 1912 S 0 0.0 0:00.01 pickup
====================
}}}
comment:98 follow-up: ↓ 99 Changed 3 years ago by jim
Odd. What's bzip2 up to??
comment:99 in reply to: ↑ 98 Changed 3 years ago by chris
- Add Hours to Ticket changed from 0.0 to 0.2
- Total Hours changed from 40.28 to 40.48
Replying to jim:
Odd. What's bzip2 up to??
I'd guess that it's apt-get related:
36910 root      20   0 13292 7024  448 R   99  0.1   0:02.11 bzip2
36991 root      20   0 38728  19m  16m R   52  0.2   0:00.27 apt-get
Last nights New Relic reinstall, ticket:586#comment:29 clobbered the changes to /var/xdrago/second.sh so I have re-added the following:
nginx_high_load_on()
{
  mv -f /data/conf/nginx_high_load_off.conf /data/conf/nginx_high_load.conf
  /etc/init.d/nginx reload

  # start additions
  echo "====================" >> /var/log/high-load.log
  echo "nginx high load on" >> /var/log/high-load.log
  echo "ONEX_LOAD = $ONEX_LOAD" >> /var/log/high-load.log
  echo "FIVX_LOAD = $FIVX_LOAD" >> /var/log/high-load.log
  echo "uptime : " >> /var/log/high-load.log
  uptime >> /var/log/high-load.log
  echo "vmstat : " >> /var/log/high-load.log
  vmstat -S M -s >> /var/log/high-load.log
  vmstat -S M -d >> /var/log/high-load.log
  echo "top : " >> /var/log/high-load.log
  top -n 1 -b >> /var/log/high-load.log
  echo "====================" >> /var/log/high-load.log
  # end additions

}
And manually rotated the logs:
cd /var/log
mv high-load.log.1 high-load.log.2
mv high-load.log high-load.log.1
comment:100 Changed 3 years ago by chris
- Add Hours to Ticket changed from 0.0 to 0.2
- Total Hours changed from 40.48 to 40.68
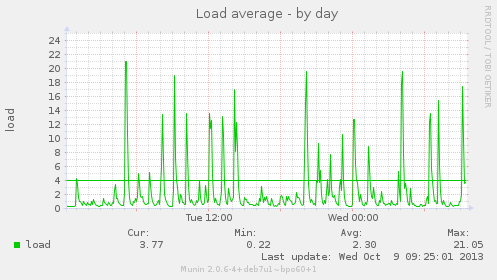
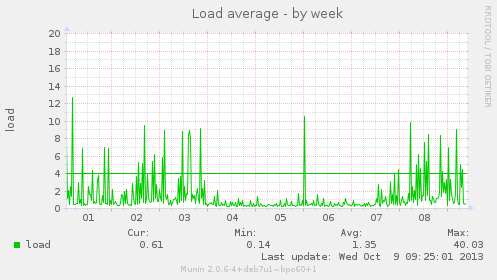
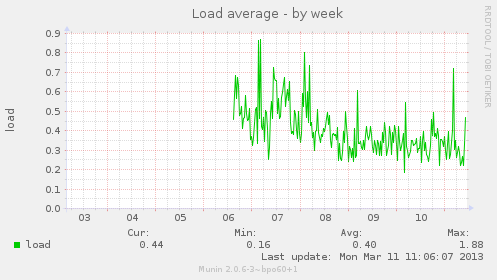
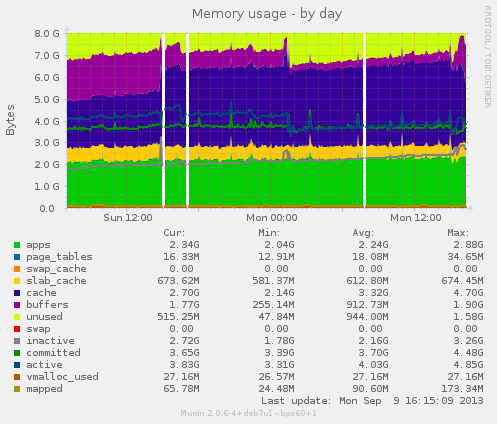
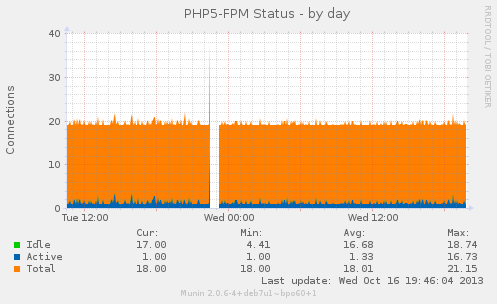
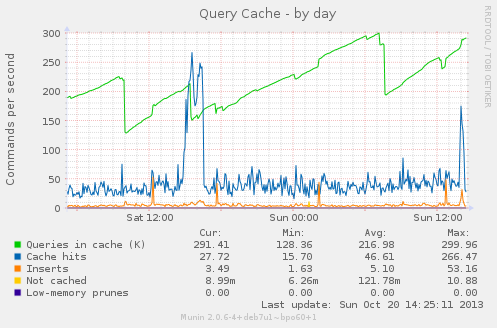
comment:101 Changed 3 years ago by ed
so now we have load spikes *and* NR - this is good timing.
comment:102 Changed 3 years ago by jim
Per my comment over on the NR ticket, NR was NOT collecting data at the time of this spike. It is now...
comment:103 Changed 3 years ago by jim
- Add Hours to Ticket changed from 0.0 to 0.3
- Total Hours changed from 40.68 to 40.98
OK so the database operations become slow occasionally, when a loadspike happens.
According to NR, there was some slow DB ops for url_alias, node, system and term tables, and this appears to have made Drupal slow too.
I then compared this to Munin and in this case there was a huge spike in 'low memory prunes' at that time.
Other spikes have conincided with high numbers of PHP requests...
I'm therefore waiting a 'proper' spike, since these appear to either be rare memory issues or regular usage spikes.
comment:104 Changed 3 years ago by jim
I would add that we can probably remove MANY of the URL aliases which would clean that table up a bit. I'll continue these thoughts on #590.
comment:105 follow-up: ↓ 106 Changed 3 years ago by jim
- Add Hours to Ticket changed from 0.0 to 1.25
- Total Hours changed from 40.98 to 42.23
I have a hunch... It's too coincidental that the load spikes occurred in tandem with the NR install/removal, which ran the BOA install script.
Looking at the events in #599 (clock drift) and this ticket, the start and end of the periods of load spikes coincides to with two things: the BOA script install being run, and my enablement of the cron job that syncs time...
- According to Munin, the load spikes started on the 29th, which is when Chris set up the original clock sync cron job: https://tech.transitionnetwork.org/trac/timeline?from=2013-09-29T21%3A29%3A19%2B01%3A00&precision=second
- NR was 'uninstalled' late on the 10th -- THOUGH this could easily be the 11th as we had such a lot of clock drift.
- NR was reinstalled on 3rd https://tech.transitionnetwork.org/trac/timeline?from=2013-10-03T21%3A28%3A39%2B01%3A00&precision=second -- load spikes stopped. This wiped the date cron job.
- I reinstated the cron job and CSF settings on the 7th. Load spikes started again around that time.
Now there's a few hours discrepancy here, but we cannot actually trust the times in Munin or Trac during this period.
My hunch is that the server software including MySQL, Drupal, Redis, Munin and NR are being confused by the time being changed so often, and that is the reason for the load spikes.
The simple test is to disable the Chris' cron date sync job per the last comment on #599 and wait a day or so.
Ideally though the clock would just work!
If I don't hear anything from Chris before tomorrow noon I'll disable the cron job and test myself.
Adding time for this detective work, plus 1 hour for my meeting with Ed at 2.15pm.
comment:106 in reply to: ↑ 105 Changed 3 years ago by chris
- Add Hours to Ticket changed from 0.0 to 1.0
- Total Hours changed from 42.23 to 43.23
Replying to jim:
My hunch is that the server software including MySQL, Drupal, Redis, Munin and NR are being confused by the time being changed so often, and that is the reason for the load spikes.
I don't doubt that the clock drift and it being reset every min, could be causing some confusion. But I doubt it's the cause of the load spikes as these pre-date the clock problems.
I have written up a summary of what the load trigger thresholds are for BOA for Ed at wiki:PuffinServer#LoadSpikes the key sentance being:
When the load hits 3.88 robots are served 403 Forbidden responses and when the load hits 18.88 maintenance tasks are killed and when the load hits 72.2 the server terminates until the 5 min load average falls below 44.4.
Note that the Max load for the last month is 40.97 and for the last year 95.23, see the puffin munin load graphs.
comment:107 follow-up: ↓ 108 Changed 3 years ago by ed
Thanks Chris, pls can you define a maintenance task? will that affect a user editing a blog post for example?
comment:108 in reply to: ↑ 107 Changed 3 years ago by chris
- Add Hours to Ticket changed from 0.0 to 0.1
- Total Hours changed from 43.23 to 43.33
Replying to ed:
can you define a maintenance task? will that affect a user editing a blog post for example?
No, it shouldn't, it's tasks which are run via cron as far as I'm aware, Jim should be able to confirm this, these are the processes which are killed when the load reaches 18.88:
if test -f /var/run/boa_run.pid ; then
sleep 1
else
killall -9 php drush.php wget
fi
comment:109 Changed 3 years ago by jim
Agreed, doing a killall -9 php drush.php wget won't do much except ensure the system isn't downloading or running maintenance stuff.
comment:110 Changed 3 years ago by ed
ta
comment:111 follow-up: ↓ 115 Changed 3 years ago by chris
- Add Hours to Ticket changed from 0.0 to 0.2
- Total Hours changed from 43.33 to 43.53
We had a massive load spike this evening, this is the Munin load graph:
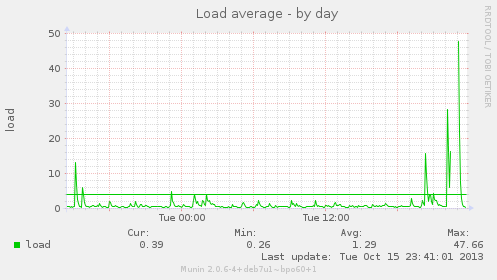
But this understates how big it was, this is the Munin email I got at the height of it:
Date: Tue, 15 Oct 2013 23:02:03 +0100
Subject: puffin.transitionnetwork.org Munin Alert
transitionnetwork.org :: puffin.transitionnetwork.org :: Load average
CRITICALs: load is 91.54 (outside range [:8]).
This was high enough for the server to kill itself, see wiki:PuffinServer#LoadSpikes
comment:112 Changed 3 years ago by jim
- Add Hours to Ticket changed from 0.0 to 0.05
- Total Hours changed from 43.53 to 43.58
The gaps in Munin whenever it gets spicy render it nearly useless for establishing any kind of cause and effect. And webalizer seems to just aggregate so drilling down to an hour is impossible (I think?).
Would be great to know what the precursor was -- though I note a spike in PHP-FPM active connections just before it dies -- and a spike in CPU before that. 
Some questions:
- Can we rule in or out a network/traffic issue somehow? I'm concerned we wouldn't know if the server was getting slammed as Munin dies as soon as it does.
- Can we tell if it's choking because of software glitches somewhere, or because of a burst of hits? (this is nearly the same question as 1, but turning the question into the server, rather than out onto the network).
- Can we increase the resolution of Munin down to a minute window? And make the zoom function work?
Chris, Ed?
comment:114 Changed 3 years ago by chris
Sorry I haven't had time this week to look at the logs to try and work out what the cause of the massive load spike was on Tuesday, I'll try to spend some time on it later today or over the weekend.
comment:115 in reply to: ↑ 111 Changed 3 years ago by chris
- Add Hours to Ticket changed from 0.0 to 1.6
- Total Hours changed from 43.58 to 45.18
Replying to chris:
We had a massive load spike this evening
Looking at the Piwik stats this day had more page views than any, bar one, this year:
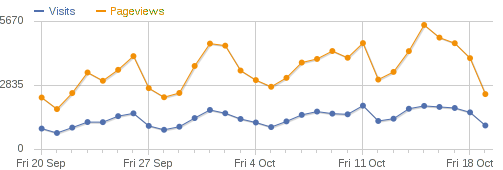

Looking at the Ngnix logs for the day there was:
- 77,544 Hits
- 7,276 Unique Visitors
- 2.556 GB Bandwidth
These figures are taken from running goaccess against the log file:
sudo -i cd /var/log/nginx gunzip awstats.log.6.gz goaccess -b -s -f awstats.log.6
And this is a screenshot of the top of the output:
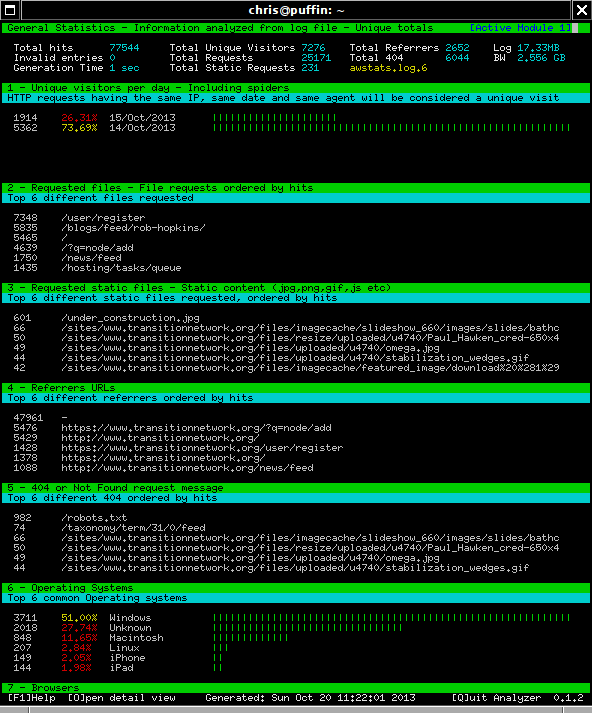
Further down there are hits by top IP addresses and one in Cote D'Ivoire Abidjan accounts for 12.20% of the hits, 9,463 lines in the access log file, these are the stats for the traffic from that IP address:

The hits from this IP address started at 14/Oct/2013:10:42:01 and ended at 14/Oct/2013:13:00:23, so the load spike cannot be solely attributed to the traffic from this IP, which also has a user agent string which indicates that it is a spider:
- Mozilla/5.0 (Windows NT 6.1; WOW64) AppleWebKit/537.36 (KHTML, like Gecko) Chrome/27.0.1453.110 Safari/537.36 Squider/0.01
The Munin Email at the height of the load spike was at 23:02:03 so taking the logs from 22:30 to 23:30 and we have:
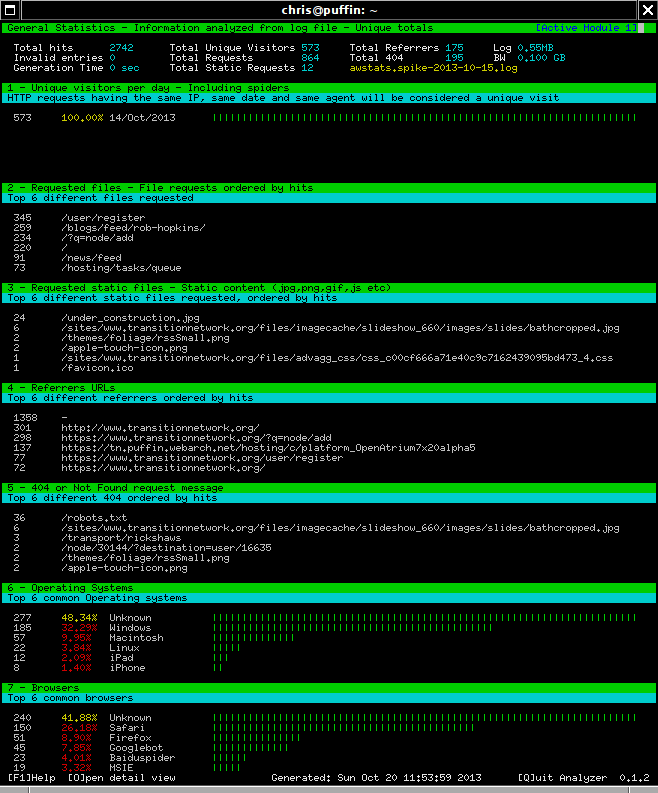
Things to note here:
- Total hits 2742
- Total Unique Visitors 573
- BW 0.100 GB
- Common browsers: 7.85% Googlebot
962 lines of the logs, out of 2,742, have the same user agent:
- Mozilla/5.0 (Windows NT 5.1) AppleWebKit/537.36 (KHTML, like Gecko) Chrome/27.0.1453.116 Safari/537.36
Of these 962 lines a total of 309 contain "register" and 532 contain "add" -- this was clearly a spam bot trying to register accounts and to post content.
But also there were some jobs that looks like admin was being done on the site just at the time of the massive load spike, perhaps by Jim? Specifically these POST's:
127.0.0.1 - - [14/Oct/2013:22:59:29 +0100] "POST /node/81?destination=node%2F81 HTTP/1.0" 302 0 "https://tn.puffin.webarch.net/" "Mozilla/5.0 (X11; Linux x86_64) AppleWebKit/537.36 (KHTML, like Gecko) Chrome/30.0.1599.66 Safari/537.36" 127.0.0.1 - - [14/Oct/2013:23:00:04 +0100] "POST /node/671/delete HTTP/1.0" 302 0 "https://tn.puffin.webarch.net/node/671/delete" "Mozilla/5.0 (X11; Linux x86_64) AppleWebKit/537.36 (KHTML, like Gecko) Chrome/30.0.1599.66 Safari/537.36" 127.0.0.1 - - [14/Oct/2013:23:00:59 +0100] "POST /hosting/js/node/691/platform_migrate?token=XXXXXXXXXXXXXXXXXXXXXXXXXXXXXXXXXXXXXXXXXXXXXX HTTP/1.0" 302 0 "https://tn.puffin.webarch.net/hosting/js/node/691/platform_migrate?token=XXXXXXXXXXXXXXXXXXXXXXXXXXXXXXXXXXXXXXXXXXXXXX" "Mozilla/5.0 (X11; Linux x86_64) AppleWebKit/537.36 (KHTML, like Gecko) Chrome/30.0.1599.66 Safari/537.36" 127.0.0.1 - - [14/Oct/2013:23:01:00 +0100] "POST /hosting/js/batch?id=1&op=do HTTP/1.0" 200 99 "https://tn.puffin.webarch.net/hosting/js/batch?op=start&id=1" "Mozilla/5.0 (X11; Linux x86_64) AppleWebKit/537.36 (KHTML, like Gecko) Chrome/30.0.1599.66 Safari/537.36"
My conclusion is that the site was getting a fair amount of bot activity, both "good" (GoogleBot) and bad (spam bots) and that this also coincided with a popular day for the site, but the thing that probably caused the massive load spike was work being done on the site via the https://tn.puffin.webarch.net/ domain. If this is right then I must admit I find it a little worrying that doing work to migrate platforms via https://tn.puffin.webarch.net/ appears to have the potential to cause load spikes which result in BOA shutting the server down -- isn't this the worst time to have drush and php cli tasks killed (this happens when the load hits 18.88) and ngnix and php-fpm killed when the load hits 72.2 -- the load reached 91.54.
Regarding the questions Jim asked:
Some questions:
- Can we rule in or out a network/traffic issue somehow? I'm concerned we wouldn't know if the server was getting slammed as Munin dies as soon as it does.
- Can we tell if it's choking because of software glitches somewhere, or because of a burst of hits? (this is nearly the same question as 1, but turning the question into the server, rather than out onto the network).
- Can we increase the resolution of Munin down to a minute window? And make the zoom function work?
I think 1. and 2. have been more-or-less answered? Regarding 3. the way to increase the resolution would be to make the zoom work, this is something I spent a little time when it was installed but concluded that it probably wasn't worth spending too much time on, I could revisit this but I'd suggest it's something that perhaps we revisit after we have upgraded to Wheezy?
comment:116 Changed 3 years ago by chris
- Add Hours to Ticket changed from 0.0 to 0.4
- Total Hours changed from 45.18 to 45.58
Yesterday we had the first load spike since we have migrated to the ZFS server and it's clear from these munin stats that it was caused by a spike in traffic:

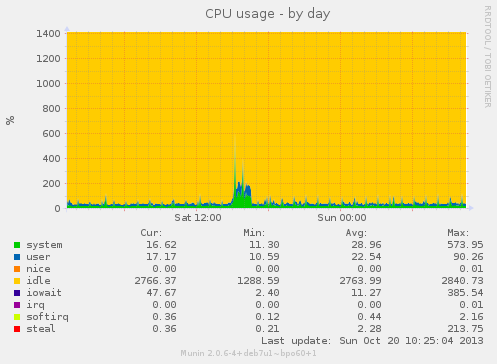
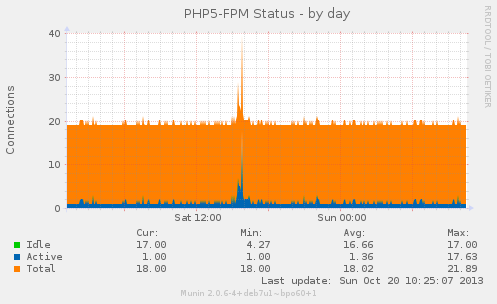
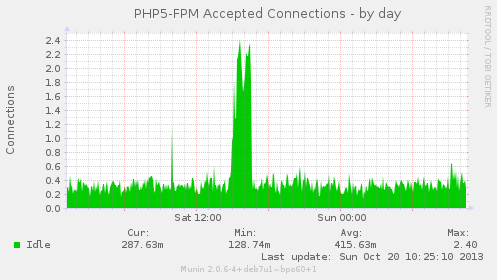


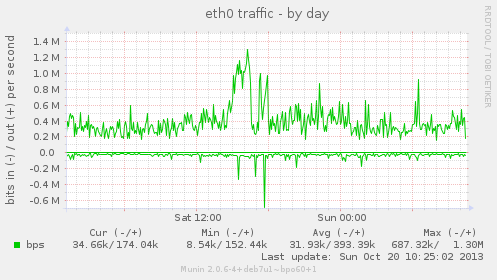


The ldf email alert recorded the spike as resulting in a load of 21.78:
From: root@puffin.webarch.net Date: Sat, 19 Oct 2013 15:06:36 +0100 (BST) Subject: lfd on puffin.webarch.net: High 5 minute load average alert - 7.36 Time: Sat Oct 19 15:06:35 2013 +0100 1 Min Load Avg: 21.78 5 Min Load Avg: 7.36 15 Min Load Avg: 2.86 Running/Total Processes: 34/343
Taking the ngnix logs from 19/Oct/2013:15:00:00 to 19/Oct/2013:15:10:00 there was:
- Total hits 1092
- Total Unique Visitors 142
- Total Requests 91
- 70.70% of hits from one IP address
This one IP address, a dynamic French IP address, had a total of 772 hits in this 10 min period, 0.032 GB of bandwidth was used and again it was the same "Squider" spider found last Tuesday:
- Mozilla/5.0 (Windows NT 6.1; WOW64) AppleWebKit/537.36 (KHTML, like Gecko) Chrome/27.0.1453.110 Safari/537.36 Squider/0.01
This bot is listed here
I don't know if it is a "good" or a "bad" bot, but it appears to me that this load spike can be attributed to this bot.
comment:117 follow-up: ↓ 118 Changed 3 years ago by jim
- Add Hours to Ticket changed from 0.0 to 0.1
- Total Hours changed from 45.58 to 45.68
Three things:
- I was indeed doing work on the server when you suggested above... Building and migrating platforms is pretty IO intensive (backups, file moves, downloads) so that's expected and unavoidable. I'll try to do them later in the day in future.
- I say we block Squider. It smells bad, works bad and clearly falls into the 'misuse' category. If there's legitimate use for it, then let other sites humour its users. KILL IT!
- It seems we're on the downward slope, load spike-wise... During the 'motherboard pain days' things were really bad, then recently they got pretty good and some Drupal work reduced IO needs further, now with the IO boosted by the ZFS move, we're in good shape. If it turns out that most spikes are now caused by a few misbehaving users/bots, we're in very good shape. Time will tell...
comment:118 in reply to: ↑ 117 ; follow-up: ↓ 119 Changed 3 years ago by chris
- Add Hours to Ticket changed from 0.0 to 0.25
- Total Hours changed from 45.68 to 45.93
Replying to jim:
- I was indeed doing work on the server when you suggested above... Building and migrating platforms is pretty IO intensive (backups, file moves, downloads) so that's expected and unavoidable. I'll try to do them later in the day in future.
It was late in the day 11pm, I'm not sure if any later would make that much difference?
If the result of using the web interface to build and migrate platforms is the server killing itself for 15 or 20 mins then this indicates to me that the application needs faster, more powerful hardware to run it (the load reached 91.54, which is significantly above the suicide threshold which is currently set at 72.2). Or am I missing something here?
- I say we block Squider. It smells bad, works bad and clearly falls into the 'misuse' category. If there's legitimate use for it, then let other sites humour its users. KILL IT!
Personally I be interested in knowing more about it before blocking it, but I'm not that fussed, how would it be best blocked? At a BOA/Drupal, Nginx or firewall level?
- It seems we're on the downward slope, load spike-wise... During the 'motherboard pain days' things were really bad, then recently they got pretty good and some Drupal work reduced IO needs further, now with the IO boosted by the ZFS move, we're in good shape. If it turns out that most spikes are now caused by a few misbehaving users/bots, we're in very good shape. Time will tell...
Perhaps, I think it's probably too soon to call this, we have just had another load spike and weekends generally have a lot less traffic than weekdays...
Just now the load went over 44, the ldf email:
From: root@puffin.webarch.net Date: Sun, 20 Oct 2013 14:11:47 +0100 (BST) Subject: lfd on puffin.webarch.net: High 5 minute load average alert - 11.99 Time: Sun Oct 20 14:11:47 2013 +0100 1 Min Load Avg: 44.32 5 Min Load Avg: 11.99 15 Min Load Avg: 4.41 Running/Total Processes: 44/341
And some Munin graphs:
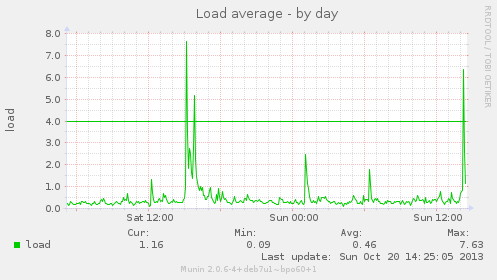
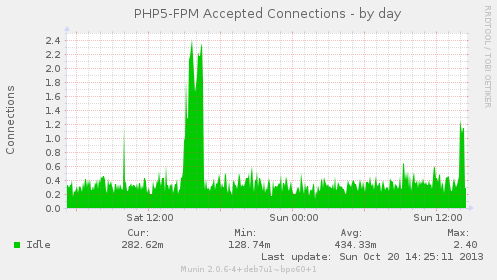


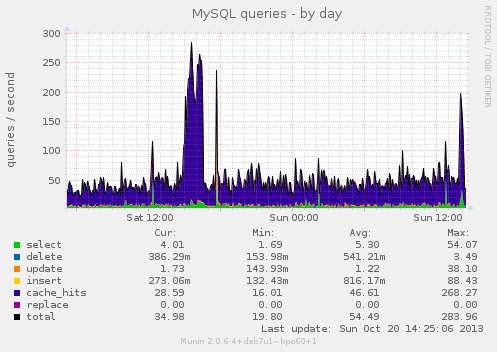
comment:119 in reply to: ↑ 118 ; follow-up: ↓ 120 Changed 3 years ago by jim
- Add Hours to Ticket changed from 0.0 to 0.05
- Total Hours changed from 45.93 to 45.98
Replying to chris:
If the result of using the web interface to build and migrate platforms is the server killing itself for 15 or 20 mins then this indicates to me that the application needs faster, more powerful hardware to run it (the load reached 91.54, which is significantly above the suicide threshold which is currently set at 72.2). Or am I missing something here?
You're jumping to some pretty big concussions there! It's far more likely that a load spike coincided with the work I was doing. The hardware is ample now it is working properly.
Aegir is actually a set of Drush commands that the web interface kicks off... So command line or web UI it's the same.
Finally, backing up, cloning, and tweaking a database from such a big site as TN.org is highly IO intensive, as is safely moving sites around and reloading Nginx when done. These tasks are not common in normal usage and is not a risk to the server.
comment:120 in reply to: ↑ 119 Changed 3 years ago by chris
- Add Hours to Ticket changed from 0.0 to 0.25
- Total Hours changed from 45.98 to 46.23
Replying to jim:
It's far more likely that a load spike coincided with the work I was doing.
The migrate POST happened at 23:00:59 and the load hit 91.54 at 23:02:03 -- these things happened at basically the same time, I'm not convinced that this was a coincidence.
The work you were doing that evening "hung", was this perhaps caused by the load reaching 18.88 and then the drush and php processes being killed by second.sh?
Finally, backing up, cloning, and tweaking a database from such a big site as TN.org is highly IO intensive, as is safely moving sites around and reloading Nginx when done. These tasks are not common in normal usage and is not a risk to the server.
Can I suggest that the next time you do any tasks like this, using the web interface, you keep a very close eye on the load, eg by running top in a terminal and see what level it reaches?
comment:121 Changed 3 years ago by chris
- Add Hours to Ticket changed from 0.0 to 0.1
- Total Hours changed from 46.23 to 46.33
We just has another load spike which came close to the 18.88 php and drush killing threshold:
From: root@puffin.webarch.net Date: Sun, 20 Oct 2013 16:44:01 +0100 (BST) Subject: lfd on puffin.webarch.net: High 5 minute load average alert - 6.36 Time: Sun Oct 20 16:44:01 2013 +0100 1 Min Load Avg: 17.91 5 Min Load Avg: 6.36 15 Min Load Avg: 3.14 Running/Total Processes: 24/333
The Munin graphs are based on the 5 Min Load Avg so they don't record the peaks as high as they reach:
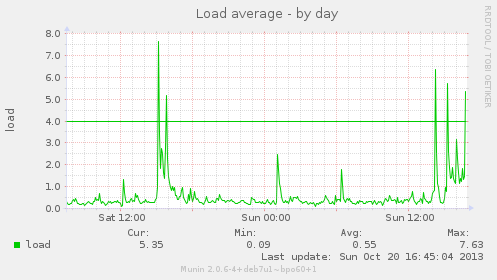
comment:122 follow-up: ↓ 124 Changed 3 years ago by jim
- Add Hours to Ticket changed from 0.0 to 0.05
- Total Hours changed from 46.33 to 46.38
It's likely these particular load spikes almost certainly coincide with Aegir backing up the STG database in preparation to migrate/clone the site. That will take up a fair amount of IO/CPU.
Chris, did you add the top, uptime and vmstat output to the high load syslog entries as discussed? Would be nice to know what as running at the time
comment:123 Changed 3 years ago by jim
It's worth adding that the recent work on boa has only been going on for 7-10 days so it cannot be the only cause....
comment:124 in reply to: ↑ 122 Changed 3 years ago by chris
- Add Hours to Ticket changed from 0.0 to 0.5
- Total Hours changed from 46.38 to 46.88
Replying to jim:
Chris, did you add the top, uptime and vmstat output to the high load syslog entries as discussed? Would be nice to know what as running at the time
Yes, but not the date / time so it'll be hard to find the right part of the log file, sorry, I'll look if you want by working it out from the uptimes. I have manually rotated the log now it so it'll be in /var/log/high-load.log.1.
I have now added in a date so it'll be easier to find things in the future, this is what we now have in /var/xdrago/second.sh:
nginx_high_load_on()
{
mv -f /data/conf/nginx_high_load_off.conf /data/conf/nginx_high_load.conf
/etc/init.d/nginx reload
# start additions
echo "====================" >> /var/log/high-load.log
date >> /var/log/high-load.log
echo "nginx high load on" >> /var/log/high-load.log
echo "ONEX_LOAD = $ONEX_LOAD" >> /var/log/high-load.log
echo "FIVX_LOAD = $FIVX_LOAD" >> /var/log/high-load.log
echo "uptime : " >> /var/log/high-load.log
uptime >> /var/log/high-load.log
echo "vmstat : " >> /var/log/high-load.log
vmstat -S M -s >> /var/log/high-load.log
vmstat -S M -d >> /var/log/high-load.log
echo "top : " >> /var/log/high-load.log
top -n 1 -b >> /var/log/high-load.log
echo "====================" >> /var/log/high-load.log
# end additions
}
I also think we should try to radically change these variables in /var/xdrago/second.sh:
CTL_ONEX_SPIDER_LOAD=388 CTL_FIVX_SPIDER_LOAD=388 CTL_ONEX_LOAD=7220 CTL_FIVX_LOAD=4440 CTL_ONEX_LOAD_CRIT=1888 CTL_FIVX_LOAD_CRIT=1555
We have already changed the two of them from their defaults by editing /root/.barracuda.cnf and multiplying these values by 5:
#_LOAD_LIMIT_ONE=1444 #_LOAD_LIMIT_TWO=888 _LOAD_LIMIT_ONE=7220 _LOAD_LIMIT_TWO=4440
Remember we have 14 cores (see [https://en.wikipedia.org/wiki/Load_average#Unix-style_load_calculation Wikipedia on Unix-style load calculation) so if we multiply the original values by 6 we then have these values in /var/xdrago/second.sh:
CTL_ONEX_SPIDER_LOAD=2328 CTL_FIVX_SPIDER_LOAD=2328 CTL_ONEX_LOAD=8664 CTL_FIVX_LOAD=5328 CTL_ONEX_LOAD_CRIT=11328 CTL_FIVX_LOAD_CRIT=9330
This would mean that the new thresholds would be:
- When the load hits 23.28 then robots are served 403 Forbidden responses
- When the load hits 86.64 then drush and php maintenance tasks are killed until the 5min load drops below 53.28
- When the load hits 113.28 then the web server applications are killed until the 5min load drops below 93.30
And dividing the above by 14 we get:
- When the load hits 1.66 then robots are served 403 Forbidden responses
- When the load hits 6.19 then drush and php maintenance tasks are killed until the 5min load drops below 3.81
- When the load hits 8.09 then the web server applications are killed until the 5min load drops below 6.66
Perhaps these values are too low, if we multiply by 7 we get:
CTL_ONEX_SPIDER_LOAD=2716 CTL_FIVX_SPIDER_LOAD=2716 CTL_ONEX_LOAD=10108 CTL_FIVX_LOAD=6216 CTL_ONEX_LOAD_CRIT=13216 CTL_FIVX_LOAD_CRIT=10885
This would mean that the new thresholds would be:
- When the load hits 27.16 then robots are served 403 Forbidden responses
- When the load hits 101.08 then drush and php maintenance tasks are killed until the 5min load drops below 62.16
- When the load hits 132.16 then the web server applications are killed until the 5min load drops below 108.85
And dividing the above by 14 we get:
- When the load hits 1.94 then robots are served 403 Forbidden responses
- When the load hits 7.22 then drush and php maintenance tasks are killed until the 5min load drops below 4.44
- When the load hits 9.44 then the web server applications are killed until the 5min load drops below 7.78
This would mean that the load spike of 91 the other day wouldn't have caused drush and php tasks to be killed.
Jim, Alan, does this sound sensible to you?
comment:125 Changed 3 years ago by chris
- Add Hours to Ticket changed from 0.0 to 1.5
- Total Hours changed from 46.88 to 48.38
I have looked though all the Octopus tickets and I couldn't find a question like the following:
second.sh kill thresholds and multiple CPU cores
Every minute /var/xdrago/second.sh is run by cron and it contains loops through itself every 10 seconds and checks the load levels and if kills tasks is set thresholds are breached, the default settings result in a load of 18.88 cause php and drush tasks to be killed and a load of 14.44 causes the web server to be killed, this is my reading of the script:
- If the load average over the last minute is greater than 3.88 and less than 14.44 and the nginx high load config isn't in use then start to use it.
- Else if the load average over the last 5 mins is greater than 3.88 and less than 8.88 and the nginx high load config isn't in use then start to use it.
- Else if the load average over the last minute is less than 3.88 and the the load average over the last 5 mins is less than 3.88 and the nginx high load config is in use then stop using it.
- If the load average over the last minute is greater than 18.88 and if /var/run/boa_run.pid exists, wait a second, if not kill some maintenance jobs: killall -9 php drush.php wget
- Else if the load average over the last 5 mins is greater than 15.55 and if /var/run/boa_run.pid exists, wait a second, if not kill some maintenance jobs: killall -9 php drush.php wget
- If the load average over the last minute is greater than 14.44 then kill the web server, killall -9 nginx and killall -9 php-fpm php-cgi
- Else if the load average over the last 5 mins is greater than 8.88 then kill the web server, killall -9 nginx and killall -9 php-fpm php-cgi
- Else restart all the services via /var/xdrago/proc_num_ctrl.cgi
How many cores are these thresholds based on?
The thresholds for killing the server are configurable vi these variables in /root/.barracuda.cnf:
_LOAD_LIMIT_ONE=1444 _LOAD_LIMIT_TWO=888Could the thresholds for triggering the high load config and killing drush and php also be made configurable?
The current default settings do not appear to be suited for a server with a lot of CPU cores, what should the default values be multiplied by?
However the above isn't in the correct format, so I was looking at munging it into the correct format and gathering the info that needs to be posted, which includes /root/.tn.octopus.cnf and I see this file has these settings:
_CLIENT_OPTION="SSD" _CLIENT_CORES="8"
The server isn't running of SSDs and there are 14 not 8 cores.
Grepping the BOA code, which I downloaded as a zip file from github these files contain "CLIENT_CORES":
- ./nginx-for-drupal-master/OCTOPUS.sh.txt
- ./nginx-for-drupal-master/docs/cnf/octopus.cnf
- ./nginx-for-drupal-master/aegir/scripts/AegirSetupC.sh.txt
- ./nginx-for-drupal-master/aegir/scripts/AegirSetupB.sh.txt
- ./nginx-for-drupal-master/aegir/scripts/AegirSetupA.sh.txt
- ./nginx-for-drupal-master/aegir/tools/system/weekly.sh
The first file above contains:
if [ ! -e "/data/disk/$_USER/log/cores.txt" ] ; then echo $_CLIENT_CORES > /data/disk/$_USER/log/cores.txt fi
And the /data/disk/tn/log/cores.txt files does exist and it simply contains the number 8, I suggest we increase this to 14.
However the second file contains:
_CLIENT_OPTION="SSD" #---------- Currently not used _CLIENT_CORES="8" #------------- Currently not used
So I'm not sure if this value is used?
The 3rd and 4th files limit the platforms available to servers with less then 2 cores (eg no !CiviCRM if you only have one core).
I can't find any code which causes the correct value for the number of cores to be written to /data/disk/tn/log/cores.txt automatically.
For the SSD option it looks like this is related to disk space, rather then IO speed, in nginx-for-drupal-master/aegir/tools/system/weekly.sh there is this code:
check_limits () {
read_account_data
if [ "$_CLIENT_OPTION" = "POWER" ] ; then
_SQL_MIN_LIMIT=5120
_DSK_MIN_LIMIT=51200
_SQL_MAX_LIMIT=$(($_SQL_MIN_LIMIT + 256))
_DSK_MAX_LIMIT=$(($_DSK_MIN_LIMIT + 5120))
elif [ "$_CLIENT_OPTION" = "SSD" ] ; then
_SQL_MIN_LIMIT=512
_DSK_MIN_LIMIT=10240
_SQL_MAX_LIMIT=$(($_SQL_MIN_LIMIT + 128))
_DSK_MAX_LIMIT=$(($_DSK_MIN_LIMIT + 2560))
else
_SQL_MIN_LIMIT=256
_DSK_MIN_LIMIT=5120
_SQL_MAX_LIMIT=$(($_SQL_MIN_LIMIT + 64))
_DSK_MAX_LIMIT=$(($_DSK_MIN_LIMIT + 1280))
fi
Perhaps we should simply raise the kill thresholds as suggested in ticket:555#comment:124 and not bother raising this as a BOA ticket because we can't suggest a general "proposed resolution"?
comment:126 Changed 3 years ago by chris
- Add Hours to Ticket changed from 0.0 to 0.1
- Total Hours changed from 48.38 to 48.48
We are running out of budget for this month so I have applied the suggested changes from ticket:555#comment:124 and saved a copy of the modified second.sh script to /root/ and I have also changed /data/disk/tn/log/cores.txt and /root/.tn.octopus.cnf to show 14 rather than 8 cores.
comment:127 Changed 3 years ago by chris
- Add Hours to Ticket changed from 0.0 to 0.25
- Total Hours changed from 48.48 to 48.73
I have updated the load spike docs and also updated /root/.barracuda.cnf with the new values and updated the upgrade notes.
comment:128 follow-up: ↓ 130 Changed 3 years ago by jim
- Add Hours to Ticket changed from 0.0 to 0.5
- Total Hours changed from 48.73 to 49.23
I agree with Chris's load threshold changes, and yes the cores thing is not needed/used for us.
So... The question is: should we raise a Barracuda ticket so the changes to second.sh are avoided? I.e. make https://tech.transitionnetwork.org/trac/wiki/PuffinServer#xdragoshellscriptchanges part of the customisable bits for BOA.
I say yes. I'd suggest a check in second.sh for a /root/.barracuda-variables.cnf file and load the values from there if it exists, otherwise use the defaults in the control() function in second.sh.
D.org is still down for the scheduled upgrade, but I'll do this shortly, but a first stab at such a patch would be:
In second.sh we add a new function that limits from /root/.barracuda-overrides.cnf file, if it exists:
load_limits()
{
if [ -e " /root/.barracuda-overrides.cnf" ] ; then
source /root/.barracuda-overrides.cnf
else
CTL_ONEX_SPIDER_LOAD=388
CTL_FIVX_SPIDER_LOAD=388
CTL_ONEX_LOAD=1444
CTL_FIVX_LOAD=888
CTL_ONEX_LOAD_CRIT=1888
CTL_FIVX_LOAD_CRIT=1555
fi
}
Then we can remove the hard coded limits in the control() function and instead put a call to load_limits() in the bottom of the file just before it starts the control function calls
load_limits <-- new control <-- as before sleep 10 ... etc ...
Chris, your thoughts? If it looks good to you I'll make an actual patch on GitHub/Drupal?.org.
comment:129 Changed 3 years ago by chris
- Add Hours to Ticket changed from 0.0 to 0.25
- Total Hours changed from 49.23 to 49.48
It's worth noting that the wiki:ServerBandwidth for April, May, June 2013:
month rx | tx | total | avg. rate
------------------------+-------------+-------------+---------------
Apr '13 68.61 GiB | 14.06 GiB | 82.66 GiB | 267.52 kbit/s
May '13 65.49 GiB | 22.61 GiB | 88.10 GiB | 275.92 kbit/s
Jun '13 68.12 GiB | 16.18 GiB | 84.31 GiB | 272.85 kbit/s
Basically doubled for July, August, September and October 2013:
month rx | tx | total | avg. rate
------------------------+-------------+-------------+---------------
Jul '13 113.14 GiB | 21.98 GiB | 135.12 GiB | 423.18 kbit/s
Aug '13 124.42 GiB | 17.20 GiB | 141.62 GiB | 443.56 kbit/s
Sep '13 139.33 GiB | 13.78 GiB | 153.10 GiB | 495.49 kbit/s
Oct '13 143.35 GiB | 13.97 GiB | 157.32 GiB | 492.72 kbit/s
Time wise this also more-or-less corresponds with the increase in load spikes.
It's also worth noting that there hasn't been a corresponding increase in the number of visitors recorded by Piwik:

It's worth noting that the bandwidth usage only went up in one direction (outgoing).
According to pingdom this is the current size of the front page, by domain the content was loaded from:
www.transitionnetwork.org 773.1 kB s.ytimg.com 43.5 kB stats.transitionnetwork.org 22.2 kB www.youtube.com 10.4 kB i1.ytimg.com 0 B
And this is by content type:
Image 647.4 kB CSS 76.7 kB Script 74.7 kB Other 27.0 kB HTML 23.4 kB
Was there a site redesign around this time that added a/some big image(s) to the front page perhaps?
comment:130 in reply to: ↑ 128 Changed 3 years ago by chris
- Add Hours to Ticket changed from 0.0 to 0.1
- Total Hours changed from 49.48 to 49.58
Replying to jim:
So... The question is: should we raise a Barracuda ticket so the changes to second.sh are avoided?
That would be good :-)
I say yes. I'd suggest a check in second.sh for a /root/.barracuda-variables.cnf file and load the values from there if it exists, otherwise use the defaults in the control() function in second.sh.
I'm happy with you suggesting it is done like this but I'd guess they might want to put the variables in the already existing /root/.barracuda.cnf file, but we can leave the implementation detail to them to sort as they see fit.
Chris, your thoughts? If it looks good to you I'll make an actual patch on GitHub/Drupal.org.
Go for it, I think having a suggested patch, even if they chose to implement the feature in another way, is good.
comment:131 Changed 3 years ago by chris
- Add Hours to Ticket changed from 0.0 to 0.5
- Total Hours changed from 49.58 to 50.08
Based on a look at the munin stats I have tweaked some things:
php-fpm processes
We had the default number of php-fpm processes that come with BOA, 18, we really don't need this many, so I have edited /opt/local/etc/php53-fpm.conf and changed these values:
;pm.start_servers = 18 pm.start_servers = 4 ;pm.max_spare_servers = 18 pm.max_spare_servers = 4
And restarted:
/etc/init.d/php53-fpm restart
And updated the docs at wiki:PuffinServer#php-fpmconfigchanges
MySQL query cache
This was increased from 512MB to 1GB 3 weeks ago but since then the memory use hasn't got above 460MB so I have reduced it to 512MB again via editing /etc/mysql/my.cnf:
query_cache_size = 512M
MySQL connections
We have hit the limit of 40 so that has been increased to 60 in /etc/mysql/my.cnf:
max_connections = 60 max_user_connections = 60
IO state graph
This had stopped working:
Fixed by removing the state files:
rm /var/lib/munin-node/plugin-state/nobody/iostat-ios.state /var/lib/munin/plugin-state/iostat-ios.state
Changed 3 years ago by chris
- Attachment puffin_2013-12-15_load-pinpoint_1363530313_1387203913.png added
Puffin Load Spikes 2013
comment:132 Changed 3 years ago by chris
- Add Hours to Ticket changed from 0.0 to 0.1
- Status changed from new to closed
- Resolution set to fixed
- Total Hours changed from 50.08 to 50.18
I'm closing this ticket as the load spikes that started in May 2013 and persisted through to mid October 2013 are now not happening to the same extent, see this graph of the load on puffin:

This ticket isn't the only one related to this issue, there are also the following ones, which have been listed in the Load Spikes documentation, wiki:PuffinServer#LoadSpikes. Following is addition of the time spent on these tickets:
- 16.35 ticket:483 Nginx 502 Bad Gateway Errors with BOA
- 00.55 ticket:543 Puffin Load Spike
- 01.00 ticket:552 Puffin Downtime 23rd May 2013
- 00.75 ticket:554 Site slow down and MySQL load increase
- 50.08 ticket:555 Load spikes causing the TN site to be stopped for 15 min at a time
- 06.95 ticket:563 503 Errors
- 01.60 ticket:569 403s served to editors, admin very slow
- 00.25 ticket:576 Site down
Total: 77.53 which is 77 hours 31 mins and 48 seconds -- approx two weeks work.
comment:133 Changed 3 years ago by chris
Posting the documentation of this issue as of 2013-01-13 from the wiki:PuffinServer page here in anticipation of all this documentation being deleted after the next BOA update:
Load Spikes
The server has been suffering from load spikes which cause the site to be unresponsive for clients, you can see the current status via the puffin Munin load graph, note the Max values for the last day, week, month and year.
When the load hits 23.28 robots are served 403 Forbidden responses and when the load hits 86.64 maintenance tasks are killed and when the load hits 113.28 the server terminates until the 5 min load average falls below 93.30.
The default thresholds have been changed as they were causing the shut to shutdown for 15 min at a time far too often, the current values were applied on 23rd October 2013.
The server has 14 CPU cores, see Unix-style load calculation, the current thresholds are generated from these variables in /root/.barracuda.cnf, the commented out values are the default ones:
#_LOAD_LIMIT_ONE=1444 #_LOAD_LIMIT_TWO=888 _LOAD_LIMIT_ONE=8664 _LOAD_LIMIT_TWO=5328
These variables are used by the /var/xdrago/second.sh script, which is run every minute via cron and has a internal loop which causes it to run 5 times, waiting 10 seconds between each run, and it has the following variables in it (these have been edited from their default values):
ONEX_LOAD=`awk '{print $1*100}' /proc/loadavg`
FIVX_LOAD=`awk '{print $2*100}' /proc/loadavg`
CTL_ONEX_SPIDER_LOAD=2328
CTL_FIVX_SPIDER_LOAD=2328
CTL_ONEX_LOAD=8664
CTL_FIVX_LOAD=5328
CTL_ONEX_LOAD_CRIT=11328
CTL_FIVX_LOAD_CRIT=9330
These values translate to the following loads for comparison to the Munin graphs:
- ONEX_LOAD: load average over the last minute times 100
- FIVX_LOAD: load average over the last 5 minutes times 100
- CTL_ONEX_SPIDER_LOAD: 23.28
- CTL_FIVX_SPIDER_LOAD: 23.28
- CTL_ONEX_LOAD: 86.64
- CTL_FIVX_LOAD: 53.28
- CTL_ONEX_LOAD_CRIT: 113.28
- CTL_FIVX_LOAD_CRIT: 93.30
And the logic, translated into english, is:
- If the load average over the last minute is greater than 23.28 and less than 86.64 and the nginx high load config isn't in use then start to use it.
- Else if the load average over the last 5 mins is greater than 23.28 and less than 53.28 and the nginx high load config isn't in use then start to use it.
- Else if the load average over the last minute is less than 23.28 and the the load average over the last 5 mins is less than 23.28 and the nginx high load config is in use then stop using it.
- If the load average over the last minute is greater than 132.16 and if /var/run/boa_run.pid exists, wait a second, if not kill some maintenance jobs: killall -9 php drush.php wget
- Else if the load average over the last 5 mins is greater than 108.85 and if /var/run/boa_run.pid exists, wait a second, if not kill some maintenance jobs: killall -9 php drush.php wget
- If the load average over the last minute is greater than 101.08 then kill the web server, killall -9 nginx and killall -9 php-fpm php-cgi
- Else if the load average over the last 5 mins is greater than 62.16 then kill the web server, killall -9 nginx and killall -9 php-fpm php-cgi
- Else restart all the services via /var/xdrago/proc_num_ctrl.cgi
Tickets generated in relation to these issues include:
- ticket:483 Nginx 502 Bad Gateway Errors with BOA
- ticket:543 Puffin Load Spike
- ticket:552 Puffin Downtime 23rd May 2013
- ticket:554 Site slow down and MySQL load increase
- ticket:555 Load spikes causing the TN site to be stopped for 15 min at a time
- ticket:563 503 Errors
- ticket:569 403s served to editors, admin very slow
- ticket:576 Site down
A total of 77.5 hours was spent on the tickets listed above, the final one was closed on 15th December 2013 and the total time was added up, see ticket:555#comment:132.
I have taken another look through all the log files I can find to try to see the cause of this problem.
Recent load spikes from the lfd log:
It's worth noting that these are 5 minute load averages -- the highest load during these spikes will have been higher still, like this morning when the 1 Min Load Avg was 23 when the 5 minute load average email was sent, see above.
I can't see a pattern here but it's an issue we need to keep an eye on as there are several of these spikes a day, I still don't know what the cause was or why nginx and php53-fpm stopped running.